








Square
Following
Hot
News
Notifications
Profile
Share your thoughts
placeholder
Article
Damn, 360 blocked my system, so I can't click it
post-image
What is a retest confirmation? Why can a price retesting a key level after a breakout sometimes provide a better entry reference, yet also fall back into its previous range?

In cryptocurrency trading, a price does not necessarily continue rising immediately after breaking through resistance. Sometimes it returns to the breakout level to test it. If the former resistance zone turns into support, this may provide a reference for trading with the trend. But a retest is no guarantee of success, and the price may still fall back into its previous trading range.

First, what is a retest confirmatio
post-image
Trenches
fxUSD
f
bade
b
fxUSD
0x08...d8f6
Market Cap
$.
Change
.
24h Vol
$.
Holders
.
ZIG
Z
bade
b
ZIG
0x8c...1145
Market Cap
$.
Change
.
24h Vol
$.
Holders
.
BTC
B
bade
b
BTC
C5xp...pump
Market Cap
$.
Change
.
24h Vol
$.
Holders
.
CORLA
C
bade
b
CORLA
0xba...7777
Market Cap
$.
Change
.
24h Vol
$.
Holders
.
STONK
S
bade
b
STONK
6GmA...UNgx
Market Cap
$.
Change
.
24h Vol
$.
Holders
.
$AKE From 0.0019 to 0.0045 in 24 hours, now at 0.0044, up 73%, with $266 million in trading volume—retail traders alone can't generate that kind of volume; someone must know something and be scrambling to accumulate. My trading logic is straightforward: tokens that surge and double on heavy volume, then consolidate at highs, have only two possible paths—either they consolidate and change hands before a second leg up, or this is the last respectable act before distribution. My approach is not to chase now; I’ll place bids at 0.0040–0.0041 to catch a pullback, with only 20% of my position alloca
AKE+6.07%
  • 9
  • 2
Hey everyone, welcome to the livestream.

Today is day two of the 100U test. We’re not talking about trading with big money or making claims about guaranteed profits. We’re simply using 100U to live-test a short-term strategy on the 1-minute timeframe.

The position size is very small right now. This is purely to test the strategy’s logic and execution and see how it performs in the current market in terms of win rate, drawdown, and actual profit and loss.
post-image
What Is Trendline Trading? How Can You Identify a Valid Trendline, and Why Might the Same Trendline Be Broken Repeatedly?

In cryptocurrency trading, a trendline is a straightforward technical analysis tool. By connecting a series of price highs or lows, traders can observe the market’s overall direction and look for potential entry and exit opportunities. But trendlines are not unbreakable boundaries: no matter how neatly drawn, they cannot guarantee that prices will move as expected.

First, what is trendline trading?

Trendline trading involves connecting significant price highs or lows to
post-image
What Is the Risk-Reward Ratio? Why Can a Trade Have Long-Term Value Even With a Low Win Rate, as Long as Risk Is Properly Managed?

In cryptocurrency trading, many people focus too much on win rate, believing that they need to make frequent correct calls to make money. But what really affects long-term trading results is not just the win rate, but also the amount won or lost on each trade. The risk-reward ratio is an important tool that helps traders assess whether a trade is worth taking.

First, what is the risk-reward ratio?

The risk-reward ratio typically compares a trade’s potential loss
post-image
330U Copy Trading Experiment | Day 30

I smart-copied a top trader's trades!
Come take a look (^v^)
Starting capital: 330U; current funds: 435.76U; return: 153.26%. (400U has been withdrawn during this period)

Just a quick update today:

Currently flat, waiting for Aoying's next trade.
My hands are idle, but my eyes are on the market, waiting for a signal.

Keep it up, guys!
Believe in the power of belief! 🦅
post-image
  • 2
🔥 What are we discussing today? Trending topics on Gate Square have been updated!

🔹 #Epic Sell-Off in U.S. Stocks
Tech stocks are facing a wave of heavy selling. Will this correction continue?
🔹 #October Nonfarm Payrolls in Focus
The nonfarm payrolls report is due tonight. Will it trigger a market rebound or further losses?
🔹 #Crypto Market Under Pressure
$BTC and $ETH are following global risk assets lower. Is now the time to buy the dip or keep waiting?

Quality content can receive a traffic boost + featured recommendations.
💰 Got a take? Join the discussion:
https://www.gate.com/post
GateSquare
🔥 What are we discussing today? Trending topics on Gate Square have been updated!

🔹 #Epic Sell-Off in U.S. Stocks
Tech stocks are facing a wave of heavy selling. Will this correction continue?
🔹 #October Nonfarm Payrolls in Focus
The nonfarm payrolls report is due tonight. Will it trigger a market rebound or further losses?
🔹 #Crypto Market Under Pressure
$BTC and $ETH are following global risk assets lower. Is now the time to buy the dip or keep waiting?

Quality content can receive a traffic boost + featured recommendations.
💰 Got a take? Join the discussion:
https://www.gate.com/post/topic

repost-content-media
BTC-0.67%
ETH-1.26%
  • 3
  • 1
$AIN At this point, the people I’ve let down the most are my family
AIN+3.85%
  • 3
crypto market updates
live-cover
LIVE1,816
$Q All in, ready for takeoff🛫🛫
post-image
Q-28.72%
  • 1
I've emphasized countless times that in the current environment, all macro signals other than interest rates are noise for gold. Otherwise, why do you think $XAU has been the lone standout in this downturn?
post-image
XAU+0.38%
📡 Signal card · repost version
Source: AMAN channel (just captured; capture time not specified) Asset: $AVAX Long entry: 9.7 Stop-loss: 9.5 Targets: 9.73 / 9.77 / 9.8
Come to think of it, I reposted AMAN's $TAO trade earlier today, and now here's another one—their trigger finger is pretty quick 💅
Sis is only reposting it exactly as-is; not a single number has been changed. Whether to follow and how much to put in is up to you all; you bear the risk.
For personal record-sharing purposes only; not investment advice. #Strategy: STRC resumes issuance after more than 170 days
AVAX-0.10%
TAO+0.41%
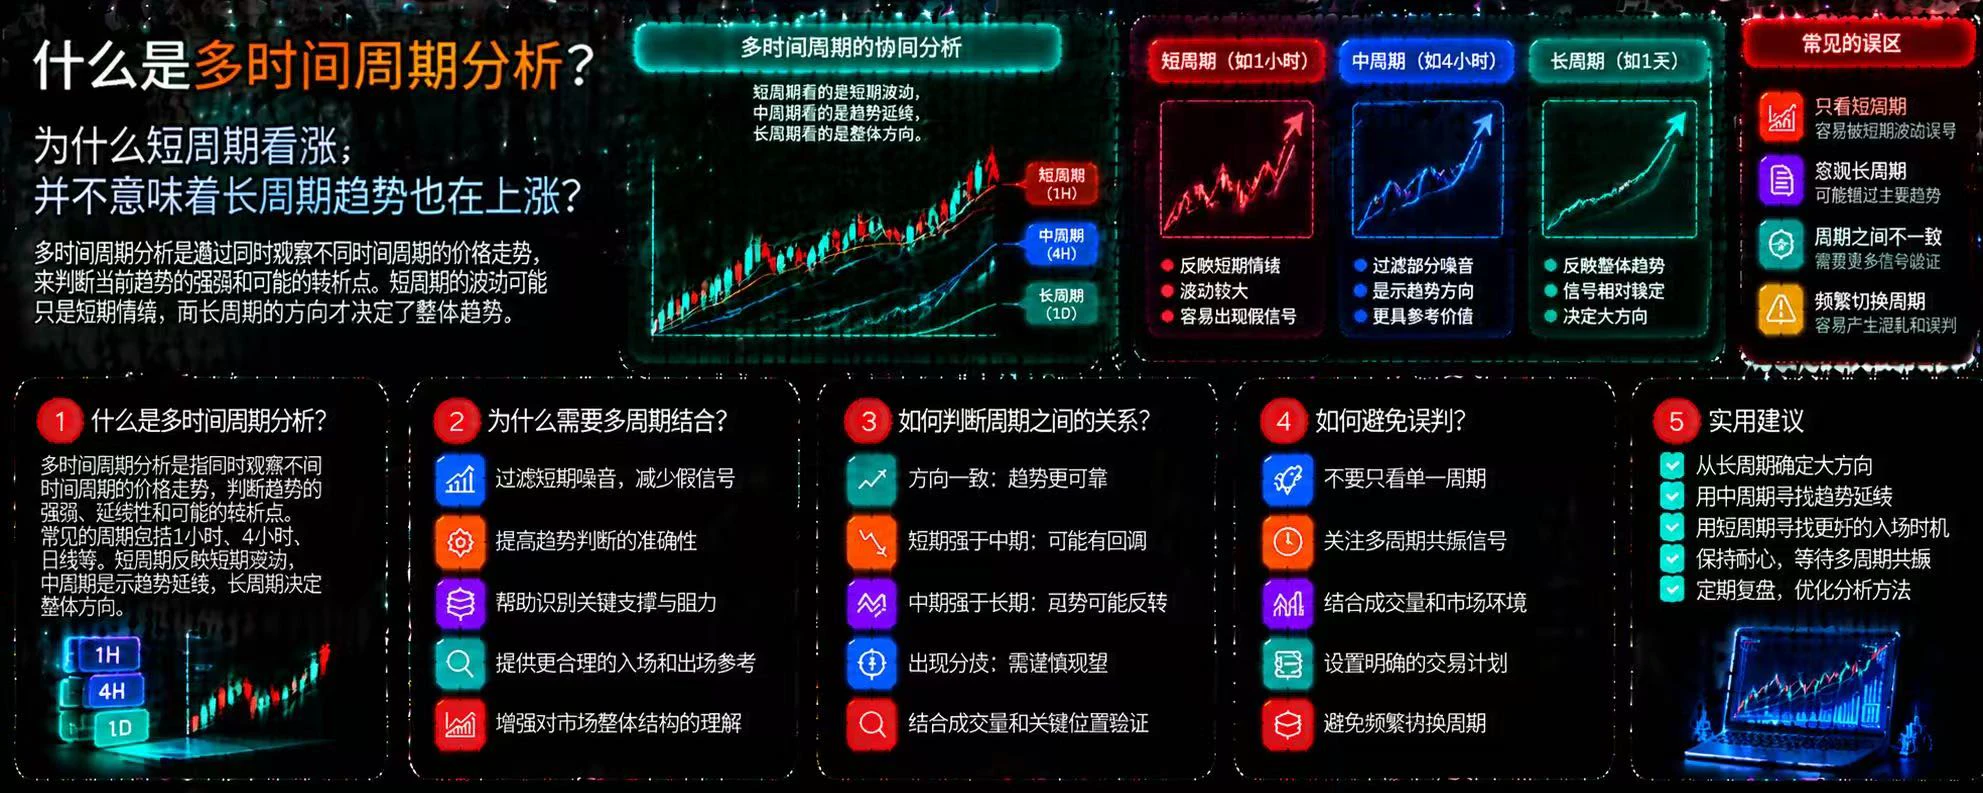
What Is Multi-Timeframe Analysis? Why Doesn’t a Bullish Short-Term View Mean the Long-Term Trend Is Also Rising?

In cryptocurrency trading, the same asset can show completely different price action across timeframes. The 15-minute chart may be rising while the 4-hour chart remains in a downtrend, and the daily chart may show a market moving sideways. Looking at just one timeframe can easily lead you to mistake a temporary rebound for a trend reversal.

First, what is multi-timeframe analysis?

Multi-timeframe analysis means observing price action across different timeframes at the same time t
post-image
The fourth trade is already up 8 points. I’ve moved the stop to breakeven—holding tight #Gate安全卫士免费开通
Gold special session: starting Monday, copy trade with $300. Copy trading is closed for today; back at it next Monday!
GLDX-0.40%
PAXG+0.37%
  • 1
🪔 HAPPY DHANTERAS 2026 🪔
🙏 शुभ धनतेरस
✨ May Goddess Lakshmi bless you and your family with wealth, good health, happiness & prosperity.❤️
🙏 धनतेरस की हार्दिक शुभकामनाएँ!
❤️ With Love
🔥 TEAM CRYPTO AMAN 🔥
post-image
GM CT ✌🏿✌🏿
Today will b green 💹
post-image
CT-12.34%
📡 Real-time Signal Card · BTCSOS Capture
Source: Crypto Boss Target: $BTC Long entry: 83050 Target: 83450 / 83700 / 84150 Stop-loss: 82500
Speaking of which, earlier today (11-06), I had just copied the Boss's $BTC trade, and now here comes another 👀
As usual: I only relay and sync the trades; whether to follow and how large a position to take are up to you. The market can go crazy, but risk management can't go crazy with it. Shared as a personal record, not investment advice. #Nasdaq100 index falls 6%
BTC-0.67%
Load More

Join 40 M users in our growing community

⚡️ Join 40 M users in the crypto craze discussion

💬 Engage with your favorite top creators

👍 See what interests you

Trending Topics

USStocksFaceHistoricSelloff

1.63k Views3.53k Discussing

U.S. stocks suffered a sharp selloff on Thursday, with the Nasdaq closing down more than 5% and the Philadelphia Semiconductor Index falling over 12%. AI and chip stocks including $NVDA and $AMD were hit especially hard. Markets are reassessing AI valuations, data-center spending and future returns. Is this just short-term deleveraging, or the start of a deeper correction in the AI trade? Which sectors are you watching next?

GateLaunchesPoSECProofOfSecurity

12.56k Views576 Discussing

USNonfarmPayrolls

9.83k Views4.01k Discussing

View More