Square
Following
Hot
News
Profile
Share your thoughts
placeholder
Article
Your strategy determines your opportunities.
Your position sizing determines your survival.
post-image
This woman is very wealthy, but she’s genuinely low-key.
( new streamer ) market overview
live-cover
LIVE1,206
$INJ Short setup… price is testing a strong resistance zone INJ has surged strongly from around 7.05 to the 8.50–8.56 resistance zone. The rebound momentum is strong, but this is exactly where I would stop chasing longs. Short entry: 8.30–8.60 (filled) Next target price: 8.20 Take profit 1: 8.00 Take profit 2: 7.80 Final target: 7.65 Stop-loss: 9.00 After the rapid rebound, the move is beginning to look somewhat overextended, while the price is currently just below resistance. If buyers fail to break through 8.56 effectively, I expect the price to first pull back to test around 8.20, followed
post-image
INJ+10.59%
$SIVE 🇸🇪
It’s breaching the neckline (red zone). It broke below the accumulation triangle, though the week hasn’t closed yet
post-image
$SIREN What’s so impressive about a 44% one-day pump? Let’s see it avoid a sharp wick down. The 24h low was 0.0203 and the high was 0.0332, a 63% swing. This isn’t a pump—it’s a meat grinder. The 95.9M trading volume shows that the tokens have already changed hands like crazy. There’s only one bullish argument: this kind of volume isn’t something retail traders can generate. If the pullback to 0.028-0.030 holds, that’s a second entry point; set the stop-loss at 0.026—if it breaks, even the whales have lost their nerve. The bearish case is even stronger: a 44% gain combined with massive 95.9M v
SIREN+10.64%
What is the easiest trap to fall into in this $ZEC rally
$ZEC There is a very typical debate right now: one side uses 24-hour +9.15% to prove the direction, while the other counters with key levels. I am not taking sides based on the gain for now, because $ZEC remains strong, while the crowded positioning is already out in the open and has yet to deliver a complete answer. I acknowledge that the trend is strong, but what matters next is not how much higher it can surge, but whether anyone steps in during the first pullback.
The timeframes have not delivered a direct verdict for either side. Th
post-image
ZEC+6.84%
I checked @CoinMarketCap 's market movements, and $NEAR is among the tokens showing positive momentum.
What makes this project interesting to me is that it goes beyond token price. NEAR is building blockchain infrastructure focused on scalability, user-friendly applications, cross-chain transactions, and AI-powered systems.
The ecosystem is positioning itself at the intersection of Web3 and AI, two areas worth watching as blockchain adoption evolves.
But here is my take: a green candle alone is not enough to make me bullish on a token. I want to see sustained momentum, healthy trading volume,
post-image
$AGT Square has scored a resounding victory for the fifth consecutive month. The more people try to suppress us, the more we stand out; the more people try to suppress us, the better we perform; the more people try to suppress us, the stronger people's trust in us becomes.
1,200 traders, 1,200 qualified individuals. Thank you to each and every one of you. $ZE
$ETH
post-image
ETH+1.41%
$FIL I was the one who dumped it to the low of 1.0014, so don't rush to curse me.
Before a pump, someone has to wash out the weak hands. Do you think the 20% move from 1.0014 to 1.2009 formed naturally? That sharp drop in the early session was my 1,880-lot sell order, specifically hunting stop-loss orders around 1.05. After wiping out the long liquidity, I turned around and started buying at 1.01. At least 30% of the 218.2M trading volume consisted of my matched orders—without creating the volume, how would retail traders dare to follow?
It's now 1.1764, up 7.83%, and my core position is alrea
FIL+6.18%
  • 1
$FET took me through a trade like this: the hardest part is knowing when to exit.
This feels like a good spot. Close the position right here. Watching these two today: $SO and $BAT .
post-image
FET+4.26%
BAT+28.27%
$NEAR NEAR Breaks Out of a 4-Year Descending Channel: TP1: $11
NEARUSDT
Weekly Time Frame:
NEAR (1W, log scale) is breaking out of the descending channel that has defined price action since the 2022 top, and the weekly candle is now pushing above the upper boundary.
What the chart shows:
After the 2022 high (~20.6), price spent years in a descending channel, bottoming around the 0.9 area in early 2026.
Since that low, price has risen sharply and is now trading at ~5.4, above the channel’s upper trendline.
The breakout is happening at the 2024 volume profile POC (~5.2), so the trendline and a h
post-image
NEAR+7.84%
we crushed the PPI news 📊
VELO protocol is going for a new high, definitely higher than 2025. Let’s go 🚀📈
$VELO
post-image
VELO+0.34%
If you lost money in this token, you probably deserved it.
post-image
TOKEN+1.69%
$DRAM Price is falling while open interest is rising—the old tactic of shorts adding positions to suppress the price is all too familiar.👀 With 70% of traders crowded into longs, the longer they hold, the worse the cascade. Wobbling around the midrange at 49.37, 49.03 is the last fig leaf; break it, and 50 becomes an iron ceiling. Retreat quickly.😤
post-image
DRAM+0.10%
Many people see the funding rate turn positive and MACD turn green and automatically assume “the bulls are back,” then chase in with oversized positions—this is the most common position-sizing mistake: treating indicator direction as an entry signal while ignoring the moving-average structure and volatility levels. $BERA is a textbook example of this trap.
First, the structure: current price 0.2284, MA5=0.2311 remains below MA20=0.231595, and the short-term moving average has not crossed above, meaning the bearish alignment has yet to be repaired; RSI=47.3 is stuck in the neutral-to-weak zone
post-image
BERA-7.54%
America before websites had pop up ads
post-image
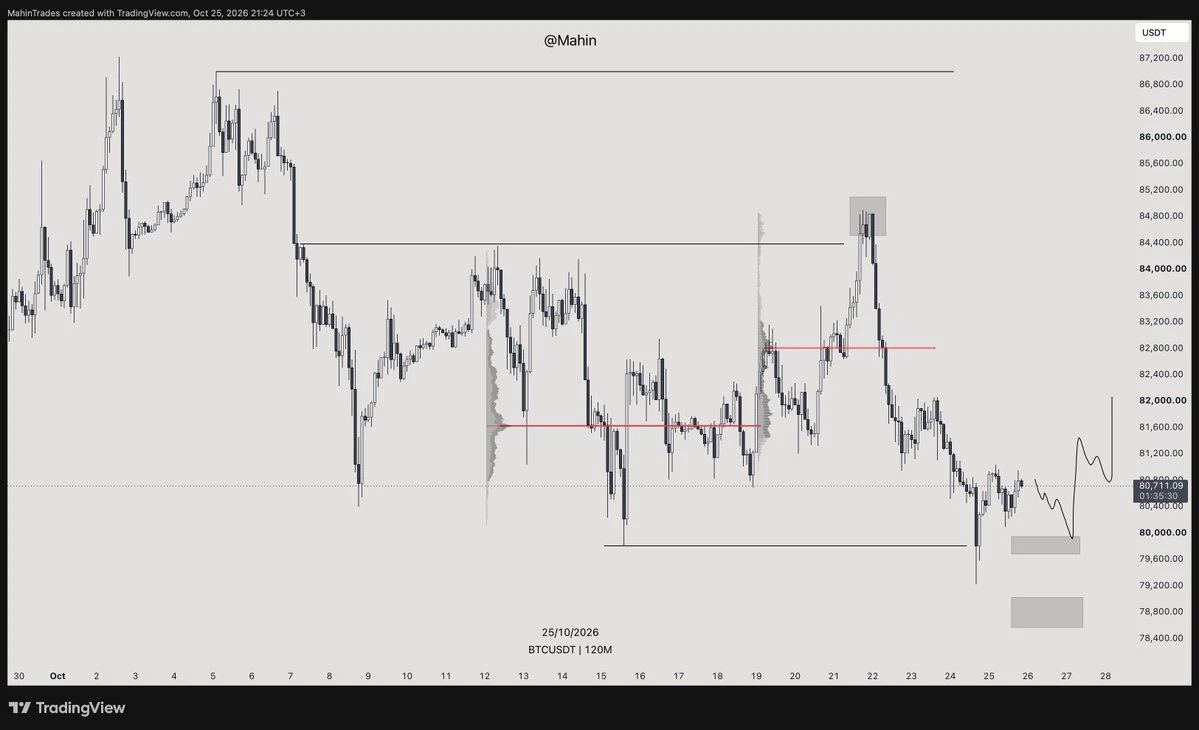
Bitcoin Support and Resistance Levels
live-cover
LIVE701
I’ve turned off the $STRK gainers-and-losers board for now, and that leaves just one question on the chart: after $STRK’s sharp 24-hour surge, momentum and continuation are still not the same thing.
$STRK is currently at 0.08691, up 13.95% over 24 hours. The 1-hour support is 0.0718, resistance is 0.09874, and current volume is 0.16 times the average volume of the past 20 candles.
My view for now is this: I won’t extrapolate the large move that has already occurred into the next leg. First, I’ll watch whether the price can settle in the new range. To the upside, merely touching 0.09874 doesn’
post-image
STRK+12.86%
Load More

Join 40 M users in our growing community

⚡️ Join 40 M users in the crypto craze discussion

💬 Engage with your favorite top creators

👍 See what interests you

Trending Topics

USSeptemberPPIBeatsExpectations

91.35k Views1.88k Discussing

US September PPI came in at 6.3% YoY, well above the 5.3% market expectation, pointing to renewed producer-side inflation pressure. Weekly jobless claims were 199K, broadly in line with forecasts. Could hotter inflation further reduce room for rate cuts, and what does it mean for $BTC, US stocks, and gold?

DrLinHanSpeaksAtOxfordUnion

135.63k Views1.86k Discussing

JapanAndKoreaStocksPlunge

47.27k Views1.76k Discussing

View More