
Square
Following
Hot
News
Notifications
Profile
Share your thoughts
placeholder
Article
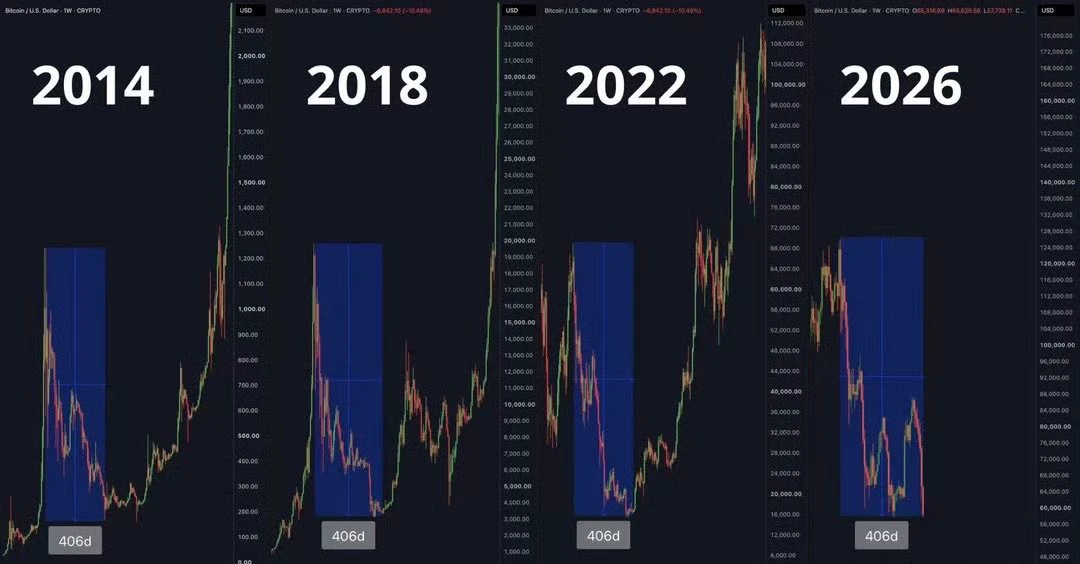
Saw a take that this might be the last week of Bitcoin’s bear market:
2014 bear market: 58 weeks, 406 days
2018 bear market: 58 weeks, 406 days
2022 bear market: 58 weeks, 406 days
2026 bear market: 58 weeks, 406 days
Those trying to apply past cycles to this one have carved a hole right through the boat.
With price action this fucking bad, people are still saying it’s the last week of the bear market? Even the Rainbow Chart has stopped working.
post-image
BTC-0.67%
$IDOL Long entry price: 0.02919 Stop-loss: 0.02780 Take-profit 1: 0.03074 Take-profit 2: 0.03200 Take-profit 3: 0.03350
post-image
IDOL-6.71%
Trenches
FIONA
F
bade
b
FIONA
B34n...pump
Market Cap
$.
Change
.
24h Vol
$.
Holders
.
PIEVERSE
P
bade
b
PIEVERSE
0x0e...25a9
Market Cap
$.
Change
.
24h Vol
$.
Holders
.
IDOL
I
bade
b
IDOL
0x3b...ab07
Market Cap
$.
Change
.
24h Vol
$.
Holders
.
Singularity
S
bade
b
Singularity
7R4M...pump
Market Cap
$.
Change
.
24h Vol
$.
Holders
.
CLAUDIA
C
bade
b
CLAUDIA
2j5S...W2ZM
Market Cap
$.
Change
.
24h Vol
$.
Holders
.
#BTCBreaksBelow60K
Bitcoin $BTC Breaks Below $60,000 Is a Weekend Rebound Coming, or Is More Downside Ahead?

Bitcoin is facing another important test as selling pressure pushes the market into a more uncertain phase. On November 20, BTC briefly dropped below the psychologically significant $60,000 level reaching its lowest price since July, according to the figures shared in the market update. This move has caught traders' attention because $60,000 had become a major level that many investors were watching as potential support. Now that BTC has slipped below it, the biggest question is whe
post-image
BTC-0.67%
  • 4
Luckily, the trend-trade setup made up for it a bit.
ETH in the 15xx range
I got into the T trade a bit too early last night and took a loss!
There are signs of a bottom forming. If it can stabilize, then make one more second test to complete wave C, the consolidation should finally end and the market can start heading steadily north. Of course, this consolidation won't be brief and will be grueling too—it all depends on whether you can hold on! It’ll take at least 25 weeks...
post-image
ETH-1.26%
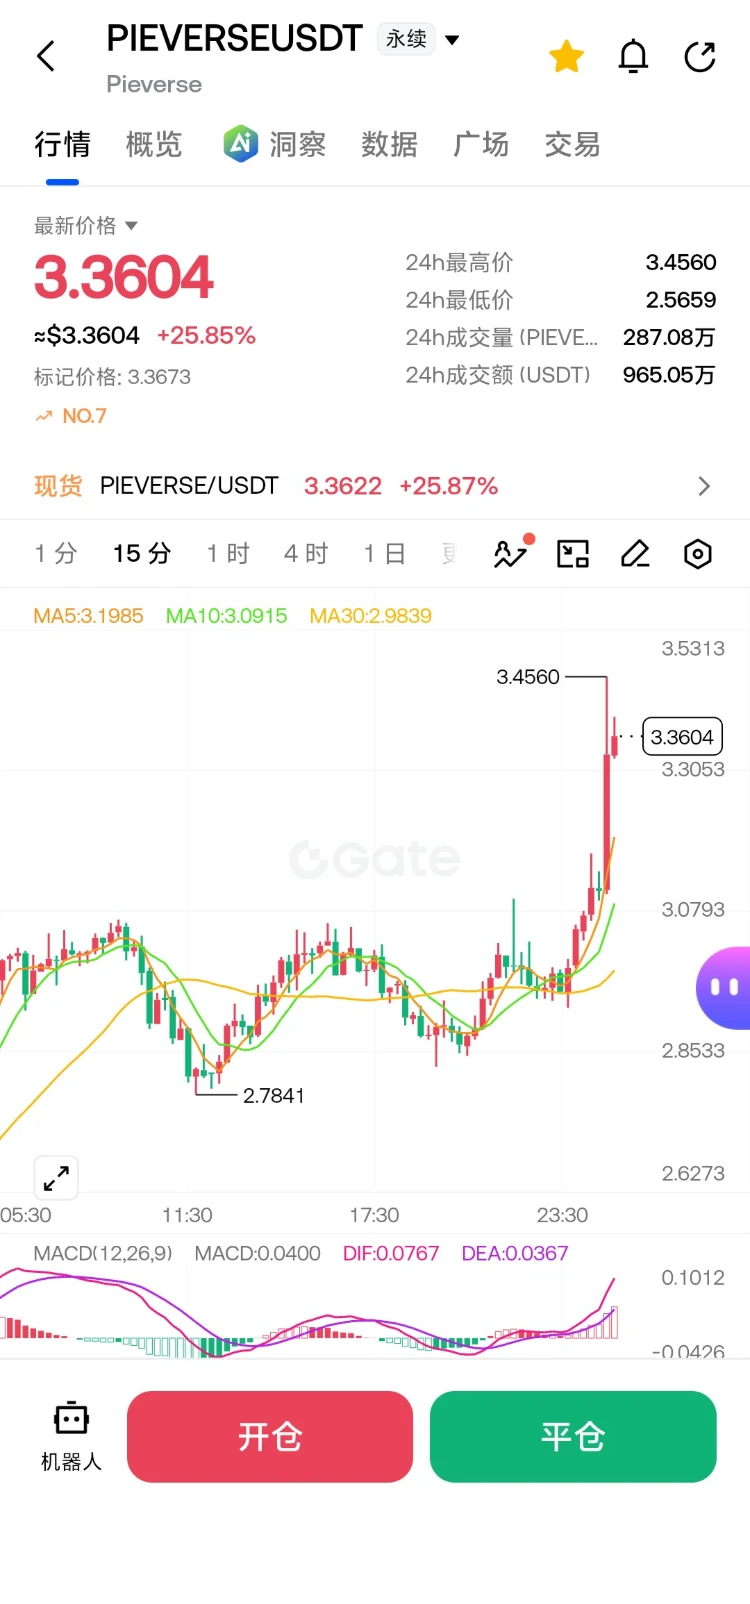
🚀 $PIEVERSE Bullish strategy – bulls regain momentum after the pullback… Long entry: 3.300 – 3.350 Take-profit 1: 3.400 Take-profit 2: 3.500 Final take-profit 3: 4.000 Stop-loss: 2.90 Leverage: 10x – 20x Margin: 1% – 3% Risk warning: If take-profit 1 is reached, take partial profits and move the stop-loss to the entry price to protect your principal. Trade here on $PIEVERSE … 👇
post-image
PIEVERSE+0.58%
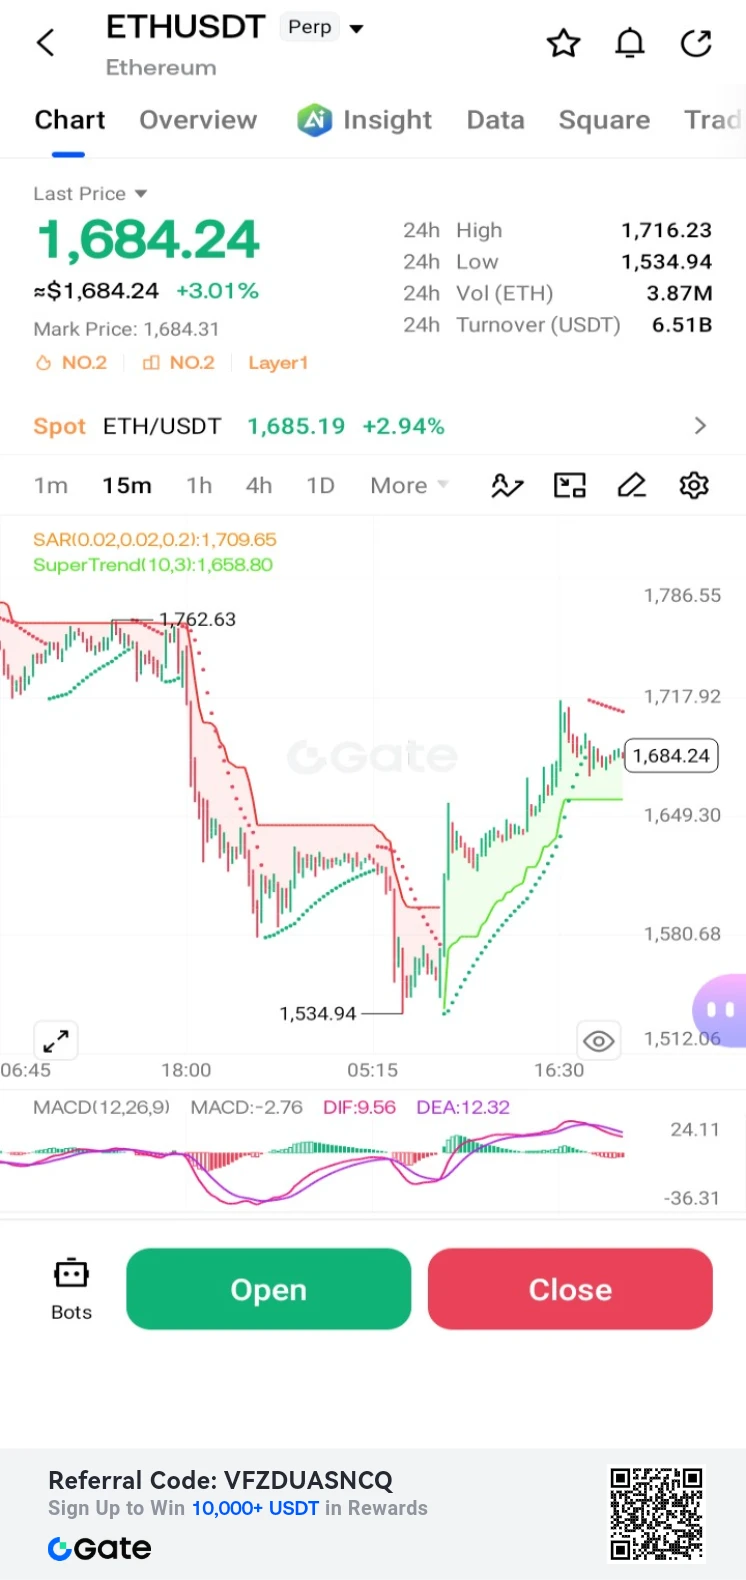
$ETH /USDT Perp – "Oversold Bounce – Long"**
Trading Plan Long $ETH
Entry: 1,684.24
SL: 1,658.80
TP1: 1,717.92
TP2: 1,762.63
ETH is up +3.01% after bouncing from the 1,534.94 low. MACD is crossing bullish; targeting the 1,717.92 EMA resistance.
post-image
ETH-1.23%
crypto market update anylsis overall
live-cover
LIVE2,644
BTC-0.67%
SOL-0.77%
ETH-1.26%
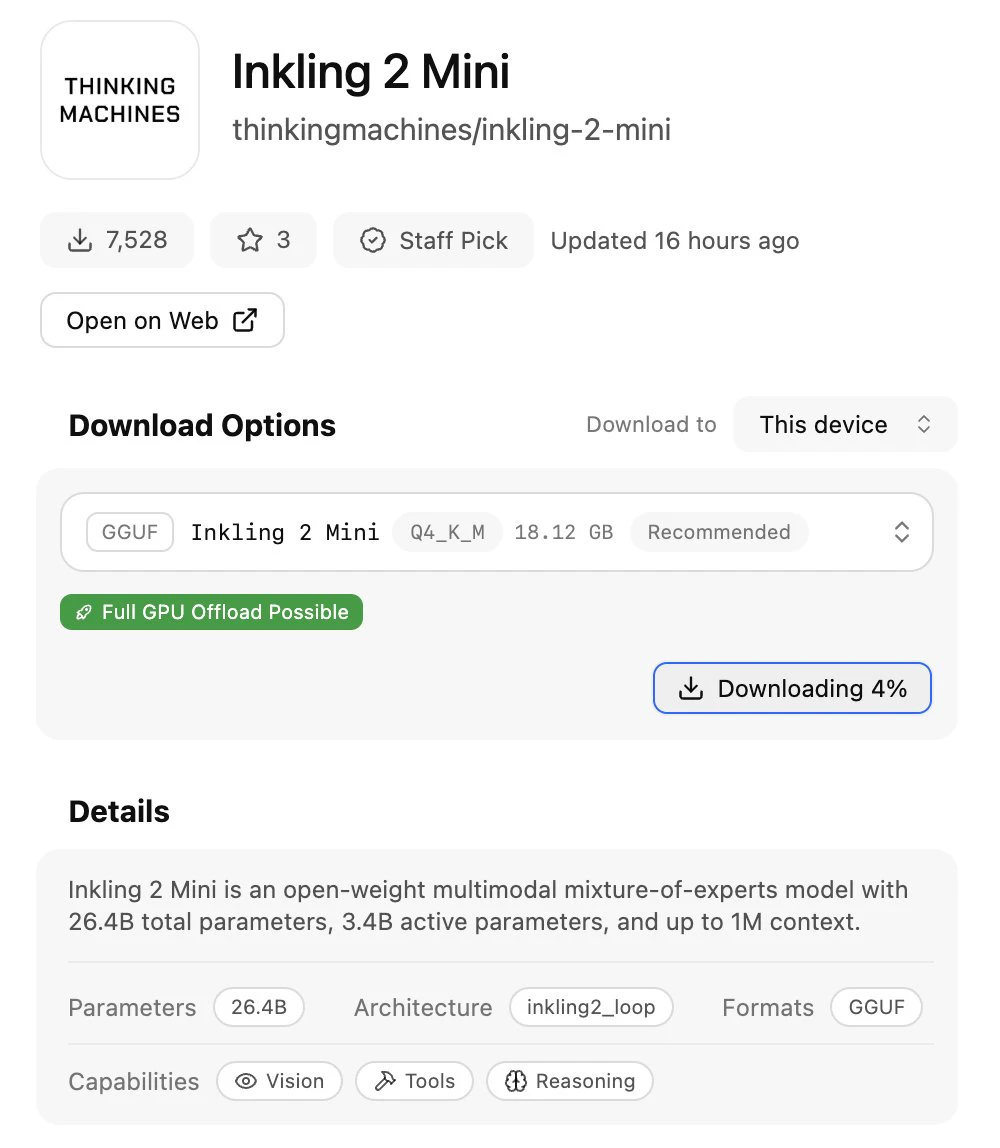
shorted anthropic stock + downloading this
ready for war
post-image
ANT-8.68%
#BTCETFOutflowsExtendTo3Days

Bitcoin ETF outflows have now extended into a third consecutive day, adding another layer of pressure to an already cautious crypto market. Three straight sessions of net outflows can become an important sentiment signal because it suggests that some investors are reducing exposure to Bitcoin through regulated exchange-traded products.

The development is especially important because spot Bitcoin ETFs have become a major channel for institutional and traditional-market participation. When these products experience sustained outflows, traders naturally start watchi
post-image
BTC-5.94%
EVAA | Long 🟢 | Bullish | 15m 24h: +12.52% | Volume: 343.7M USDT
Long rationale: Price is above EMA200; EMA20/50/200 are in bullish alignment; RSI14 is 52.0; MACD histogram is positive; ADX14 is 21.0; volume is 0.65x the 20-candle average; trend pullback/continuation.
Entry: 6.2512
Stop loss: 6.01341
Take-profit 1: 6.54844 | Take-profit 2: 6.72678 | Take-profit 3: 6.96457
Entry price is for reference only; do not chase the price. The trading strategy is invalidated if the stop-loss price is hit. Technical analysis only. Not investment advice. $EVAA
post-image
EVAA-0.49%
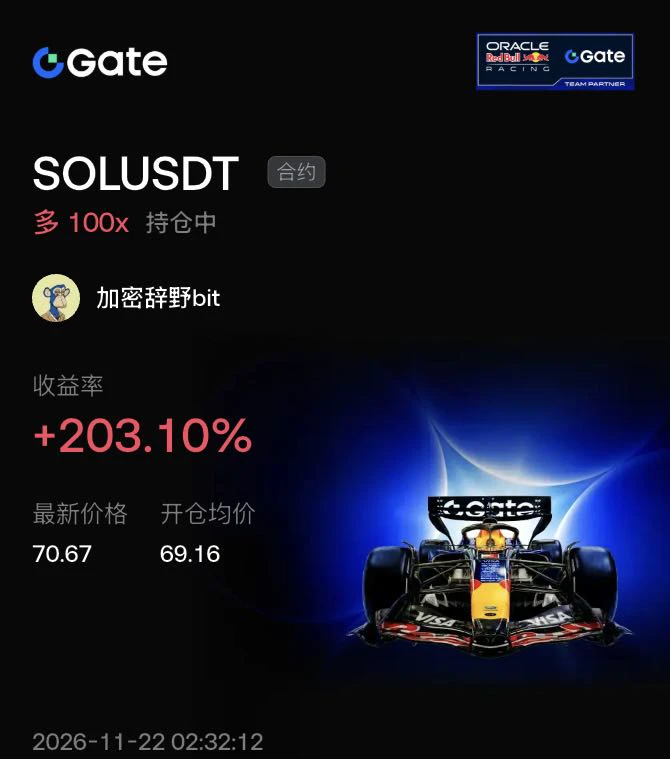
$SOL When trading, you must clearly understand the difference between higher and lower timeframes. The current rally in major coins after this sharp crash is basically just a brief recovery, so don’t mistake it for a reversal.

Look at this 1-hour chart: SOL plunged from 75 to 64.8—a brutal drop. After stabilizing at the bottom, it made a V-shaped rebound. I entered at 69, the right-side confirmation point, and went long with 100x leverage. I caught the profits from this sentiment-driven recovery, which pushed straight up to 70.67, netting 203%!

Why emphasize “brief recovery”? Because there’s
post-image
SOL-0.77%
BTC-0.65%
ETH-1.23%
  • 1
🇺🇸 The U.S. Federal Reserve is expected to inject up to $3.51 billion into the financial system next week. More liquidity could provide fresh momentum for: $BTC $ETH $SOL
post-image
BTC-0.67%
SOL-0.77%
Sure enough, it's skyrocketing📈; weekends belong to the altcoins, and that hunch was spot on
post-image
  • 2
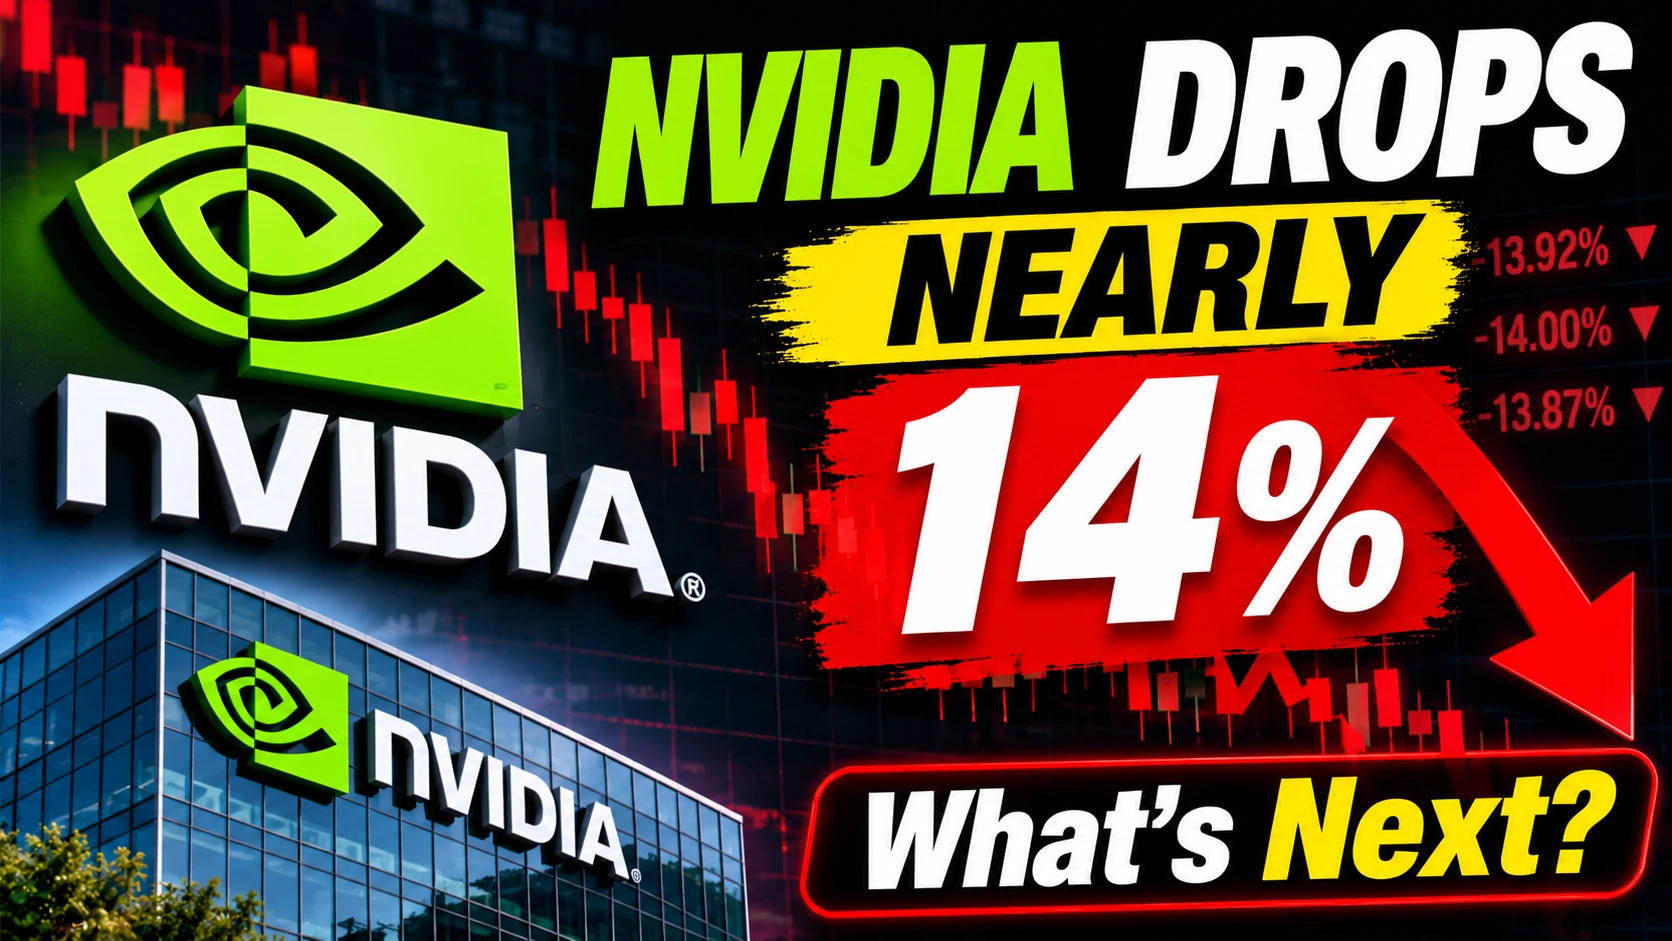
#NvidiaDropsNearly14Percent

Nvidia is facing a major market sell-off, with the stock dropping nearly 14% in a sharp move that has put investors on high alert. A decline of this magnitude can quickly change market sentiment, especially for one of the world’s most closely watched AI and semiconductor companies.

The move highlights how sensitive Nvidia has become to expectations surrounding artificial intelligence, chip demand, earnings growth, valuations, and future investment. After years of extraordinary enthusiasm around AI-related companies, investors are increasingly focused on whether gr
post-image
NVDA-13.84%
[New Streamer] Market Prediction
live-cover
LIVE2,408
BTC-0.67%
🔥 Share every day and claim rewards daily!
Post with trending topics to claim a red packet worth up to 10 USDT!

🎁 Event Rewards
1️⃣ Posting red packet: New users are guaranteed to receive one, with a random reward of 0.01–10 USDT!
2️⃣ Weekly leaderboard rewards: Win up to 100 USDT for high-quality content!

📢 Today's Hot Topic | Results are out for the third Gate Direct IPO ANT allocation!
Results are out for the third Gate Direct IPO ANT allocation, with a total of 92,100 $ANT shares allocated! Did you successfully receive an allocation this time? Are you satisfied with the results? Come
post-image
ANT+0.00%
The futures market is clearly heating up, with $IDOL surging ahead with a gain of +52.09%, $SKYAI close behind with a +32.25% rise, and $PIEVERSE steadily posting +22.71%. Overall market sentiment is strong, and capital is searching everywhere for a breakout opportunity—who will be the next asset to take the baton in this wave? Risk warning: Futures leverage magnifies both gains and losses, so be sure to manage your position size when chasing highs. (The above content represents personal opinions only and does not constitute investment advice. Please view market risks rationally.)
post-image
IDOL-6.71%
SKYAI-7.58%
PIEVERSE+0.58%
#CookBacksFurtherRateHikes #ShareWeekly

The Fed’s Next Move Could Change the Market Direction: Why Lisa Cook’s Hawkish Warning Matters

The Federal Reserve is entering another difficult phase of monetary policy, and Governor Lisa Cook’s November 20 remarks have added fresh uncertainty to an already fragile financial market. Her message was clear: the current interest rate range of 3.75%–4.00% may not be sufficiently restrictive to bring inflation back to the Fed’s 2% target. In her view, delaying further action could create an even bigger economic problem and force more aggressive tightening
post-image
BTC-0.67%
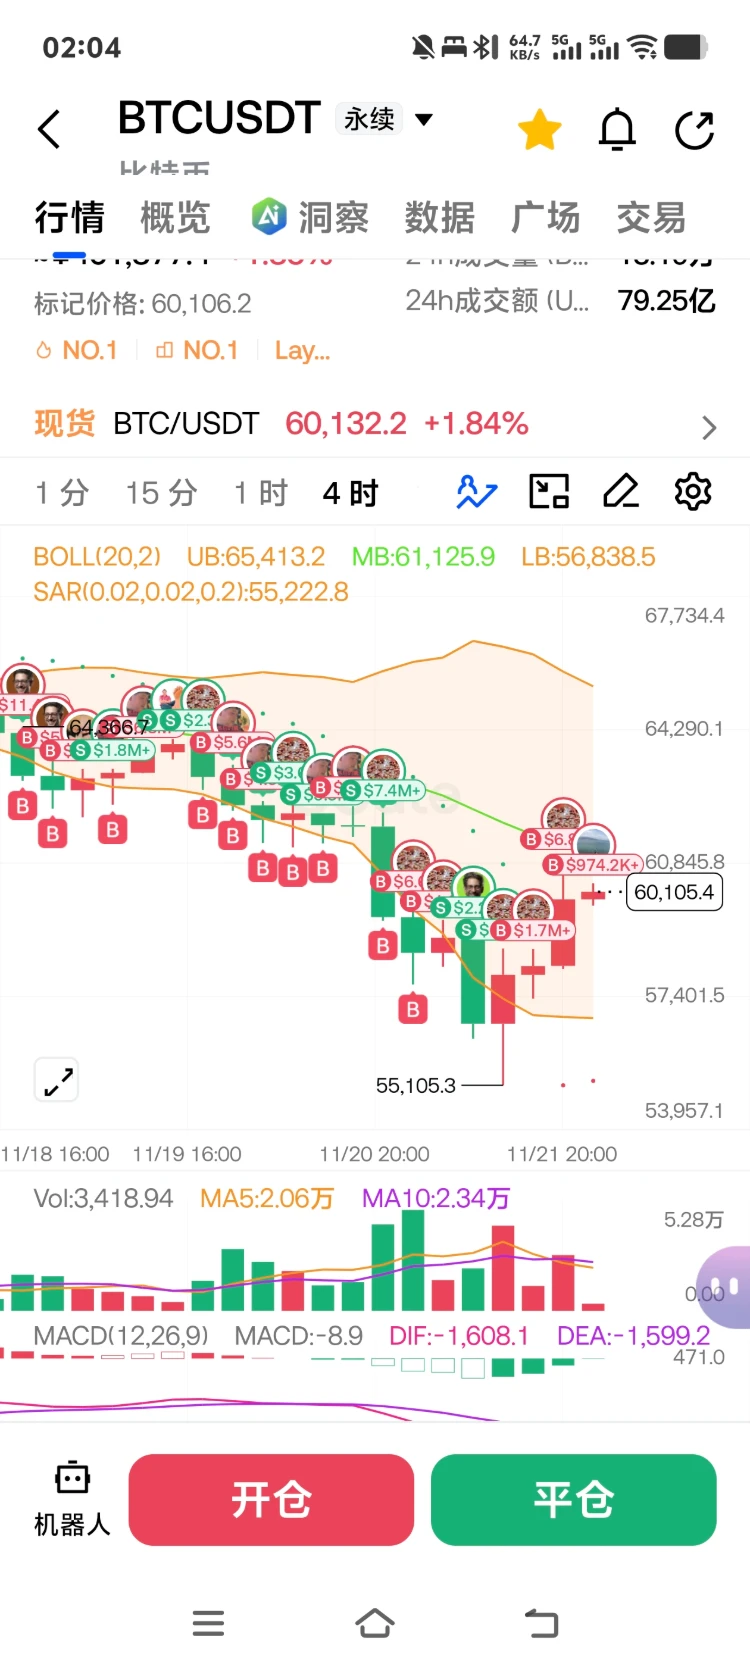
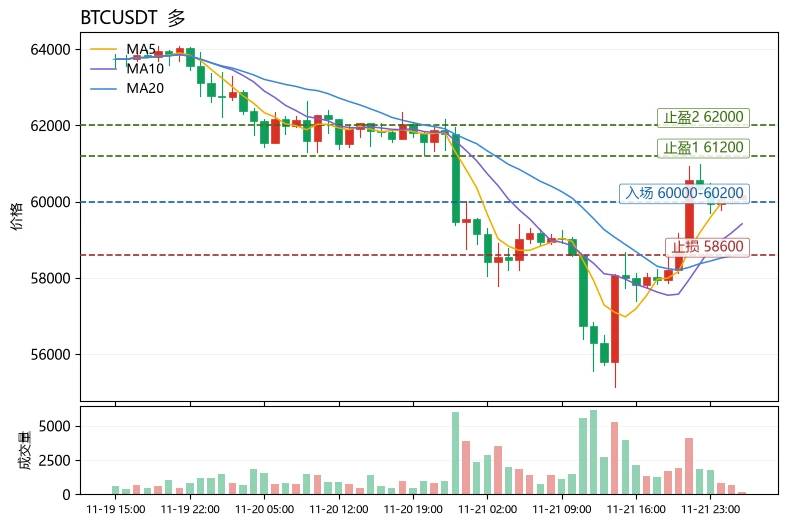
$BTC Bottom line: Short-term outlook is bullish, but only buy on pullbacks—don’t chase highs. The moving averages remain in a bullish alignment (MA5=60121.2 above MA20=58625.5), and the MACD histogram at +387 remains positive, so the trend is intact. However, RSI at 57.1 is merely neutral-to-strong, not overbought, while the upper Bollinger Band at 61266.7 is immediate resistance. With the current price of 60190 leaving limited room to the upper band, chasing longs offers an unfavorable risk-reward ratio.
Structurally, the price is trading between the middle and upper Bollinger Bands, placing
post-image
ZEC+1.16%
GRAM-0.97%
$ETH Make money from swings and protect yourself against major risks—that’s how seasoned traders survive.

Yesterday, I said the first support level to watch was 1500. Although Ethereum bottomed and rebounded near 1534, the broader trend has not fully reversed. The current rebound is just a technical recovery after the sharp drop.

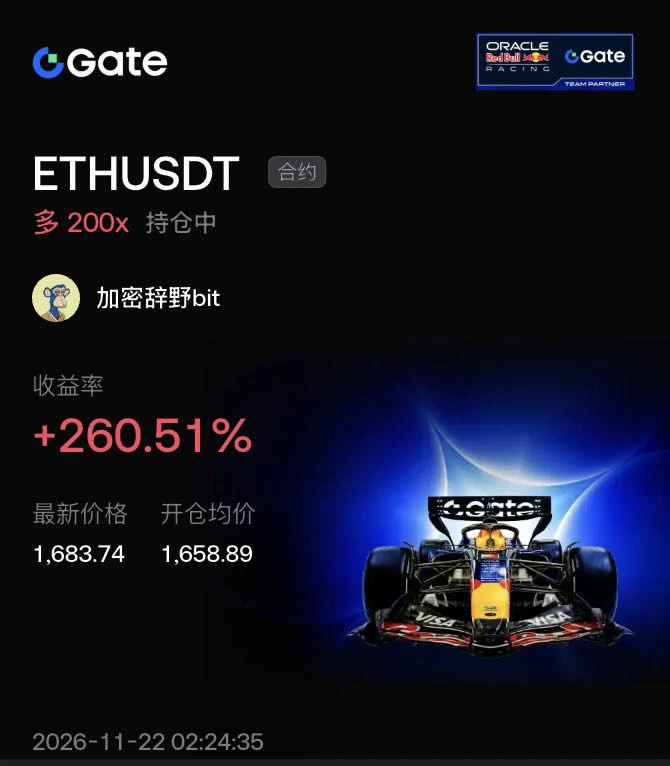
After confirming strong support near 1530, I decisively re-entered a long position at 1658.89 with a right-side entry, going straight to 200x leverage. This rebound climbed to around 1683, earning a solid 260% profit. But remember, short-term long positions earn qui
post-image
ETH-1.26%
BTC-0.65%
  • 1
Load More

Join 40 M users in our growing community

⚡️ Join 40 M users in the crypto craze discussion

💬 Engage with your favorite top creators

👍 See what interests you

Trending Topics

BTCBreaksBelow60K

2.1M Views29.9K Discussing

BTC fell below $60,000 on November 20 for the first time since July, alongside a tech stock selloff and broader pressure on risk assets. Will $60K become resistance, or can BTC quickly reclaim it? What price or volume signals would convince you that selling pressure is easing?

GateDirectIPOPhase3ANTAllocates92100Shares

782.8K Views4.9K Discussing

NvidiaDropsNearly14Percent

328K Views7.6K Discussing

View More