Square
Following
Hot
News
Notifications
Profile
Share your thoughts
placeholder
Article
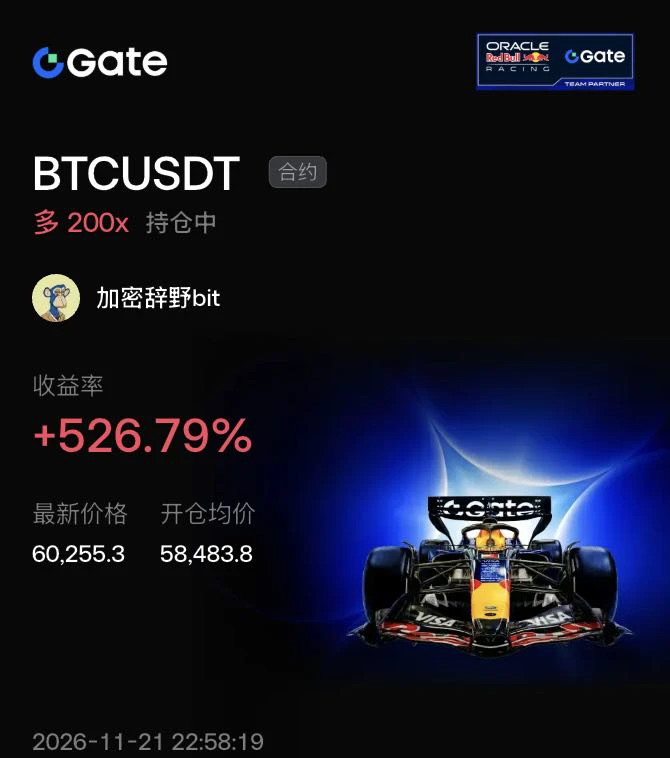
$BTC When everyone online was shouting, “Bitcoin is headed for 40k,” I quietly entered around 55,000.

During a sharp drop, retail traders are always the most panicked, cutting their losses at the bottom. But I knew that a crash of this magnitude in Bitcoin, falling to an important psychological and technical support level like 55,000, would inevitably trigger a strong rebound.

Seeing a high-volume wick form at the bottom, I entered on the right side of the move and opened a 200x long at 58483.8. This deep V-shaped reversal happened so fast there was no time to hesitate—it shot straight above
post-image
BTC-0.67%
ETH-1.23%
  • 1
  • 1
$BTC Fell below $58,000, then recovered to $60,000! That wick bottomed at $55,130. I’m starting to think the area around $55,000 could become this cycle’s bottom! One reason is that this pullback tested the four-year moving average. Now it comes down to whether buyers are willing to step in at higher levels! I’m watching the four-year moving average because during this cycle, buyers stepped in near this line during several sharp BTC pullbacks. This time, the price briefly fell below the average intraday, then rebounded from $55,130 to $60,530, up nearly 10% from the low. This rebound makes me
post-image
ZEC+1.16%
Trenches
FIONA
F
bade
b
FIONA
B34n...pump
Market Cap
$.
Change
.
24h Vol
$.
Holders
.
IDOL
I
bade
b
IDOL
0x3b...ab07
Market Cap
$.
Change
.
24h Vol
$.
Holders
.
PIEVERSE
P
bade
b
PIEVERSE
0x0e...25a9
Market Cap
$.
Change
.
24h Vol
$
Holders
.
CLAUDIA
C
bade
b
CLAUDIA
2j5S...W2ZM
Market Cap
$.
Change
.
24h Vol
$.
Holders
.
mihao
m
bade
b
mihao
4Cxj...pump
Market Cap
$.
Change
.
24h Vol
$.
Holders
.
Whale Adds $10.2 Million in Long Silver Positions, Becoming the Largest On-Chain Silver Bull
live-cover
LIVE5,371
BTC-0.67%
ETH-1.26%
NVDAG-0.24%
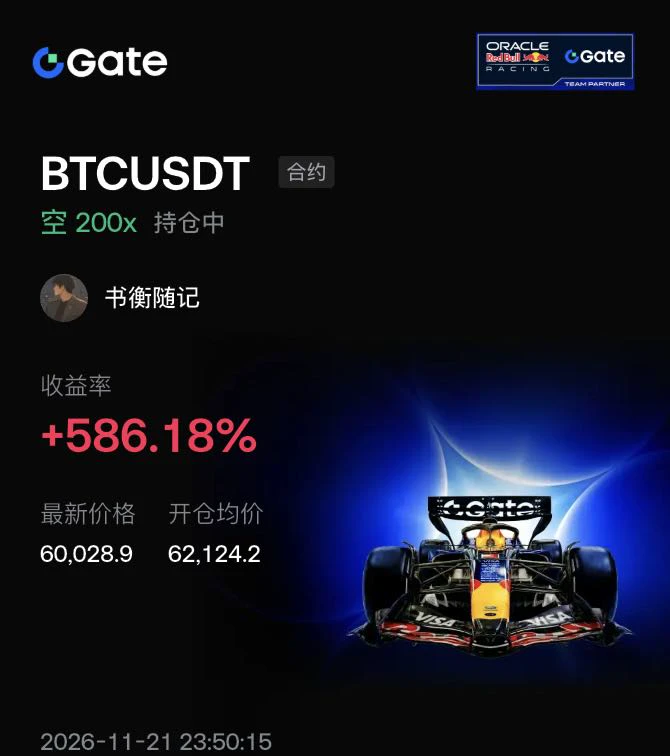
$BTC It has rebounded to around 60000, so why am I still holding a short position?

The short position I opened around 62124 is currently up nearly 6x. I chose to go short mainly based on the 4-hour structure. The price repeatedly failed to rebound, with each high lower than the last, while the short-term moving averages remained capped by the medium-term moving averages above, indicating that bears had consistently been in control.

BTC later fell below 62000, and the move clearly accelerated, reaching a low near 55105. This decline largely matched my expectations.

The price has now rebounde
post-image
BTC-0.65%
ETH-1.23%
SOL-0.74%
  • 1
Time to make less painful charts in life
#bitcoin
BTC-0.67%
Abraxas Capital appears to have bought the $BTC dip today, buying 10,356 $BTC ($607M) at an average price of $58,651.
BTC-0.67%
  • 1
[FlameseN] Fractal Algorithm V7 is LIVE
The biggest update yet. Part 1 & Part 2 are now ONE Algorithm.
Every setup is now graded A+ → E, using a 2-Step, 10-Check System as it builds, with its full trade plan on the chart.
Backtested on up to 17 years of 1-minute data across NQ, ES, Gold, Silver, Euro & Pound.
Setup Grading & Trade Plan:
→ 2-Step 10-Point Grades A+ → E
→ Live Grade Table: ✓ / ✗ / still to come
→ Auto Bias 1 & 2
→ Entry: First Close, CISD or iFVG
→ TP1–TP3 targets
→ Break Even: Normal / Aggressive / Chill Out
→ Min Grade filter
FVGs:
→ iFVG inside setups
→ Pending FVG preview
→
XAU+0.38%
XAG+0.47%
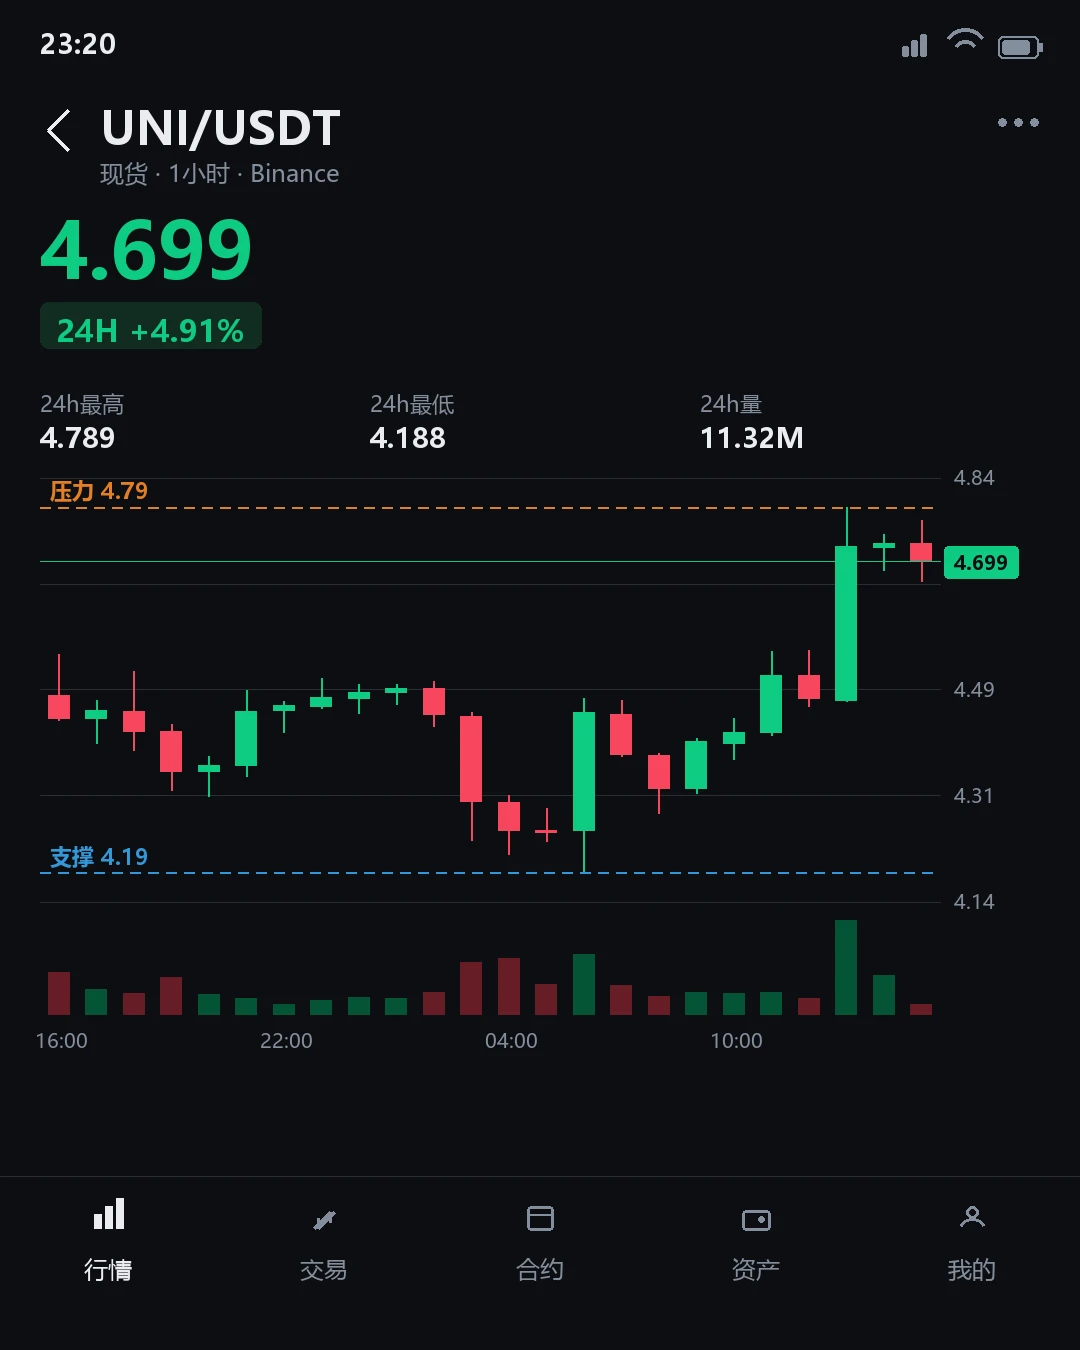
$UNI : Finding opportunities through timeframe confluence, with levels and exit lines here
When I looked at $UNI this chart again, I first covered up the 24-hour +3.36%. It’s too easy to steal your attention. What really needs explaining right now is that $UNI moved first on the 1-hour chart, but the 4-hour chart hasn’t acknowledged it yet. I’d treat the short timeframe as a prompt, not jump straight to a conclusion; without the larger timeframe confirming, the direction can still swing back and forth.
My view is that I’d rather see this as a direction that hasn’t been confirmed yet than rush
post-image
UNI+3.05%
Why does this candle look like it's about to bounce, only to just drift sideways? Watching $FET struggle to find support after a steep drop is painful. We all bet it would mean-revert cleanly, but the market always likes to keep us guessing.
Other coins: $VVV : Current price 23.352 - 24-hour change: +18.66%$SOL : Current price 70.36 - 24-hour change: +2.36%
post-image
FET-1.52%
VVV+0.37%
SOL-0.77%
#ETH #WCTCS9
ETH Market Analysis: Why the Sell-Off Happened, Key Levels, and the US Jobs Data That Matters for December

Ethereum is trading near $1,625 on Gate spot. The 24-hour range runs from $1,581 to $1,771. The 7-day change is about -15.9%. Yesterday's daily candle closed at $1,623.15 after opening at $1,757.51, so the day was a clean rejection from the upper range. Today's candle is still open and printing near the same level. I want to walk through what is driving this, what the derivatives data says, the levels I am watching, and what would have to change before I call a trend revers
Whale adds 10.2 million in long sliver position
live-cover
LIVE1,657
BTC-0.67%
SOL-0.77%
ETH-1.26%
XRP-1.15%
USDC+0.01%
#GoldNears3500 #ShareWeekly
Gold stands at a pivotal psychological and technical juncture near the $3,500 per ounce level as of late November 2026, with the spot price hovering in the $3,530 to $3,540 range after a sharp multi-week decline. This area has become the focal point of intense market discussion, as the metal has already shed roughly 8.9 percent over the past week and approximately 12 percent over the past month, while sitting nearly 19 percent lower year-to-date and more than 34 percent below its all-time closing high near $5,405 recorded in late January 2026. The question dominati
  • 1
BTC is at $60,300 now, just back above $60,000.
The account long/short ratio is still around 2.5, with significantly more retail accounts going long.
There are more retail accounts, but their capital is smaller than that of the shorts.
I’ll be watching to see whether BTC can hold around $60,000 and whether volume comes in to support the rebound.
If it quickly falls back below that level, crowded longs should watch out for liquidation risk; if it holds and continues moving higher, short covering could also fuel another leg up.
With volume shrinking this much this Sunday, it’s best to stay cauti
BTC-0.65%
#GateDirectIPOPhase3ANTAllocates92100Shares
Gate Direct IPO Phase 3: Anthropic (ANT) Allocates 92,100 Shares — Strong Demand Highlights Growing Interest in AI Investments

Gate.io has officially confirmed the allocation results for Phase 3 of its Direct IPO Access program featuring Anthropic (ANT), marking another important milestone in connecting cryptocurrency investors with opportunities in the traditional stock market.

A total of 92,100 ANT shares have been allocated, with overall subscription demand reaching approximately 152 million USDT. The final allocation represents a total value o
post-image
ANT-8.68%
$ETH The current market structure is outlined as follows:

【Lower Defense Zone】- Short-term buffer zone: 1,580 - 1,600 USDT, the core area where buyers and sellers have repeatedly battled recently, with prices finding support there multiple times- Key defense: the 1,500 USDT round-number level, which is both psychological support and an area of concentrated structural demand; a break below it would indicate a marked weakening in market sentiment- Last-resort support: 1,536.59 USDT, corresponding to a previous low on the chart and serving as a reference for the final short-term line of defense
post-image
ETH-1.26%
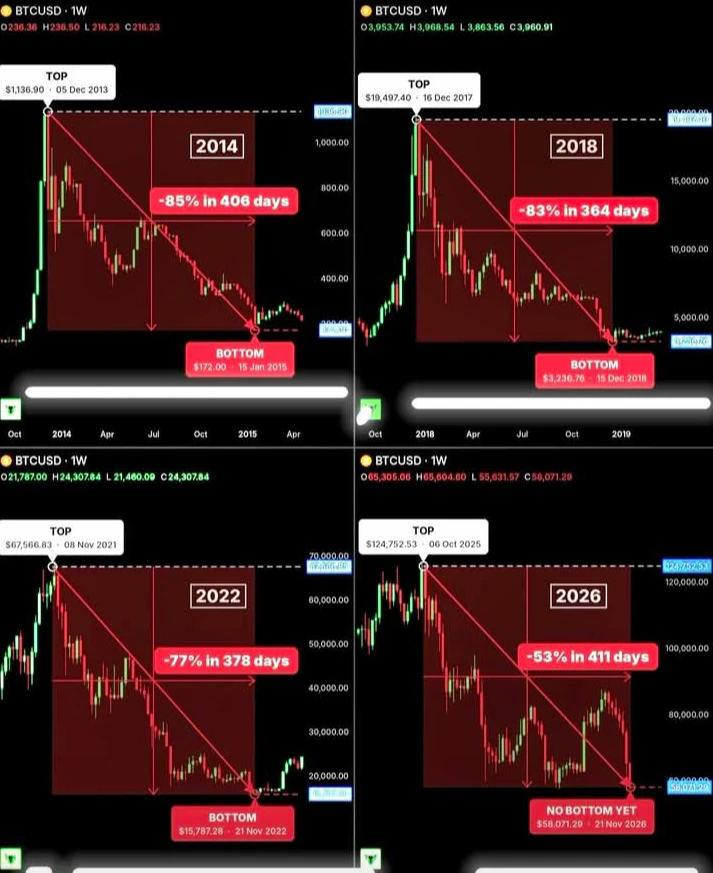
BITCOIN IS NOW IN THE LONGEST BEAR MARKET IN ITS HISTORY...

Every past bear market ended within 13 months of the top:

• 2014: -85% in 406 days 📈
• 2018: -83% in 364 days 📈
• 2022: -77% in 378 days 📈

Today, Bitcoin is on day 411, down 53% from its $124,753 peak.

That's already longer than every bear market before it.

If history repeats, the bottom could be very close.

#crypto #altcoins #ethereum #solana
post-image
BTC-0.67%
ETH-1.26%
SOL-0.77%
Trading fee discounts. Up to 50%. Every dollar saved is a dollar earned
  • 2
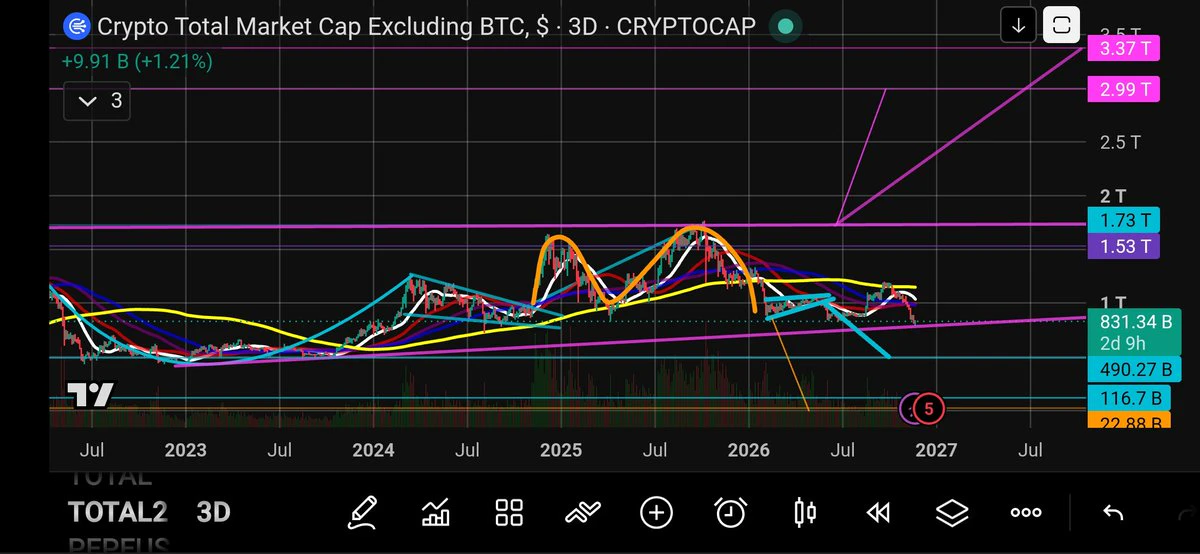
$TOTAL 2 Marketcap EXCLUDING $BTC 🚨
3D Chart Analysis 🔎
The bulls have been able to defend this area 4 times already. Will they be able to do it a 5th time?
The pink converging trendlines appear to be forming a very large ascending triangle. This is a handle to a very large cup and handle pattern.
The bulls will want to defend this zone of $832B-$722B or risk collapse to $490B.
A potential rebound to the upside is looking quite possible.
If the top pink trendline of the ascending triangle is broken to the upside at $1.75T. Then the targets of $2.99T and $3.37T will be activated.
Yes we are
post-image
BTC-0.67%
ETH-1.26%
SOL-0.77%
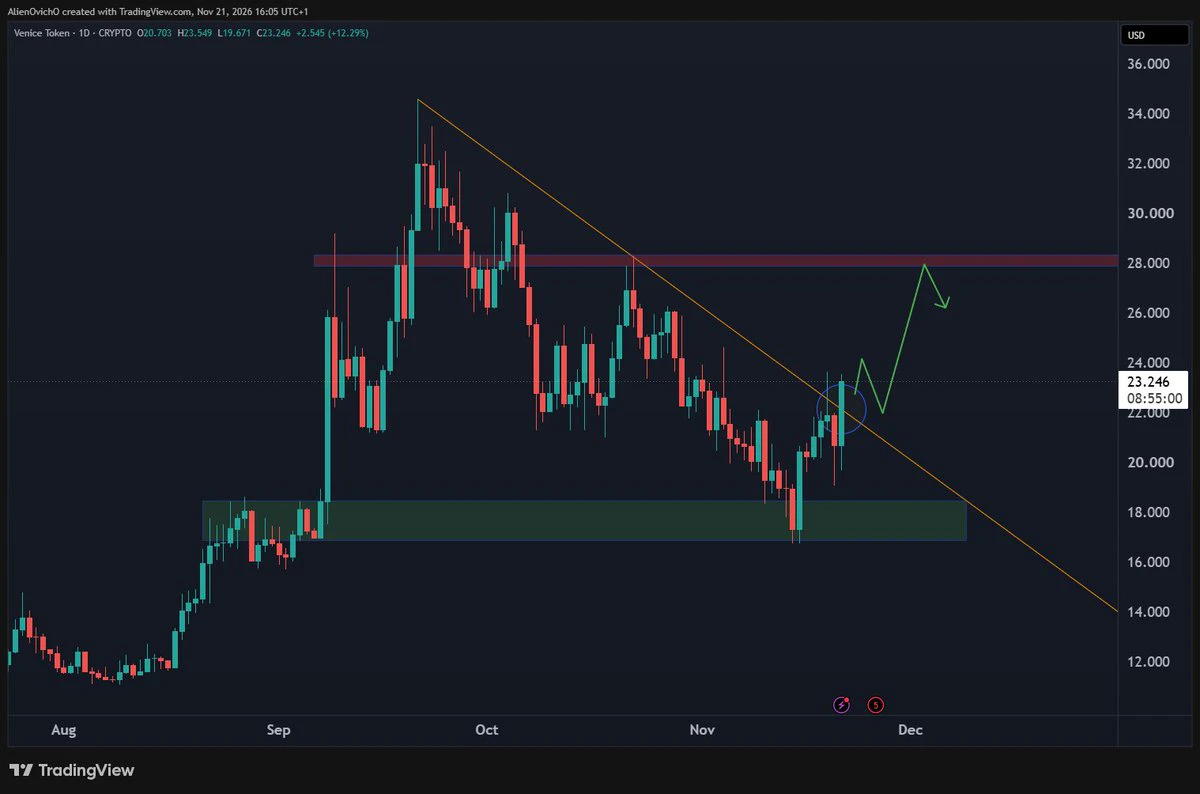
base:0xacfe6019ed1a7dc6f7b508c02d1b04ec88cc21bf is pushing against the descending trendline 📈
A daily close above 22$ confirms the daily reversal in progress and could take price back toward the 28 area.
post-image
TAKE-0.39%
Load More

Join 40 M users in our growing community

⚡️ Join 40 M users in the crypto craze discussion

💬 Engage with your favorite top creators

👍 See what interests you

Trending Topics

BTCBreaksBelow60K

2.1M Views29.8K Discussing

BTC fell below $60,000 on November 20 for the first time since July, alongside a tech stock selloff and broader pressure on risk assets. Will $60K become resistance, or can BTC quickly reclaim it? What price or volume signals would convince you that selling pressure is easing?

GateDirectIPOPhase3ANTAllocates92100Shares

775.2K Views4.9K Discussing

NvidiaDropsNearly14Percent

325.2K Views7.5K Discussing

View More