Square
Following
Hot
News
Notifications
Profile
Share your thoughts
placeholder
Article
JUST IN: 🇮🇷 🇺🇸 Iran says it will reopen the Strait of Hormuz if President Trump agrees to make a deal.
Short-term view on $BTC and U.S. stocks: Bitcoin’s realized price is at $53,000, and the long-term holder cost basis is $48,000. This crash took it from $87,000 to $55,000, a drop of $32,000 already. Even if it falls another $10,000, averaging down means you still wouldn’t be at a loss if it rebounds to $60,000. Bitcoin’s 3-day and 5-day moving averages and weekly KDJ are all already negative, so a rebound could happen at any moment. Wait for a Fibonacci retracement bounce before considering shorting. Given the current market, BTC is only one wave away from completing its seven-wave pattern o
post-image
BTC-0.67%
NAS100-0.07%
Trenches
IDOL
I
bade
b
IDOL
0x3b...ab07
Market Cap
$.
Change
.
24h Vol
$.
Holders
.
PIEVERSE
P
bade
b
PIEVERSE
0x0e...25a9
Market Cap
$.
Change
.
24h Vol
$.
Holders
.
FIONA
F
bade
b
FIONA
B34n...pump
Market Cap
$.
Change
.
24h Vol
$.
Holders
.
Singularity
S
bade
b
Singularity
7R4M...pump
Market Cap
$.
Change
.
24h Vol
$.
Holders
.
CLAUDIA
C
bade
b
CLAUDIA
2j5S...W2ZM
Market Cap
$.
Change
.
24h Vol
$.
Holders
.
VVV | Long 🟢 | Bullish | 15-minute, 24-hour: +19.37% | Volume: 78.6M USDT. Long rationale: Price is above EMA200; EMA20/50/200 are in bullish alignment; RSI14 is 71.8; MACD histogram is positive; ADX14 is 39.2; volume is 0.97 times the 20-candle average; trend pullback/continuation. Entry: 24.822 Stop-loss: 23.734 Take-profit 1: 26.1819 | Take-profit 2: 26.9979 | Take-profit 3: 28.0859. Entry levels are for reference only; do not chase prices. The strategy is invalidated if the stop-loss level is hit. This is a technical analysis strategy only and does not constitute financial advice. $VVV
post-image
VVV+0.37%
  • 1
Okay, $SKHYNIX , we understand—the resistance level is hard to break through today. You’ve worked hard enough, and it’s time to catch your breath. Let’s see whether you have the strength to keep going or whether it’s time to call it a day. TP: 734.06SL: 796.72Other coins: $ZEC : Current price 786.23 - 24-hour change: +6.28%$PIEVERSE : Current price 3.4076 - 24-hour change: +14.87%
post-image
SKHYNIX+1.41%
ZEC+1.16%
PIEVERSE+0.58%
#黄金逼近3500美元关口
Gold at $3,538: The $3,500 Support Battle Could Decide the Next Major Move

Gold is approaching a critical turning point after an aggressive selloff pushed prices toward $3,500. The latest available spot-market quote stands near $3,537.90 per ounce, following a session decline of approximately 2.38%. The metal traded as low as $3,502, bringing the market dangerously close to breaking an important psychological threshold.

What makes this decline particularly significant is that gold is experiencing selling pressure despite broader financial market uncertainty. This reflects a ma
XAU+0.38%
  • 1
  • 1
Gm everyone ☀️
Are we back?
post-image
  • 1
Watching $BARD hold these moving averages so calmly, honestly, I'm getting a little impatient. It clearly has strong momentum, so why does it feel like it's just pacing in place instead of actually speeding up? Is everyone waiting for a specific signal, or are we just admiring the view here? TP: 0.100SL: 0.092
Market dynamics:
$VVV : Current price 25.152 - 24-hour gain: +20.49%
$ETH : Current price 1,682.61 - 24-hour gain: +3.96%
post-image
BARD-1.24%
VVV+0.37%
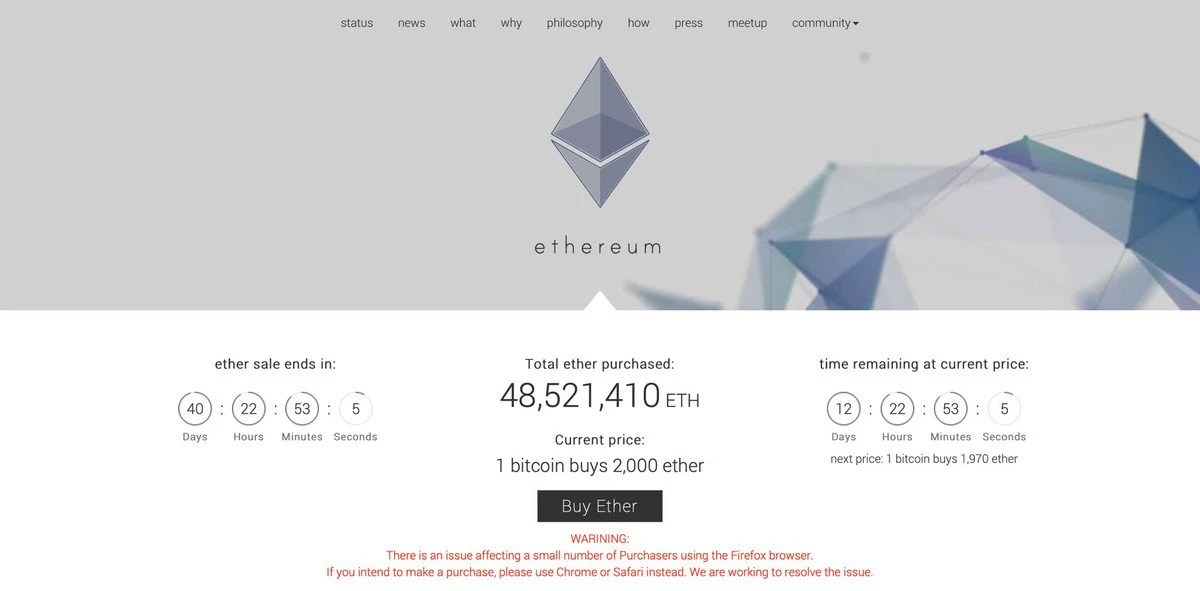
POV:
It’s 2014.
Ethereum is holding its ICO at $0.31 per ETH.
You can purchase up to 2,000 ETH.
post-image
ETH-1.26%
Open a short position on $SUI . Trade setup: Entry 0.6459 - 0.6491, targets 0.6160 and 0.591, stop loss 0.6686. SUI failed to reclaim local moving-average resistance; price is expected to quickly move lower and retest support below. Note: A strong 1-hour rebound trend could invalidate this short if price reclaims 0.6500. Don't go all in, bro. Position size should suit your own account.
post-image
SUI-1.05%
$CRCLB The one-hour RSI is nearing 70, signaling relative strength, while the four-hour RSI has fallen to 24.73, deeply oversold. The two timeframes give completely opposite signals. It’s up 1.49% over 24 hours, but the volume ratio is only 0.11—a clear low-volume rebound. I won’t chase shorts. At the current price of 49.07, closing shorts here would just mean selling at the lows to those taking the other side. The rebound target is set at the one-hour resistance level of 49.88, with a stop-loss at the intraday low of 45.23; if it breaks below that, I’ll admit defeat. An oversold rebound on l
post-image
3372.56@开户以来, that's a huge loss
Btc market prediction update
live-cover
LIVE524
BTC-0.67%
ETH-1.26%
SOL-0.77%
XRP-1.15%
BTC stremer
live-cover
LIVE252
BTC-0.67%
ETH-1.26%
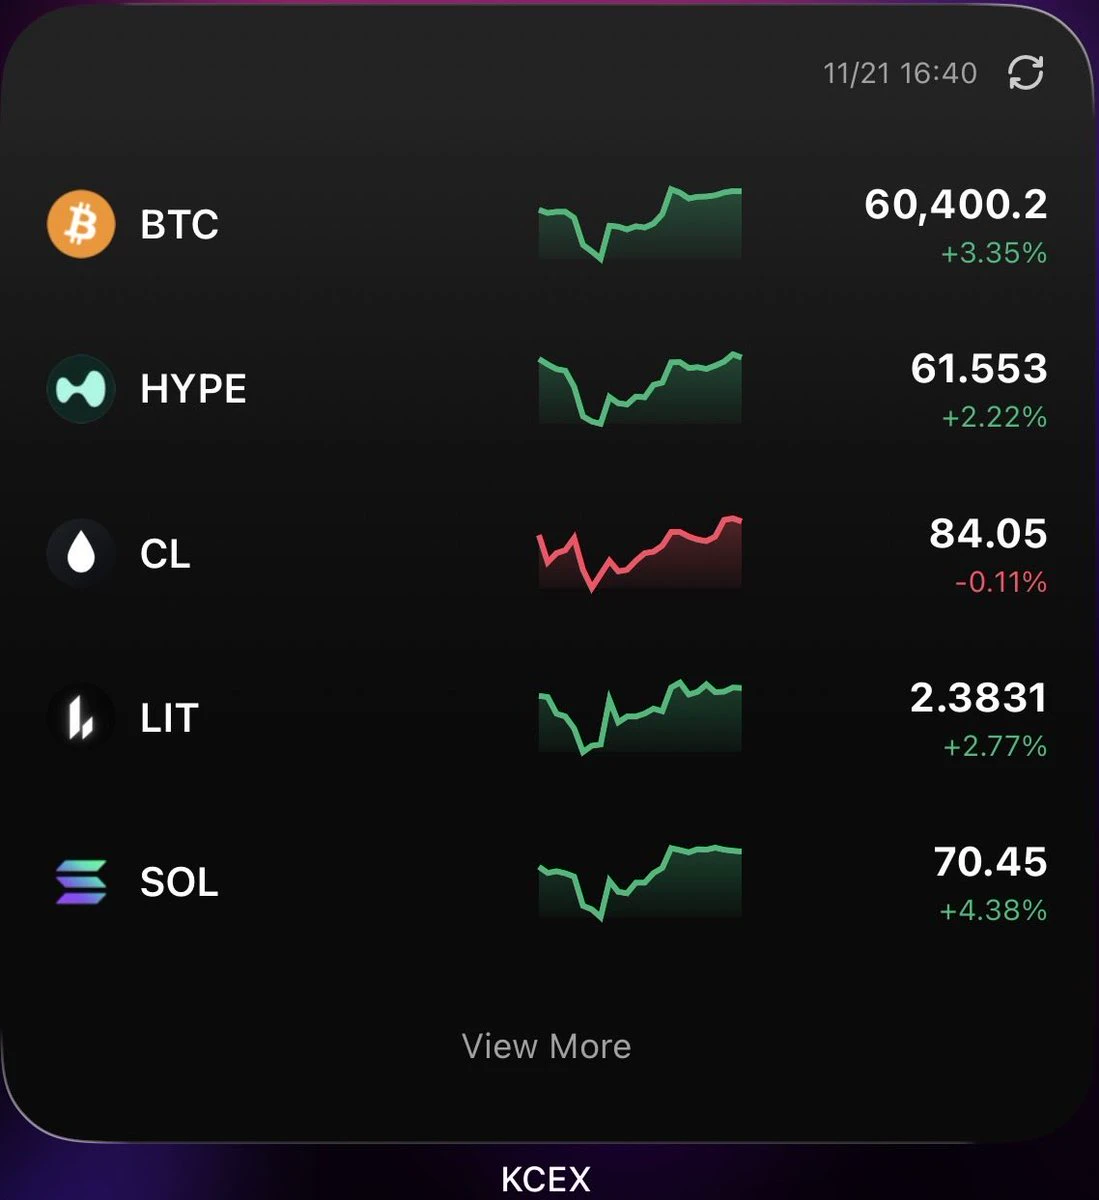
$BTC ‌The sea of red we saw on our screens may have sent a shiver down all of our spines for a moment. Bitcoin dipped below $60,000 for the first time since July, even falling as low as $55,130 at one point. Some of you might have wondered, "Is something even worse on the horizon?" Yet, markets sometimes offer a bit of breathing room, even in their darkest moments. That is precisely what happened: as the weekend approached, Bitcoin staged a recovery, climbing back to the $60,279 level.

So, what fueled this rapid rebound? In essence, the crypto market was purging its own internal excesses. Ac
BTC-0.67%
  • 5
  • 3
$KOR 305.2 million tokens unlocking on December 4,
post-image
  • 2
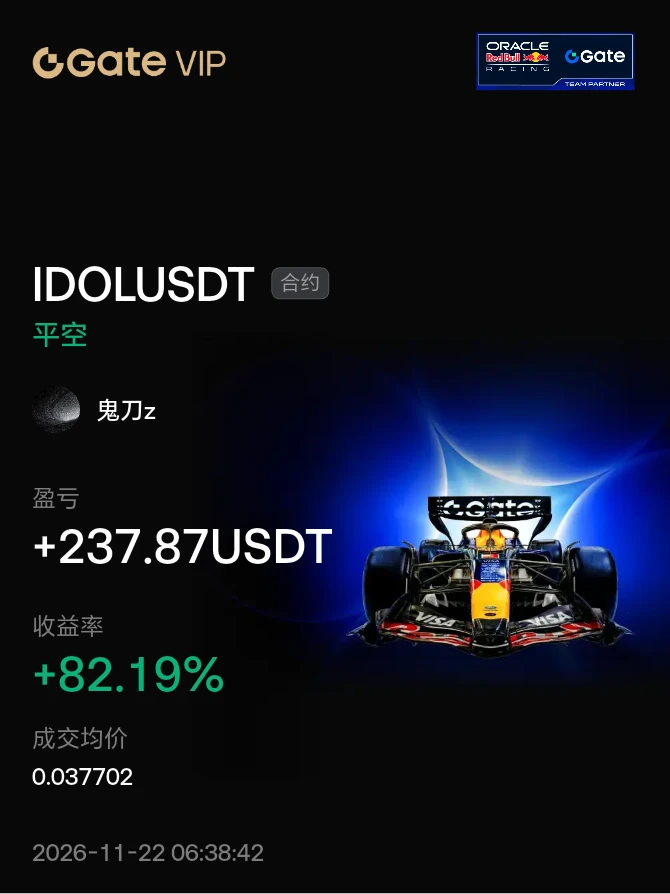
#晒出我的合约收益
Take a small bite of IDOL
Seize the opportunity$ANT #IDOL
post-image
ANT-8.68%
  • 4
  • 1
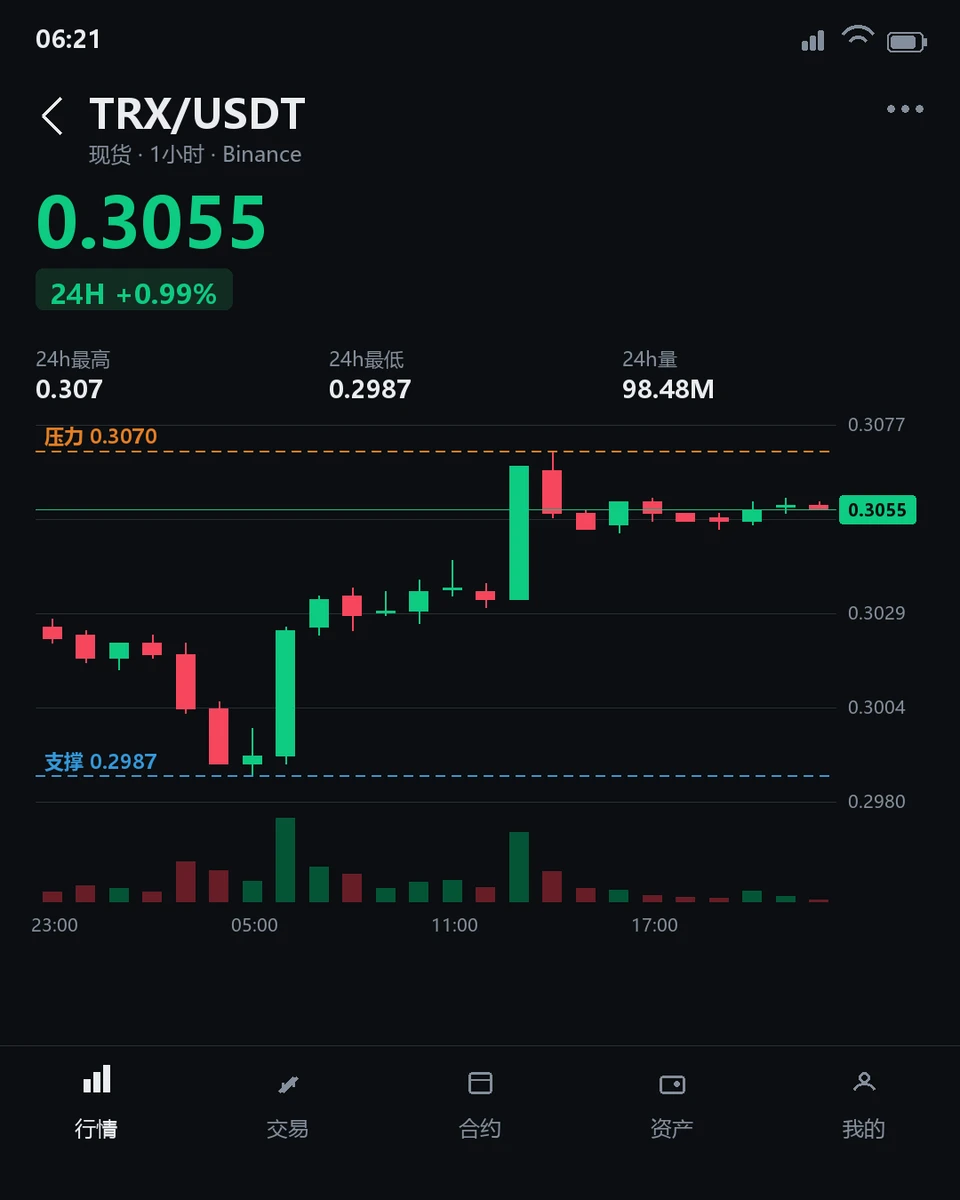
$TRX Is Strong in the Short Term but Weak on the 4-Hour Chart—Which Will Turn First?
$TRX is currently trading at 0.3055, up 0.958% over the past 24 hours, with an intraday range of 0.2987–0.307. The 1-hour chart shows strength, with the price above the EMA20 at 0.30456. The RSI14 is 67.53, in neutral-to-bullish territory, but the volume ratio is just 0.21, far below average, indicating limited participation from short-term buyers. The 4-hour chart remains weak: the price is still below the EMA20 at 0.30594, and the RSI14 at 37.21 has yet to recover from weak territory. Resistance is far above
post-image
TRX+0.42%
HOT HOT HOT 🚨🚨🚨$NAORIS continues its strong rally, with steady momentum—riding the Long wave is pretty nice.$PIEVERSE is pumping strongly again with an Alpha reward; tagging along on the Long wave for a bit is still good.$VVV continues to soar; I’ll hop aboard the Long wave for a bit.📈📈📈
post-image
NAORIS+0.66%
PIEVERSE+0.58%
VVV+0.37%
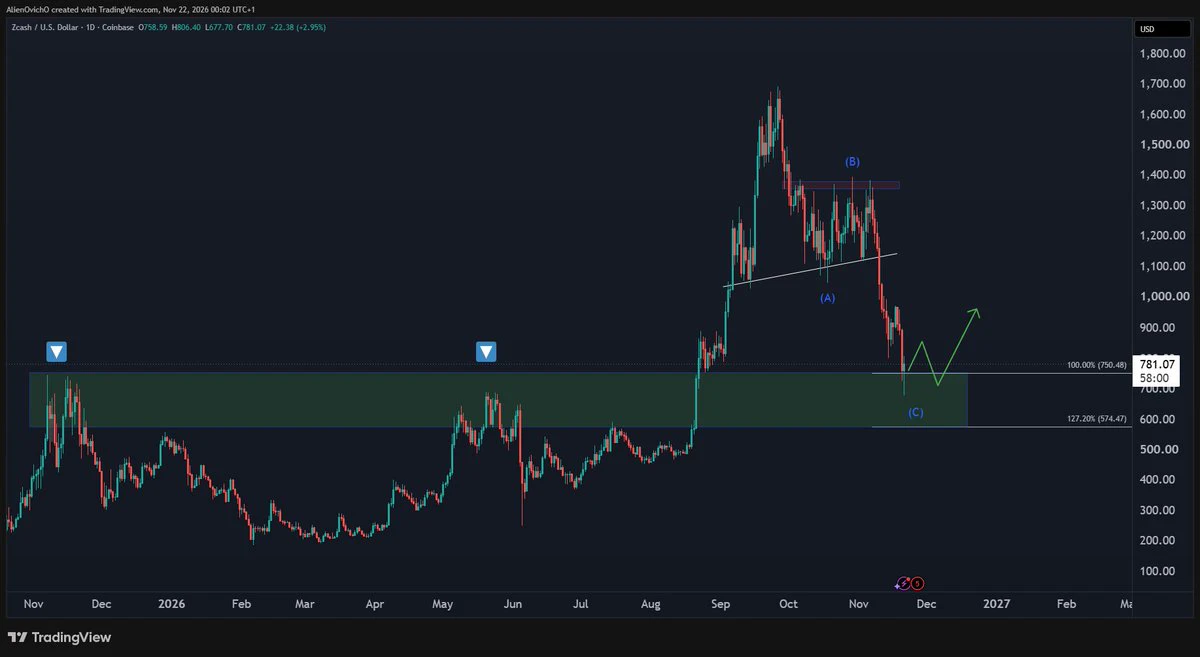
$ZEC is back inside the daily buying zone 🎯
750–575 retests both the 2025 highs and the May 2026 peak, and old resistance is now support.
I expect price to carve a bottom around this area before the 2027 rally.
Accumulating here or waiting lower?
post-image
ZEC+1.16%
Towards the end of the week, something interesting unfolded in the markets. While stocks faced a sharp sell-off, the bond market moved in the opposite direction. The yield on the 10-year U.S. Treasury note fell by more than 10 basis points to 4.948%, while the 2-year Treasury yield dropped by over 13 basis points to 4.647%. In short, capital fleeing the stock market sought a "safe haven"—and it found one in bonds.

Why is this surprising? Because, typically, the expectation of a Federal Reserve interest rate hike pushes bond yields higher. Indeed, the market still views a rate hike in December
BTC-0.67%
GT-2.41%
SOL-0.77%
IDOL-6.71%
4STOCK-3.94%
  • 2
  • 1
Load More

Join 40 M users in our growing community

⚡️ Join 40 M users in the crypto craze discussion

💬 Engage with your favorite top creators

👍 See what interests you

Trending Topics

BTCBreaksBelow60K

2.1M Views30K Discussing

BTC fell below $60,000 on November 20 for the first time since July, alongside a tech stock selloff and broader pressure on risk assets. Will $60K become resistance, or can BTC quickly reclaim it? What price or volume signals would convince you that selling pressure is easing?

GateDirectIPOPhase3ANTAllocates92100Shares

797.2K Views4.9K Discussing

NvidiaDropsNearly14Percent

333.9K Views7.6K Discussing

View More