







Square
Following
Hot
News
Profile
Share your thoughts
placeholder
Article
$SUI Pulls Back to MA Confluence Long Setup, Momentum Just Turned Bearish
Pair: $SUI /USDT
Direction: LONG
Entry Zone: 1.0996
Take Profit:
- TP1: 1.1233 +2.2%
- TP2: 1.1391 +3.6%
- TP3: 1.1628 +5.7%
Stop Loss: 1.068
Chart Structure:
- SUI flushed from ~1.16 down to ~1.08, based out, then pushed back up to a local high near 1.14, and has since pulled back to entry right where MA25 and MA99 are converging, a reasonable support confluence
- Price has dipped just below MA7, using the MA25/MA99 cluster as the support test for this long
- RSI(14) has been oscillating in a healthy 45-65 range an
SUI-8.00%
US Dollar Index (DXY) climbs to its highest level in 18 months.
The dollar index held around 102.2 on Monday, close to the peak of 102.54 reached last week — its strongest since April 2025. The move extends a fourth consecutive weekly gain, the longest streak since 2025.
The drivers behind the move:
• Middle East tensions: Escalation around the Strait of Hormuz and shipping routes is supporting safe-haven demand for the dollar.
• Elevated oil prices: With the US now a net energy exporter, higher crude prices are acting as a dollar-supportive factor rather than a drag.
• Rate expectations: Ris
post-image
BTC-1.99%
  • 2
$SOXS Breaks Out Sharply Short Fades Still-Accelerating Momentum, High Risk
Pair: $SOXS /USDT
Direction: SHORT
Entry Zone: 37.36
Take Profit:
- TP1: 36.13 +3.3%
- TP2: 35.31 +5.5%
- TP3: 34.09 +8.8%
Stop Loss: 39.00
Chart Structure:
- SOXS based out around 34.5-35 for over a day, then broke out sharply with a strong, accelerating rally straight through MA7, MA25, and MA99 to current price a clean, powerful breakout, not a choppy move
- Price is pushing to new highs with no pullback or consolidation yet still in the middle of the move, not showing signs of topping
- ⚠️ RSI(14) has climbed
SOXS+11.05%
$STRK is moving, but trading volume has yet to confirm it, which is more worth watching than the 24-hour -20.12%.
This time, I’m not looking at the gainers and losers list, only the levels. The current price is 0.09075, about 1.12% from the 1-hour support at 0.08973 and about 39.39% from the resistance at 0.1265.
My criteria are simple: only a break above 0.1265 followed by continuation would count as an upside follow-through; a break below 0.08973 invalidates the previous assessment. The 1-hour and 4-hour trends are both weak, with RSI at 34 and 48, respectively.
The current debate is not ab
post-image
STRK-27.90%
$Dos The longs and shorts got absolutely wrecked in the middle of the night!
The volatility is huge, and opening new positions isn't allowed anymore, so I can only reduce my position! 😂😂😂
post-image
DOS-16.14%
$RENDER has dip-resistant quantum tech built in ✊🏼
post-image
RENDER+5.02%
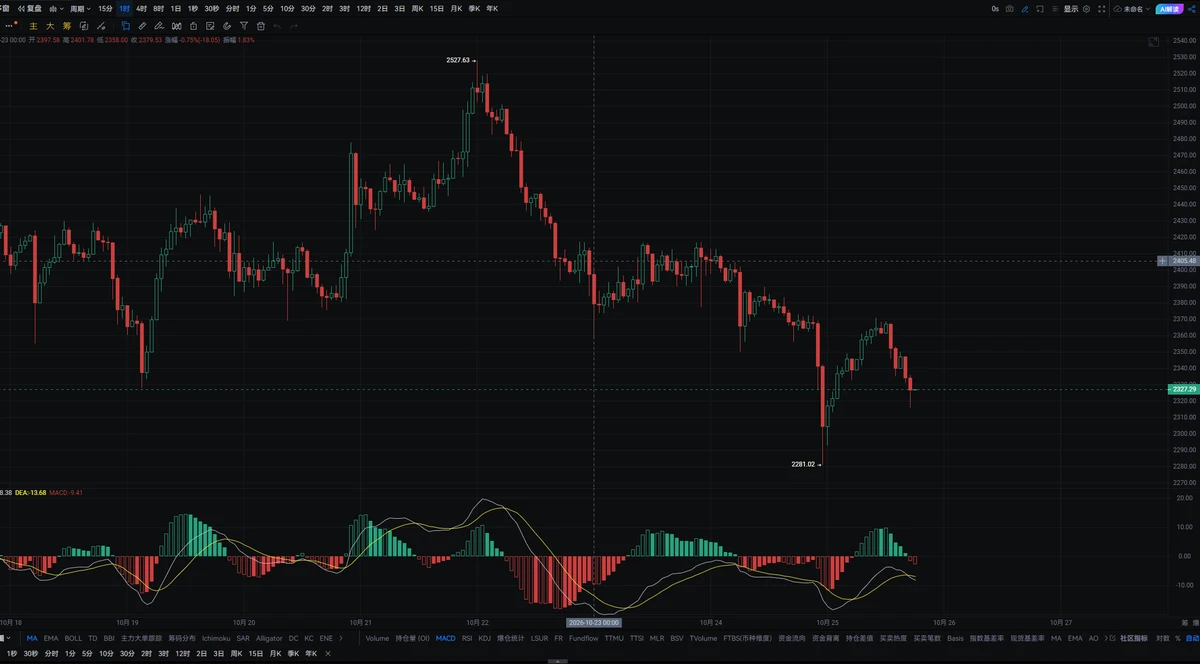
$ETH Smashes Downside Targets 💥🎯
Looking for a double bottom or Adam and Eve double bottom to form in this area.
NFA, DYOR ⚠️
#Crypto #Trading #ETH
post-image
ETH-3.00%
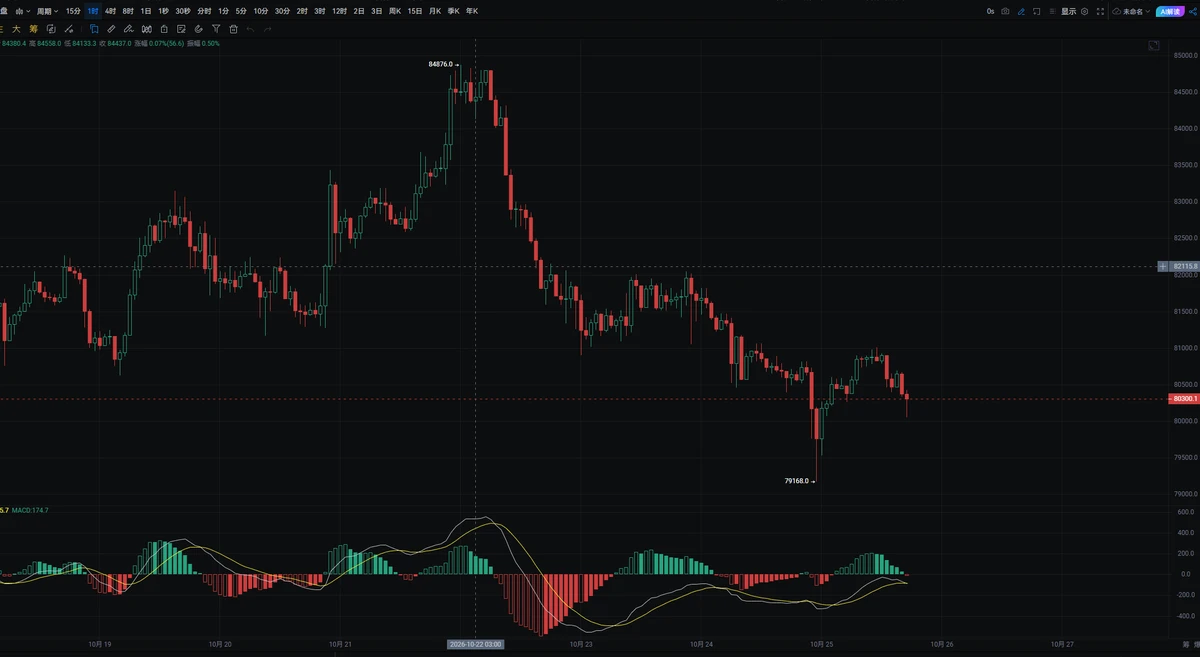
Bitcoin rebound nears $85K as past buyers prepare to sell
Bitcoin and Ethereum extended their weekend recovery, but on-chain indicators and derivatives positioning suggest the rebound faces significant obstacles.
Data from CryptoSlate showed that Bitcoin briefly climbed above $84,000 after falling toward $80,000 during last week's selloff. Ethereum also recovered above $2,500, reversing part of its recent losses as buying activity returned to the cryptocurrency market.
⚠️ Personal market analysis only. NFA — manage risk and DYOR.
Educational content, not investment advice or a recommendation t
post-image
BTC-2.01%
ETH-2.99%
Bitcoin Market Update Today 📊
live-cover
LIVE19
Don’t touch $FIL under any circumstances. With today’s -11% bearish candle, people in the group are still asking whether they can buy the dip—I advise you to put the knife down first.
I felt something was off while watching the market this morning. After surging to a high of 1.2688, it has been sliding steadily, with barely any meaningful volume on the rebounds, and every small bounce has been slammed back down. I just checked the market: the current price is 1.1139, with 24h trading volume still at $262 million—volume hasn’t contracted, so what does that mean? It means those who are running a
FIL-9.81%
$UNI ’s low levels are beginning to attract attention, but cheapness can never replace evidence of a bottom. I’d rather lay out the bear case first.
Bears see the risk of breaking below 7.18, while bulls need to prove that buyers remain after breaking above 7.839. Current volume is 0.87x.
The current price is 7.196, about 0.22% from the 1-hour support at 7.18 and 8.94% from the resistance at 7.839. Positioning determines which side is more urgent; the next level to watch shifts to 7.103.
Letting the boundaries provide the answer is more reliable than guessing the next candlestick. Do you think
post-image
UNI-8.54%
#晒出我的合约收益
#DOS The flood discharge speed is too fast! Congratulations to those who followed my trade!
$DOS ‌
post-image
DOS-16.14%
$SNDKB has entered oversold territory, but “it’s due for a rebound” and “it has bottomed out” are completely different things.
I’m only watching one point of divergence: whether it can quickly reclaim 1,466.86 after breaking below it. The current price is 1,480.55, with volume at 0.23x. The 1-hour and 4-hour trends are both weak, with RSI at 24 and 14, respectively.
If it breaks above 1,615.99 and volume continues to expand, the initiative will favor the bulls; if it falls below 1,466.86 and fails to reclaim it, the short-term assessment is invalidated. Stop guessing the bottom for now and wa
post-image
Financial News, Crypto Updates, Real Trading Strategies
live-cover
LIVE985
$DOS drops by one percent and can still accompany 3,000—I’m speechless
post-image
DOS-14.63%
Microsoft is scheduled to report fiscal Q1 2027 earnings on Oct 28, after market close.When four of the world's largest companies are all in the same sector, what does that concentration mean for the broader market? 🤔
$MSFT ‌
post-image
User_any
$MSFT ‌
📈 Microsoft has reclaimed a $4 trillion market cap, bringing the number of companies above that threshold to four.
The milestone was reached on Monday, roughly a year after the company first crossed it in July 2025. The move follows the unveiling of Microsoft's next-generation Maia 300 AI chip, which the company says can handle more useful computing per megawatt than leading GPU-based systems.
⚖️ The $4 trillion club:
• Nvidia: ~$5.47T
• Apple: ~$4.96T
• Alphabet (Google): ~$4.26T
• Microsoft: ~$4.00T
All four are technology companies, and AI-related demand has been a central driver of their valuation gains. Microsoft's return to the threshold reflects renewed confidence in its AI and cloud strategy after a period of investor caution around hyperscaler spending.
When four of the world's largest companies are all in the same sector, what does that concentration mean for the broader market? 👇
#MSFT #AI #GateSquare #BigTech
Not financial advice.
repost-content-media
MSFT+1.13%
  • 3
#晒出我的合约收益 Everything is because you're too timid, but know when to quit while you're ahead
post-image
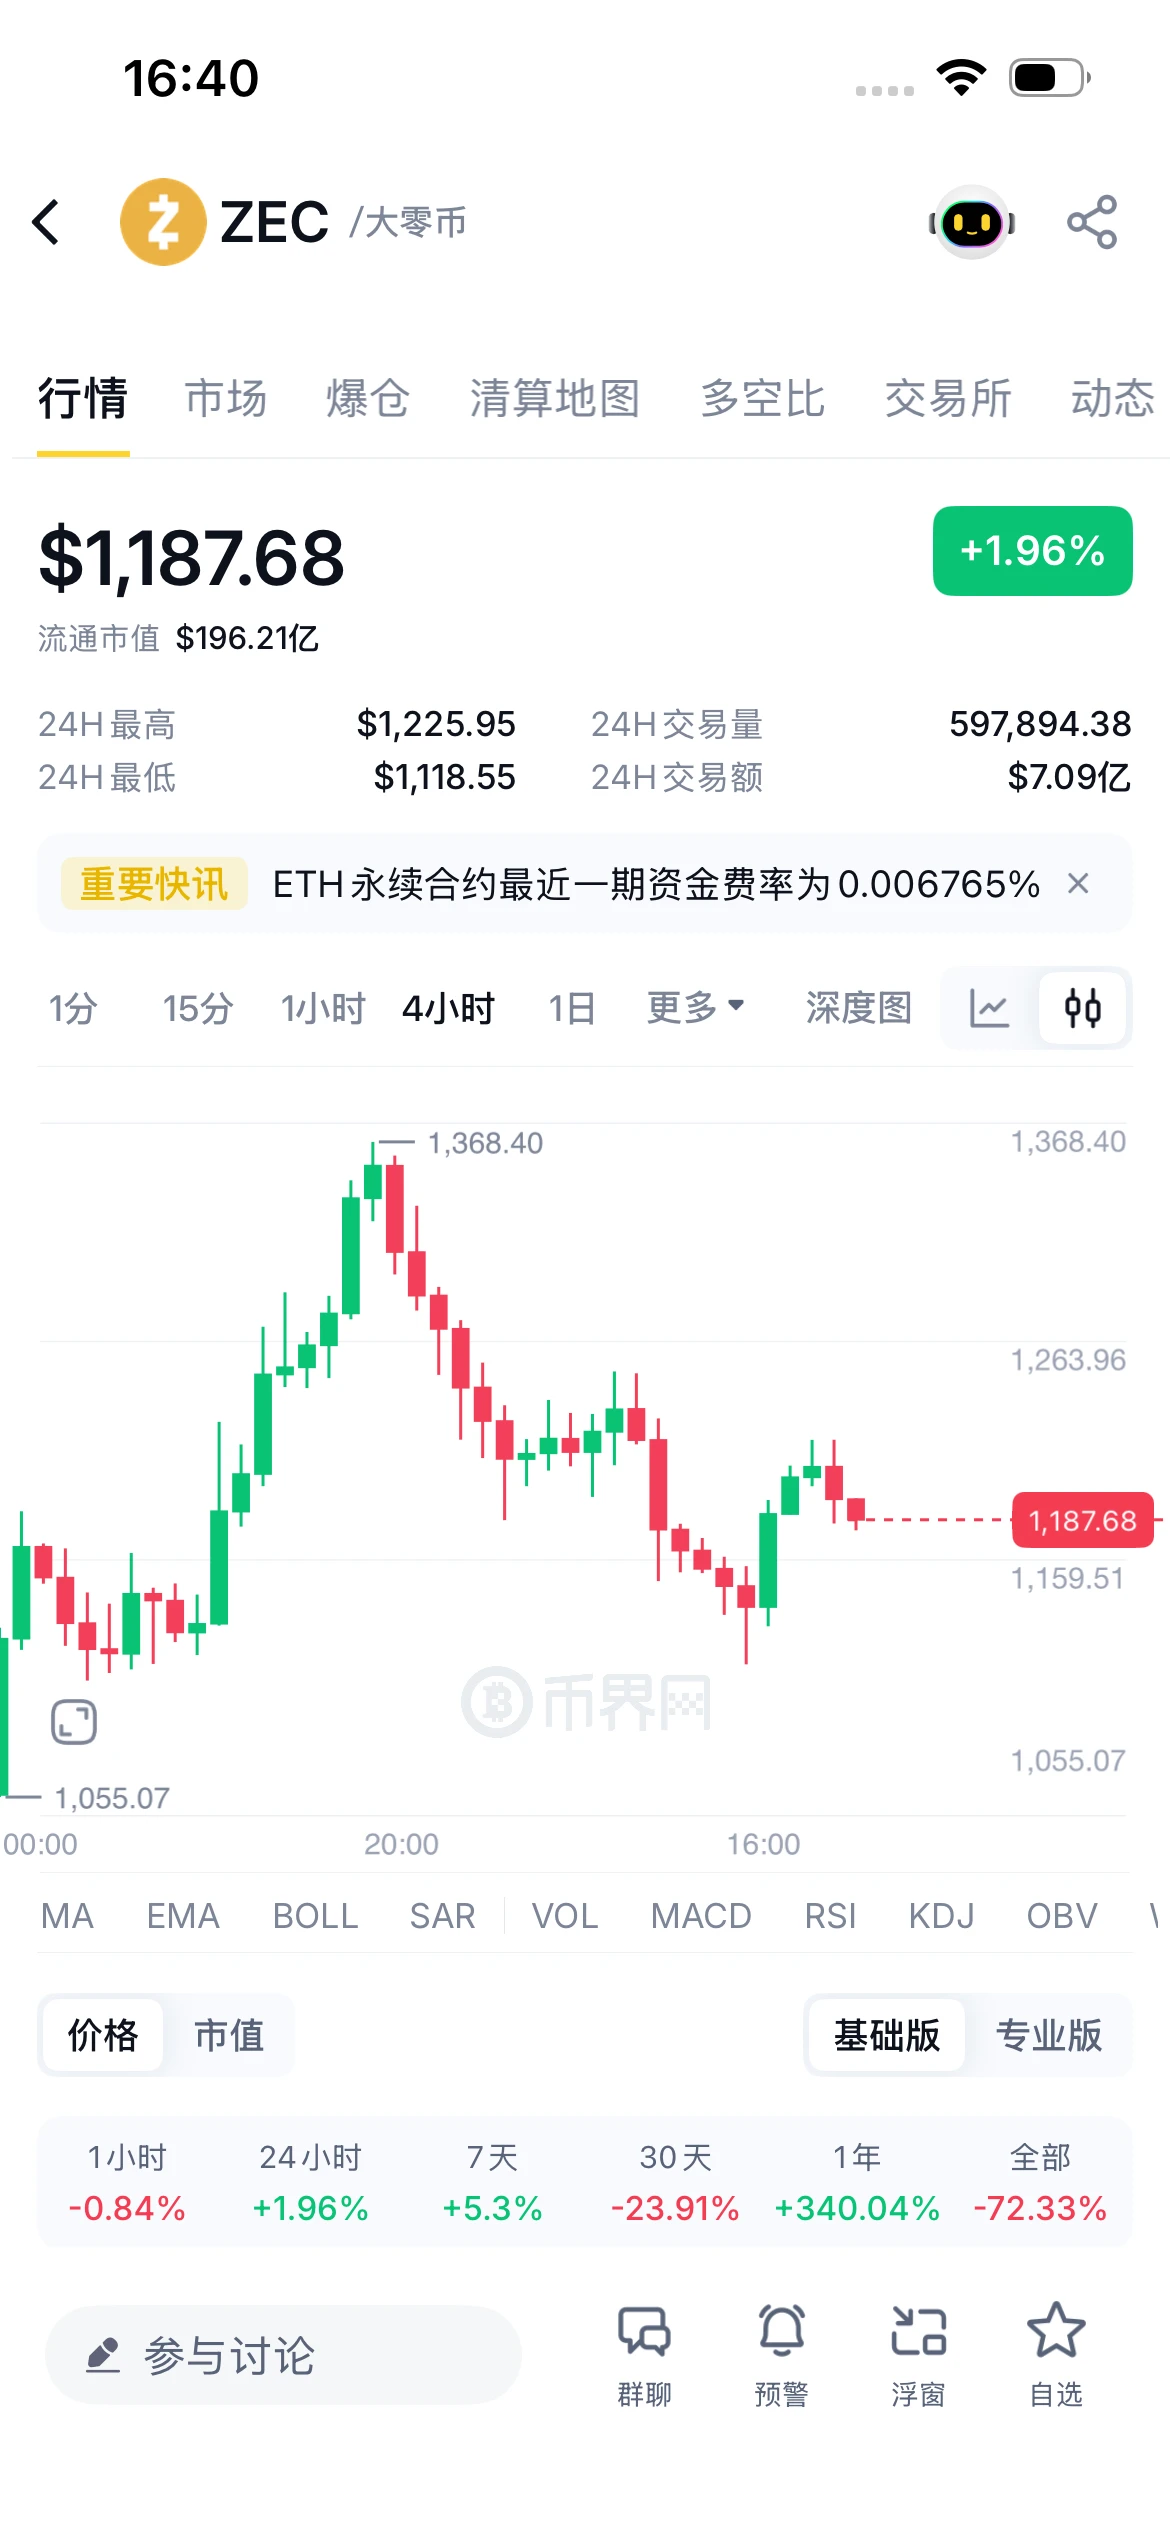
Insiders are loading ZEC at 1206 but most traders still think the breakdown is real.

$ZEC /USDT - LONG

Trade Plan:
Entry: 1201.38 – 1212.24
SL: 1154.64
TP1: 1245.94
TP2: 1272.02
TP3: 1311.15

Why this setup?
Why now? The daily trend is bullish and the 1h price is holding 1206.81, which keeps the long setup intact. The 15m RSI is at 26.5, signaling extreme oversold conditions that often precede a sharp reversal. The 1h ATR of 21.74 means the average candle span is wide enough to validate a genuine move rather than a fakeout. The entry zone between 1201.38 and 1212.24 aligns with the curren
ZEC-5.26%
The Fear & Greed Index remains in the greed zone at 69, but $BOME is currently priced at 0.0007936, down 27.98% over 24h, with an RSI of only 13.2, a typical extreme oversold reading; MA5=0.00081674 has fallen below MA20=0.00090342, the MACD histogram at -5.945e-06 remains bearish, and the lower Bollinger Band at 0.00073445 is within reach. The broad-market greed sentiment diverges from panic selling in individual coins. If BTC stabilizes, oversold rebound momentum is likely to be released first in assets with negative funding rates—$BOME's funding rate is -0.0138%, with short-side crowding a
post-image
BOME-28.91%
CHIP-14.32%
Why is everyone ignoring the quiet setup forming in QQQ?

$QQQ /USDT - LONG

Trade Plan:
Entry: 746.20 – 746.90
SL: 742.18
TP1: 749.82
TP2: 752.01
TP3: 755.28

Why this setup?
Why now? The daily trend is range, which means the market is coiling for a breakout and the 1h RSI at 42.4 shows room to run before overbought. The 1h ATR of 1.399337 signals enough volatility to push QQQ from the entry zone near 746.55 up to TP1 at 749.82 and then TP2 at 752.01. The invalidation level at 742.18 is the hard line that protects this trade, because a breach there means the range is breaking the wrong way
QQQ-0.98%
Load More

Join 40 M users in our growing community

⚡️ Join 40 M users in the crypto craze discussion

💬 Engage with your favorite top creators

👍 See what interests you

Trending Topics

GateWCTCS9GlobalTradingCompetition

35.65k Views5.5k Discussing

Gate WCTC S9 Global Trading Competition is officially live, crossing asset boundaries across crypto, stocks, and CFDs with an 8M USDT total prize pool. The Lucky Launchpad guarantees a win every time, new users get a 20 USDT futures voucher upon registration, and the Event Contract PK tournament features a prize pool of up to 400,000 USDT.[👉 Read announcement](https://www.gate.com/announcements/article/102133)

GateXRedBullWinsSingaporeGP

174.59k Views6.53k Discussing

WillYouBuyDipInKoreanStocks

61.92k Views1.79k Discussing

View More