Square
Following
Hot
News
Profile
Share your thoughts
placeholder
Article
#GateBTCAndETHFuturesVolumeRanksTop3 Gate BTC and ETH Futures Volume Ranks Top 3: What Is Driving the Market?
Big money does not move through the crypto market without leaving clues. One of the most important clues traders watch is futures trading volume.
Bitcoin and Ethereum remain at the center of the cryptocurrency derivatives market, and Gate's reported top-three ranking in BTC and ETH futures volume highlights the importance of its role in this highly competitive trading environment.
But what does a top-three ranking actually tell us? And why should ordinary crypto traders pay attention?
post-image
BTC+0.93%
ETH+0.71%
  • 9
  • 1
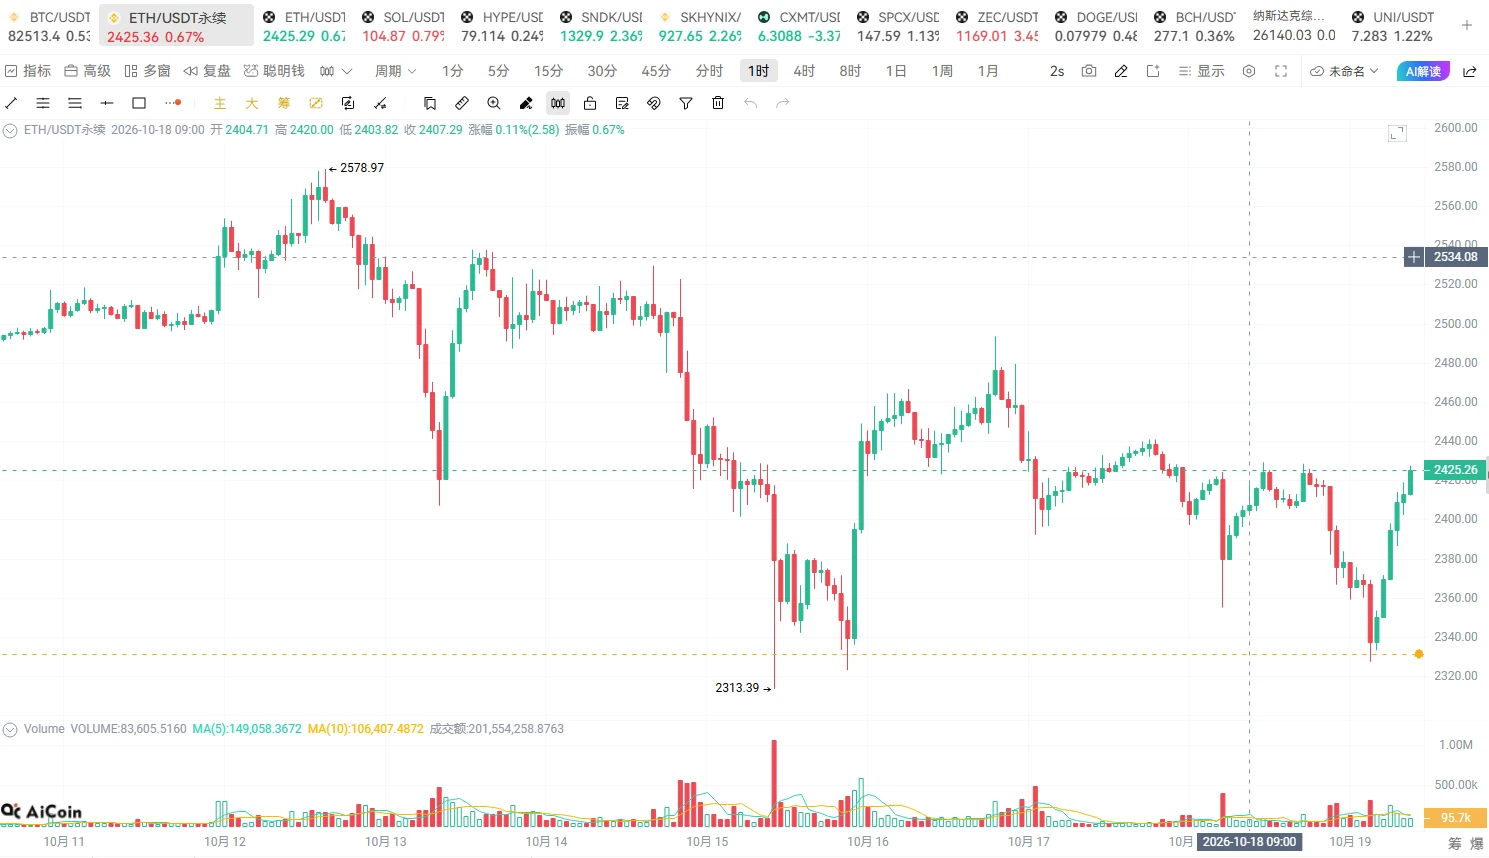
Starlink | ETH | October 18 Trade Idea Review
Yesterday’s idea for ETH:
Entry range: 2380—2400
Stop-loss: 2360
First target: 2440—2450
Second target: 2470—2480
Yesterday, the key point was just one sentence: buy the pullback, but wait for confirmation.
Looking at the chart, ETH briefly dipped to around 2320, then rebounded quickly and is now back above 2420. The rebound has been strong.
This move once again shows that ETH has been highly volatile lately. Even when the price appears to have reached a support area, it may still fall further. Don’t buy the dip just because the price has dropped a
post-image
BTC+0.93%
ETH+0.71%
Trenches
TSI
T
bade
b
TSI
0xa8...1c1e
Market Cap
$.
Change
.
24h Vol
$.
Holders
.
CNPY
C
bade
b
CNPY
0xc6...ddd2
Market Cap
$.
Change
.
24h Vol
$.
Holders
.
AGT
A
bade
b
AGT
0x5d...e274
Market Cap
$.
Change
.
24h Vol
$.
Holders
.
BOOMER
B
bade
b
BOOMER
0x5a...5c00
Market Cap
$.
Change
.
24h Vol
$.
Holders
.
CLAUDIA
C
bade
b
CLAUDIA
0xd5...5261
Market Cap
$.
Change
.
24h Vol
$.
Holders
.
$ONDS is a really popular pick, but some things about the company's corporate dealings just don't sit right with me
Ron Stern was chairman of Airobotics and a partner at OurCrowd, which owned 19.6% of Airobotics
In 2022, Airobotics was financially distressed, losing millions and warning that it might not survive without additional financing. Yet Ondas acquired it at a 71% premium
Two years later, Ondas appointed Stern to its board and awarded him a highly generous compensation package, including options equivalent to 3% of the company's outstanding shares
The options vested early when Ondas's
ONDS-4.80%
#BitcoinTops$82K
Bitcoin is trading around the $82,000 area, but it is not comfortably above it. It fell to about $80,000 on October 15 after hot CPI and PPI data, then rallied sharply on October 17. Treat the level as a zone, not a settled breakout. Here is the post in English, with no hashtags, no stars, no tables or charts, and no banned terms.
Bitcoin Price Analysis for Monday, October 19, 2026: Can BTC Hold Above $82,000?
Bitcoin has been the center of attention this month, and the reason is simple. After weeks of trying to climb back toward the upper $80,000s, BTC has been pushed and pu
post-image
BTC+0.87%
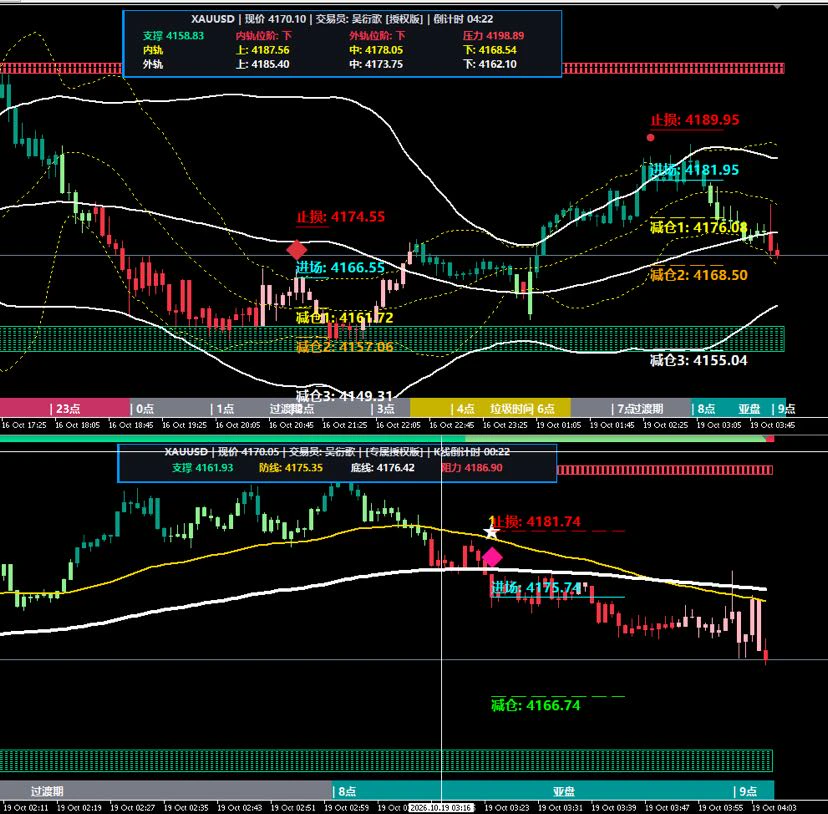
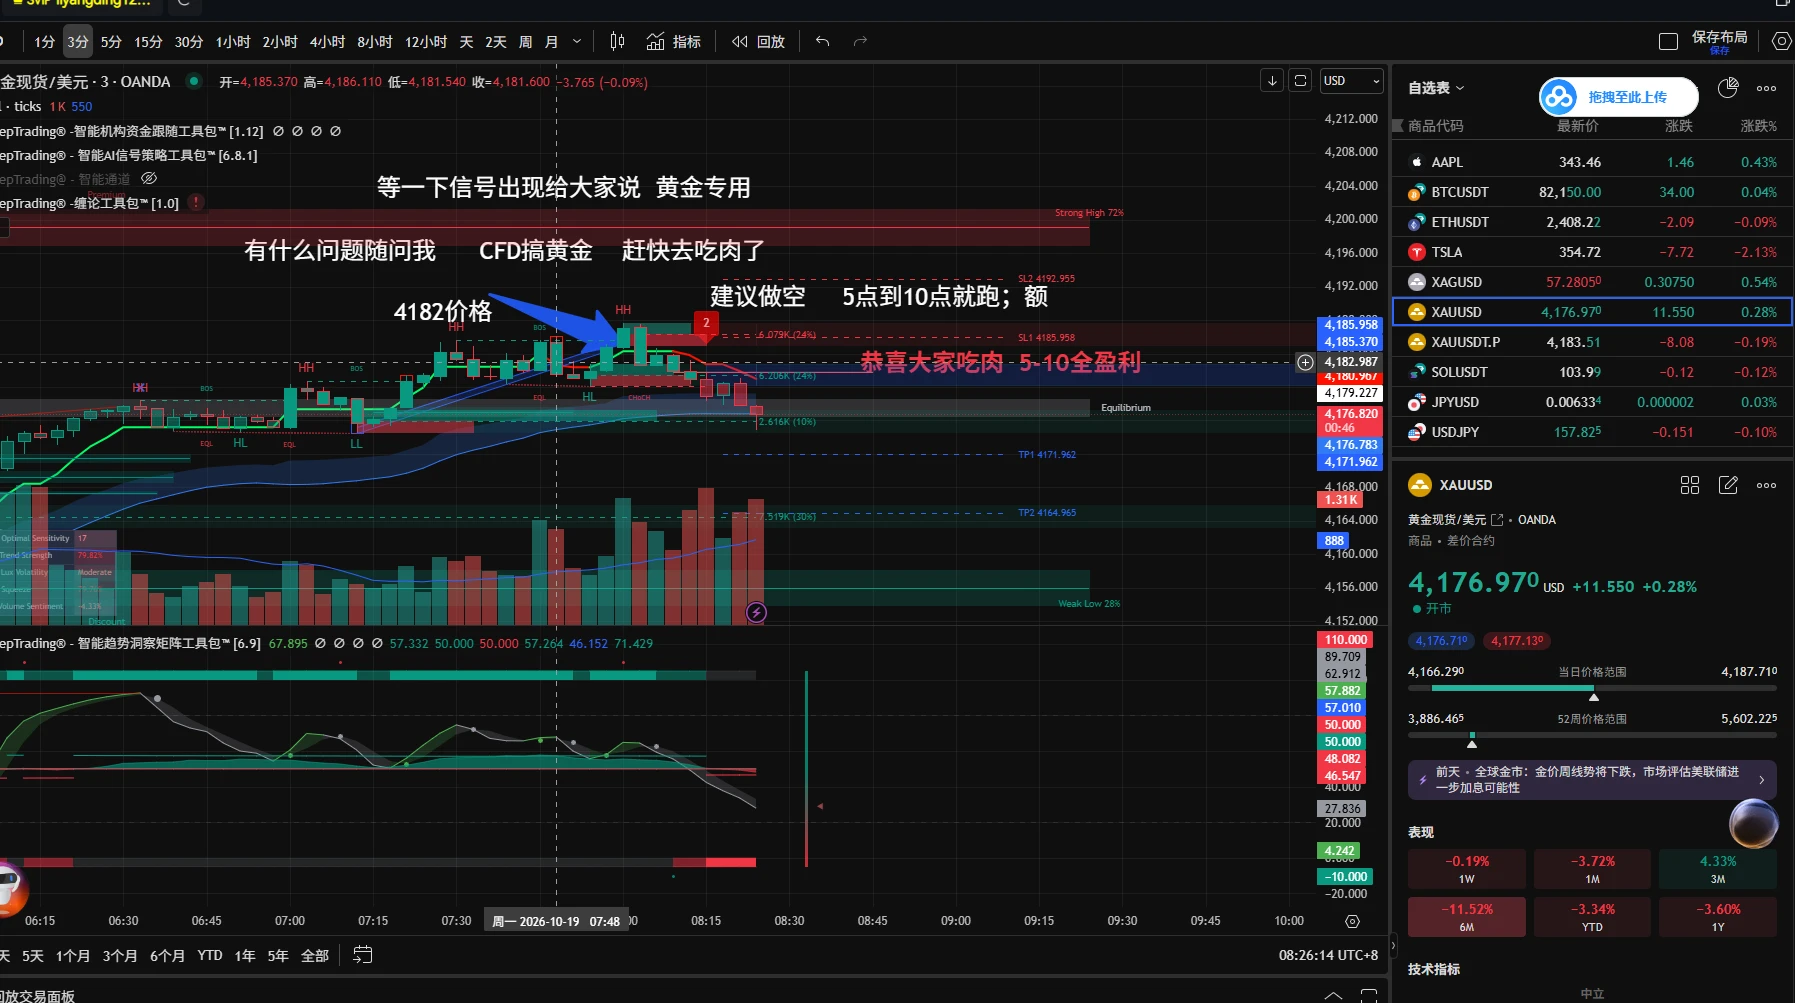
$XAUUSD Congratulations to the gold-only members for cashing in on gains and securing their profits. Software signals are shared with
those working alongside us. #
post-image
XAUUSD+0.43%
#BitcoinTops$82K Friends, you don’t need to be in the market all the time. Save your bullets, get plenty of rest, and eat well. Conserving your energy and re-entering at crucial moments is the best strategy. Trying to profit from every upswing and downswing just isn’t realistic.$SOL
SOL+1.28%
  • 1
One signal from each this morning: an 81.95 short and a 75.74 short. The first is the new quant running for 5 minutes; the one below is the old one. I’ll test it live for a week before launching.#美国9月PPI大超预期
post-image
Bitcoin is on the 2-week chart. Hold long-term positions with favorable entry levels; use stop losses for unfavorable entries. Always set a stop loss on short-term trades! BTC resistance levels: 83594/85072/86222. BTC support levels: 80638/79160/78010. ETH resistance levels: 2453/2497/2531. ETH support levels: 2367/2323/2290. Set the stop loss slightly beyond the third price level. Intraday trades should be no more than 5% of your position. Livestreams are held in the afternoon and evening; follow my profile to find me.#Gate两大币种合约成交额跻全球前三
post-image
BTC+0.93%
What if we don’t nuke on a random Monday?
post-image
Finishing the weekly meeting means 80% of the week’s work is done
Going downstairs for some noodles, 5u
Don’t rush to chase.
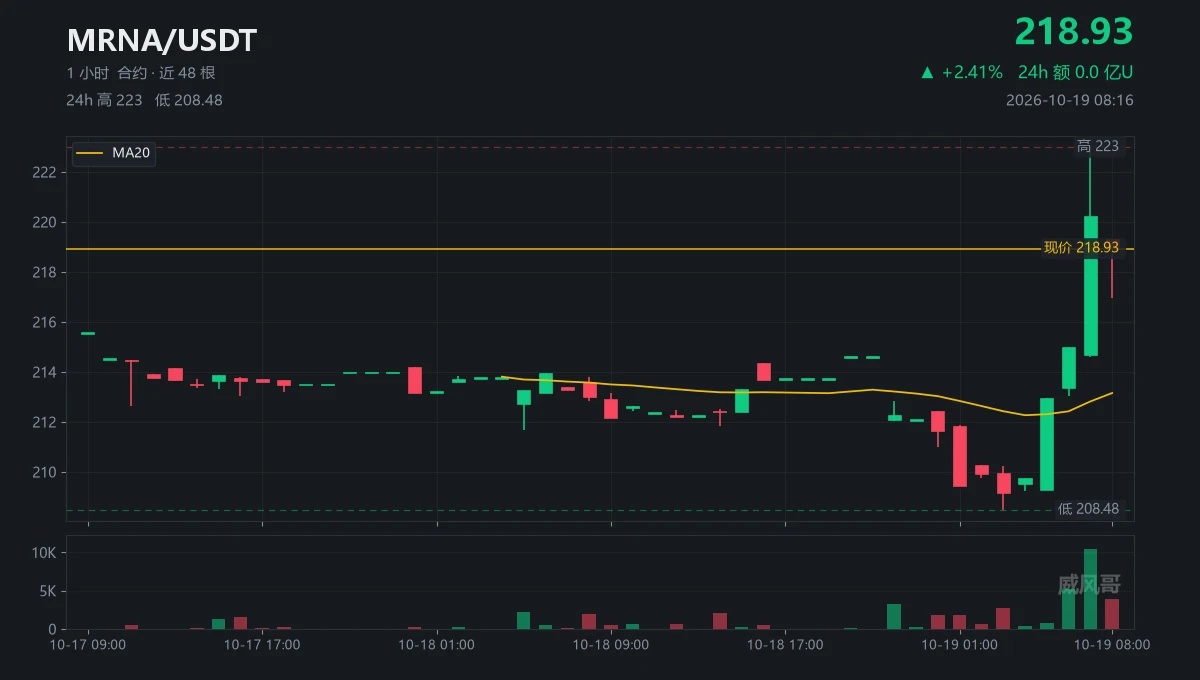
Left: 03:00 a.m., 208.48
Right: four hours later, 223
Middle: now, 218.93
The same $MRNA , with just $77k traded in 24 hours
With liquidity this thin, even a slightly larger order can draw upper and lower wicks
Scenario one: hold above 220.22 and take out 223, and the weekend range will have finally broken to the upside
Scenario two: fall back below 216.94, and it’ll have to revisit that wick at 208.48
I’m not guessing which way it goes (those with no position are the freest)
Of the 14.52 points from 208.48 to 223, half were drawn by wicks
Whoever moves first is wrong; I’ll
post-image
MRNA+2.42%
  • 1
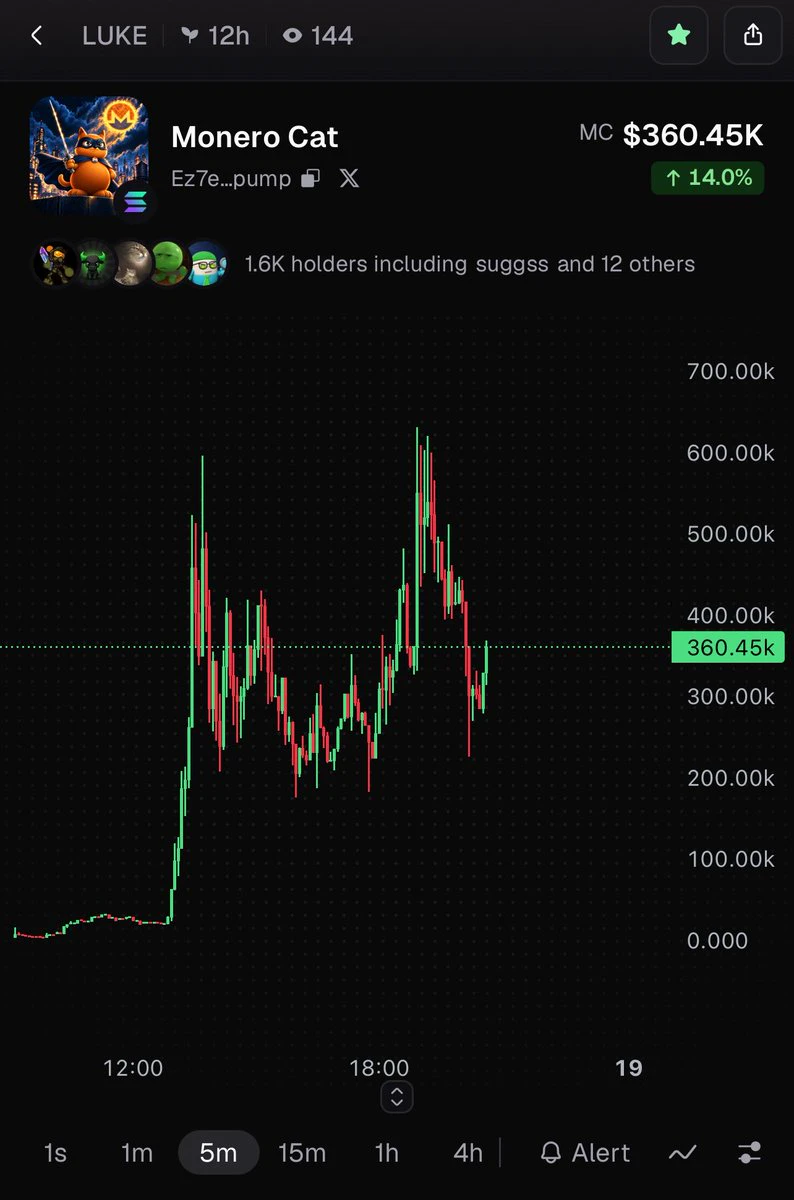
solana:Ez7eEs53hQiXgCGmcbhdX5i1jgg2gC3F6MoeosuVpump
Ez7eEs53hQiXgCGmcbhdX5i1jgg2gC3F6MoeosuVpump
#crypto $sol
post-image
SOL+1.28%
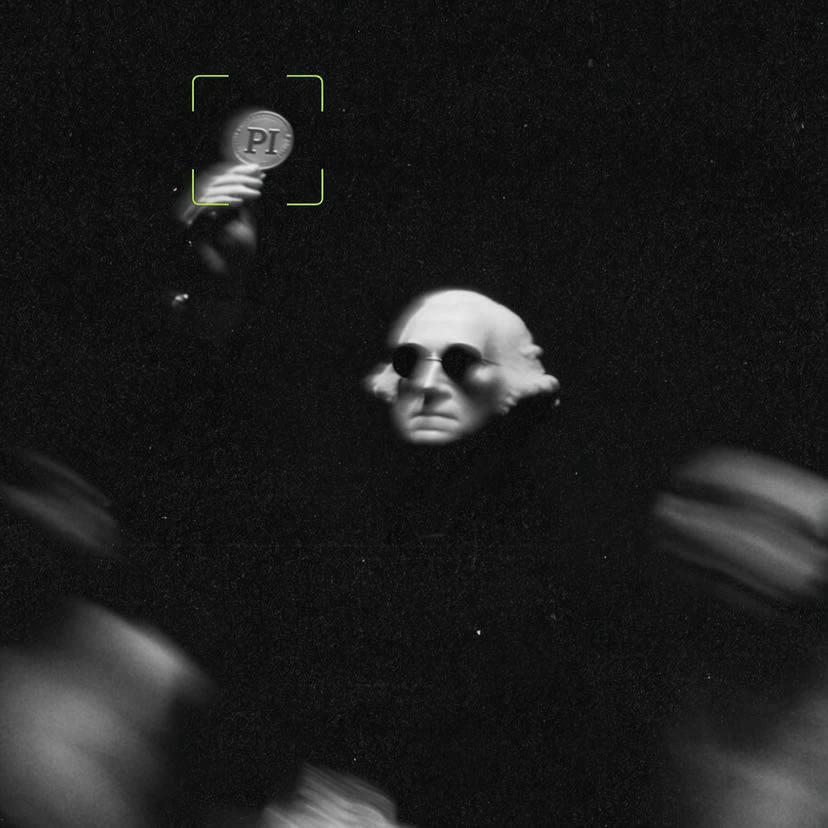
They are laughing, we're studying. They are selling, we're accumulating. They are doubting, we're persevering.
And then they turn around and say this is luck?! 🤣🔥 $PI ‌
post-image
PI-0.31%
  • 6
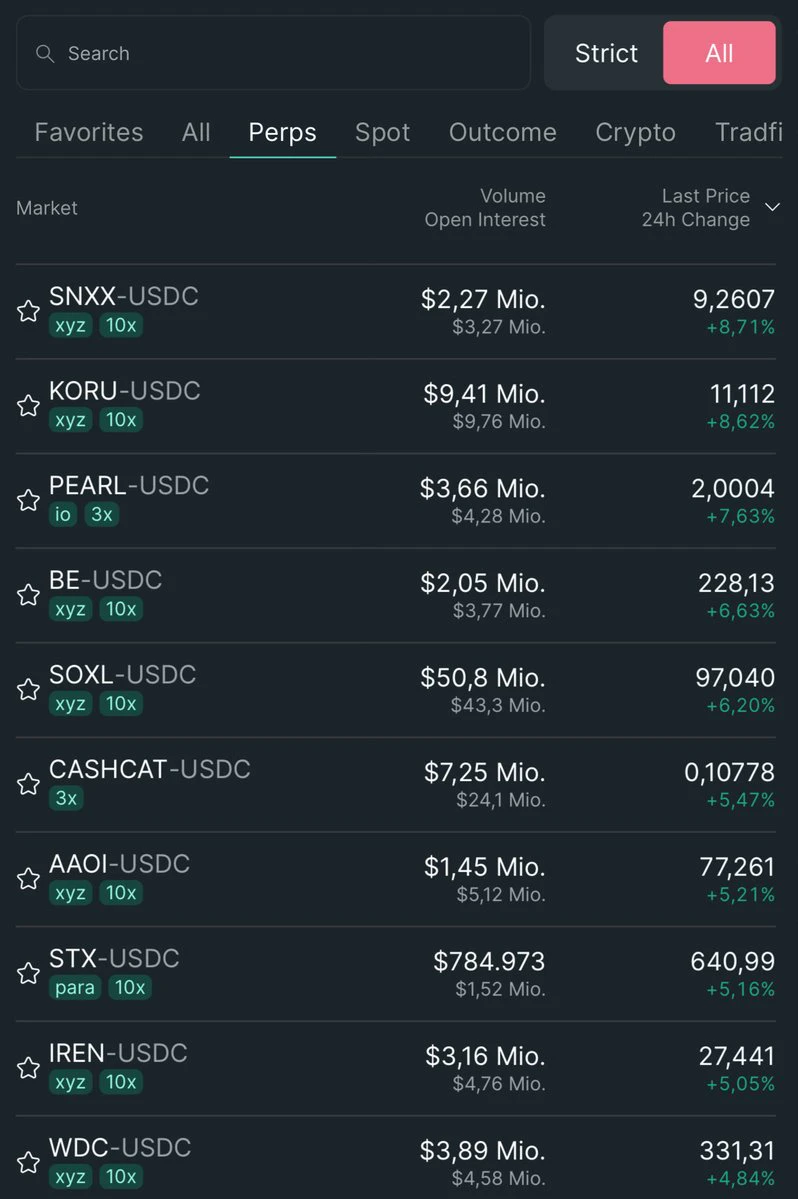
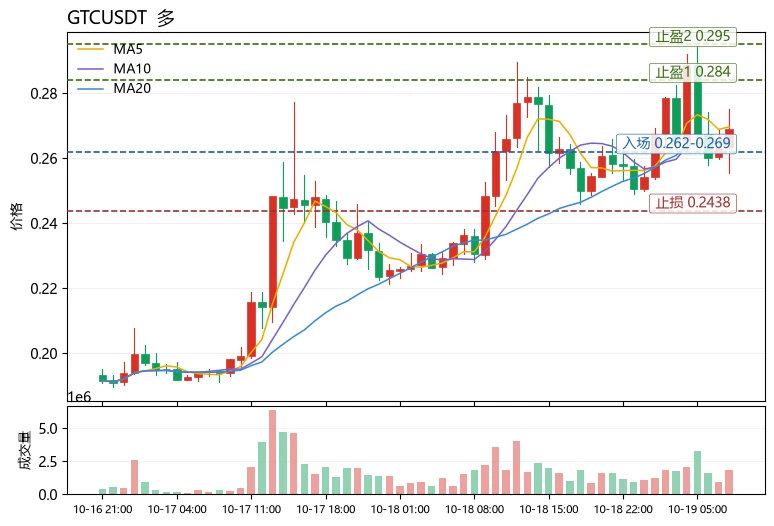
Among today’s three movers, the asset with the healthiest relative strength has a clear pullback structure, making it better suited for buying on dips. Side-by-side comparison: KORUBUSDT is up 9.05%, but its RSI has reached 73 and its price has broken above the Bollinger upper band at 11.0032, indicating clear overbought conditions; SNDKBUSDT is up 4.53%, with an RSI of 70.7 and its price likewise near the upper band at 1305.9. Bullish momentum remains, but the risk of chasing is high. By contrast, $GTC leads with a 17.89% gain over 24h, while its RSI is only 55.1 and its price of 0.26879 re
post-image
GTC
GTC芝麻币
Gate.Fun
MC:$0.1Holders:1
0%
SNDK+5.27%
KORU+12.20%
🔹A Huge Earnings Week Is Here! Jensen Huang Takes the Stage at GTC as Meta and Tesla Report Earning
live-cover
LIVE1,764
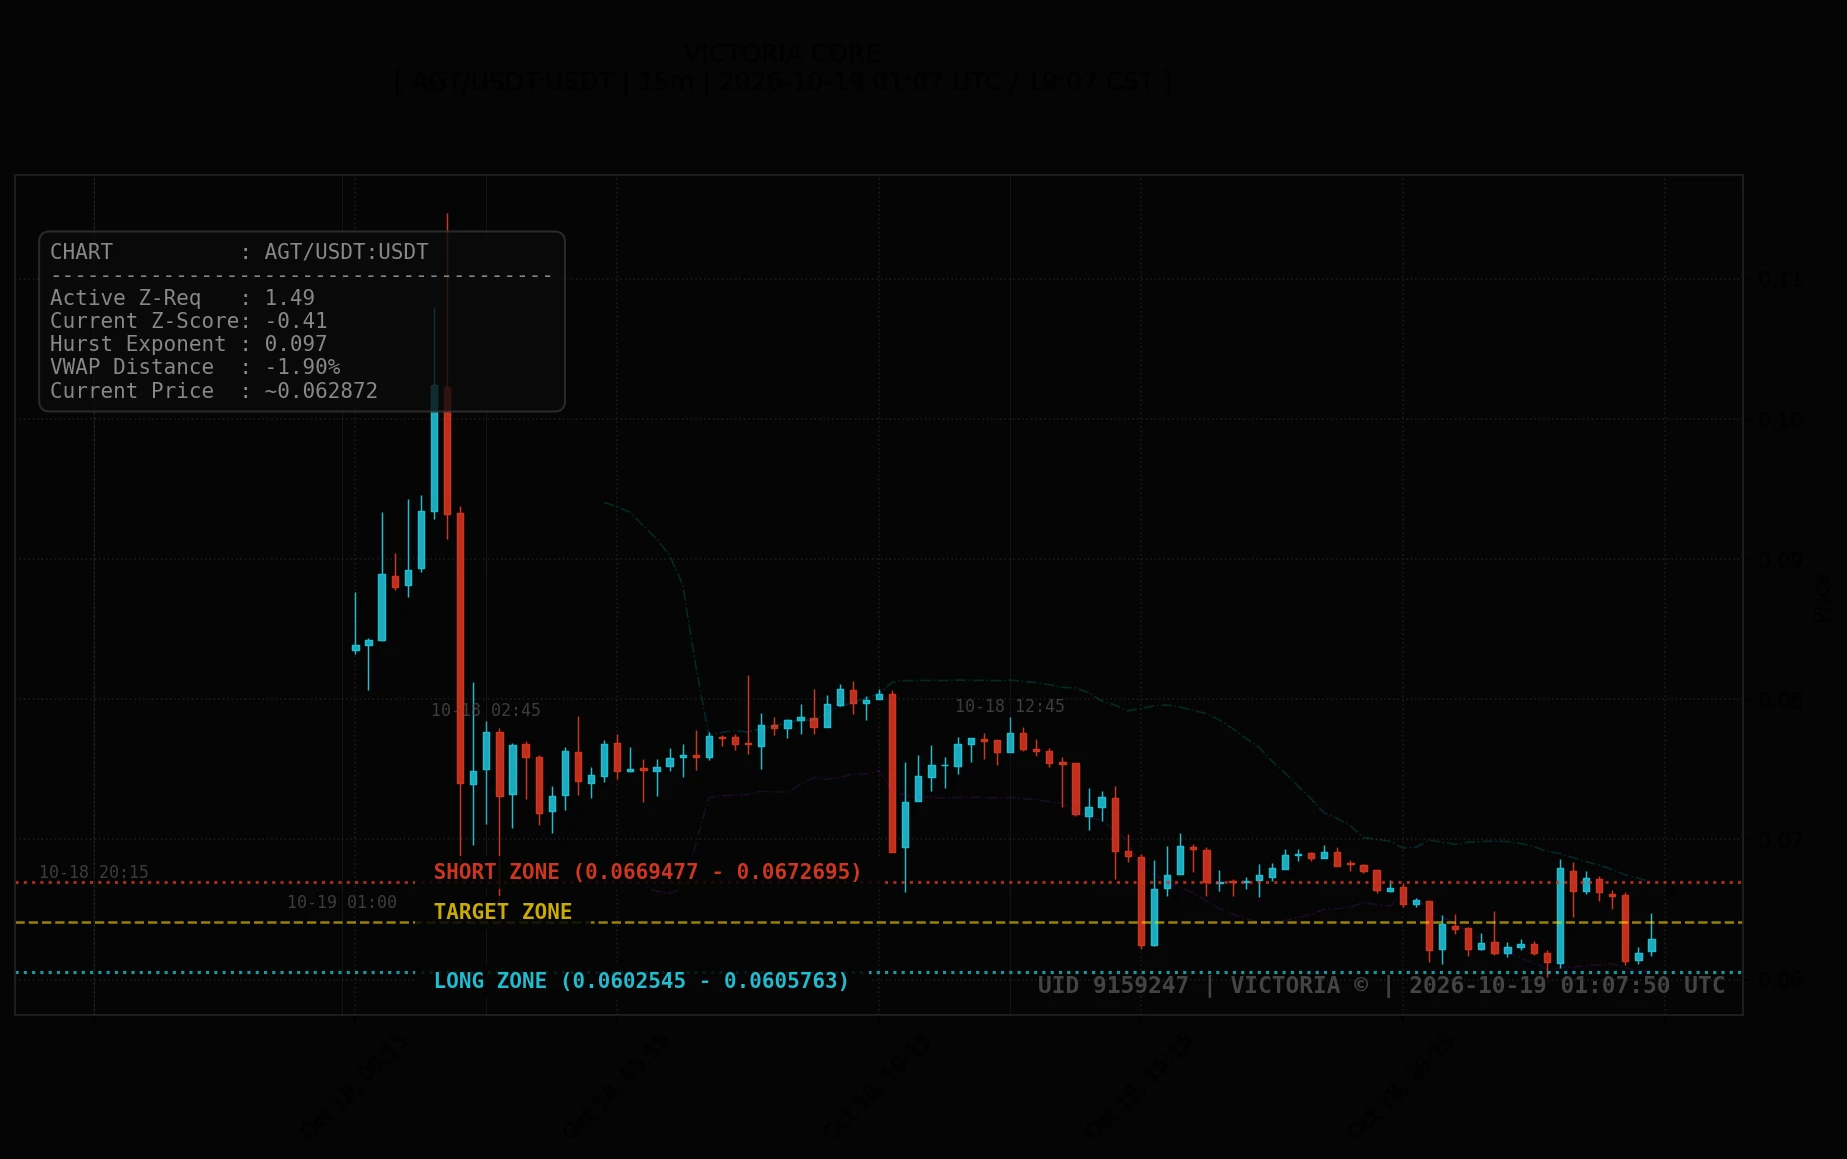
2026-10-19 01:07 UTC. AGT/USDT swept both range extremes over the last four hours—bottoming out at 0.060225 USDT before capping near 0.068604 USDT—and has now settled back into the lower half of its channel. The price currently trades just beneath central equilibrium, preparing for another mean-reversion attempt within its structural boundaries. Strategic levels feature SHORT ZONE (0.0669477 - 0.0672695 USDT), LONG ZONE (0.0602545 - 0.0605763 USDT), and TARGET ZONE (~0.064088 USDT).
Q/USDT also holds a clean structure (SHORT: 0.117822 - 0.118259 USDT | LONG: 0.10874 - 0.109176 USDT | TARGET:
post-image
AGT-41.10%
BTW-2.88%
  • 2
BTC selling pressure from near-peak buyers is easing
Over the past 30 days, approximately 205,400 BTC held for 6–12 months moved, but only 4.4% was sent to exchanges.
Notably, the proportion of BTC transferred to exchanges fell sharply from 40.4% in June to just 4.4% in October. This is a fairly positive signal, indicating that investors who bought near the 2025 peak are creating less selling pressure than before.
• 17/6: 40.4%
• 17/7: 30.9%
• 16/8: 9.8%
• 15/9: 3.7%
• 15/10: 4.4%
According to IT Tech, potential selling pressure has declined significantly. However, fewer sellers do not nec
post-image
BTC+0.87%
live market update
live-cover
LIVE2,038
#美国9月PPI大超预期
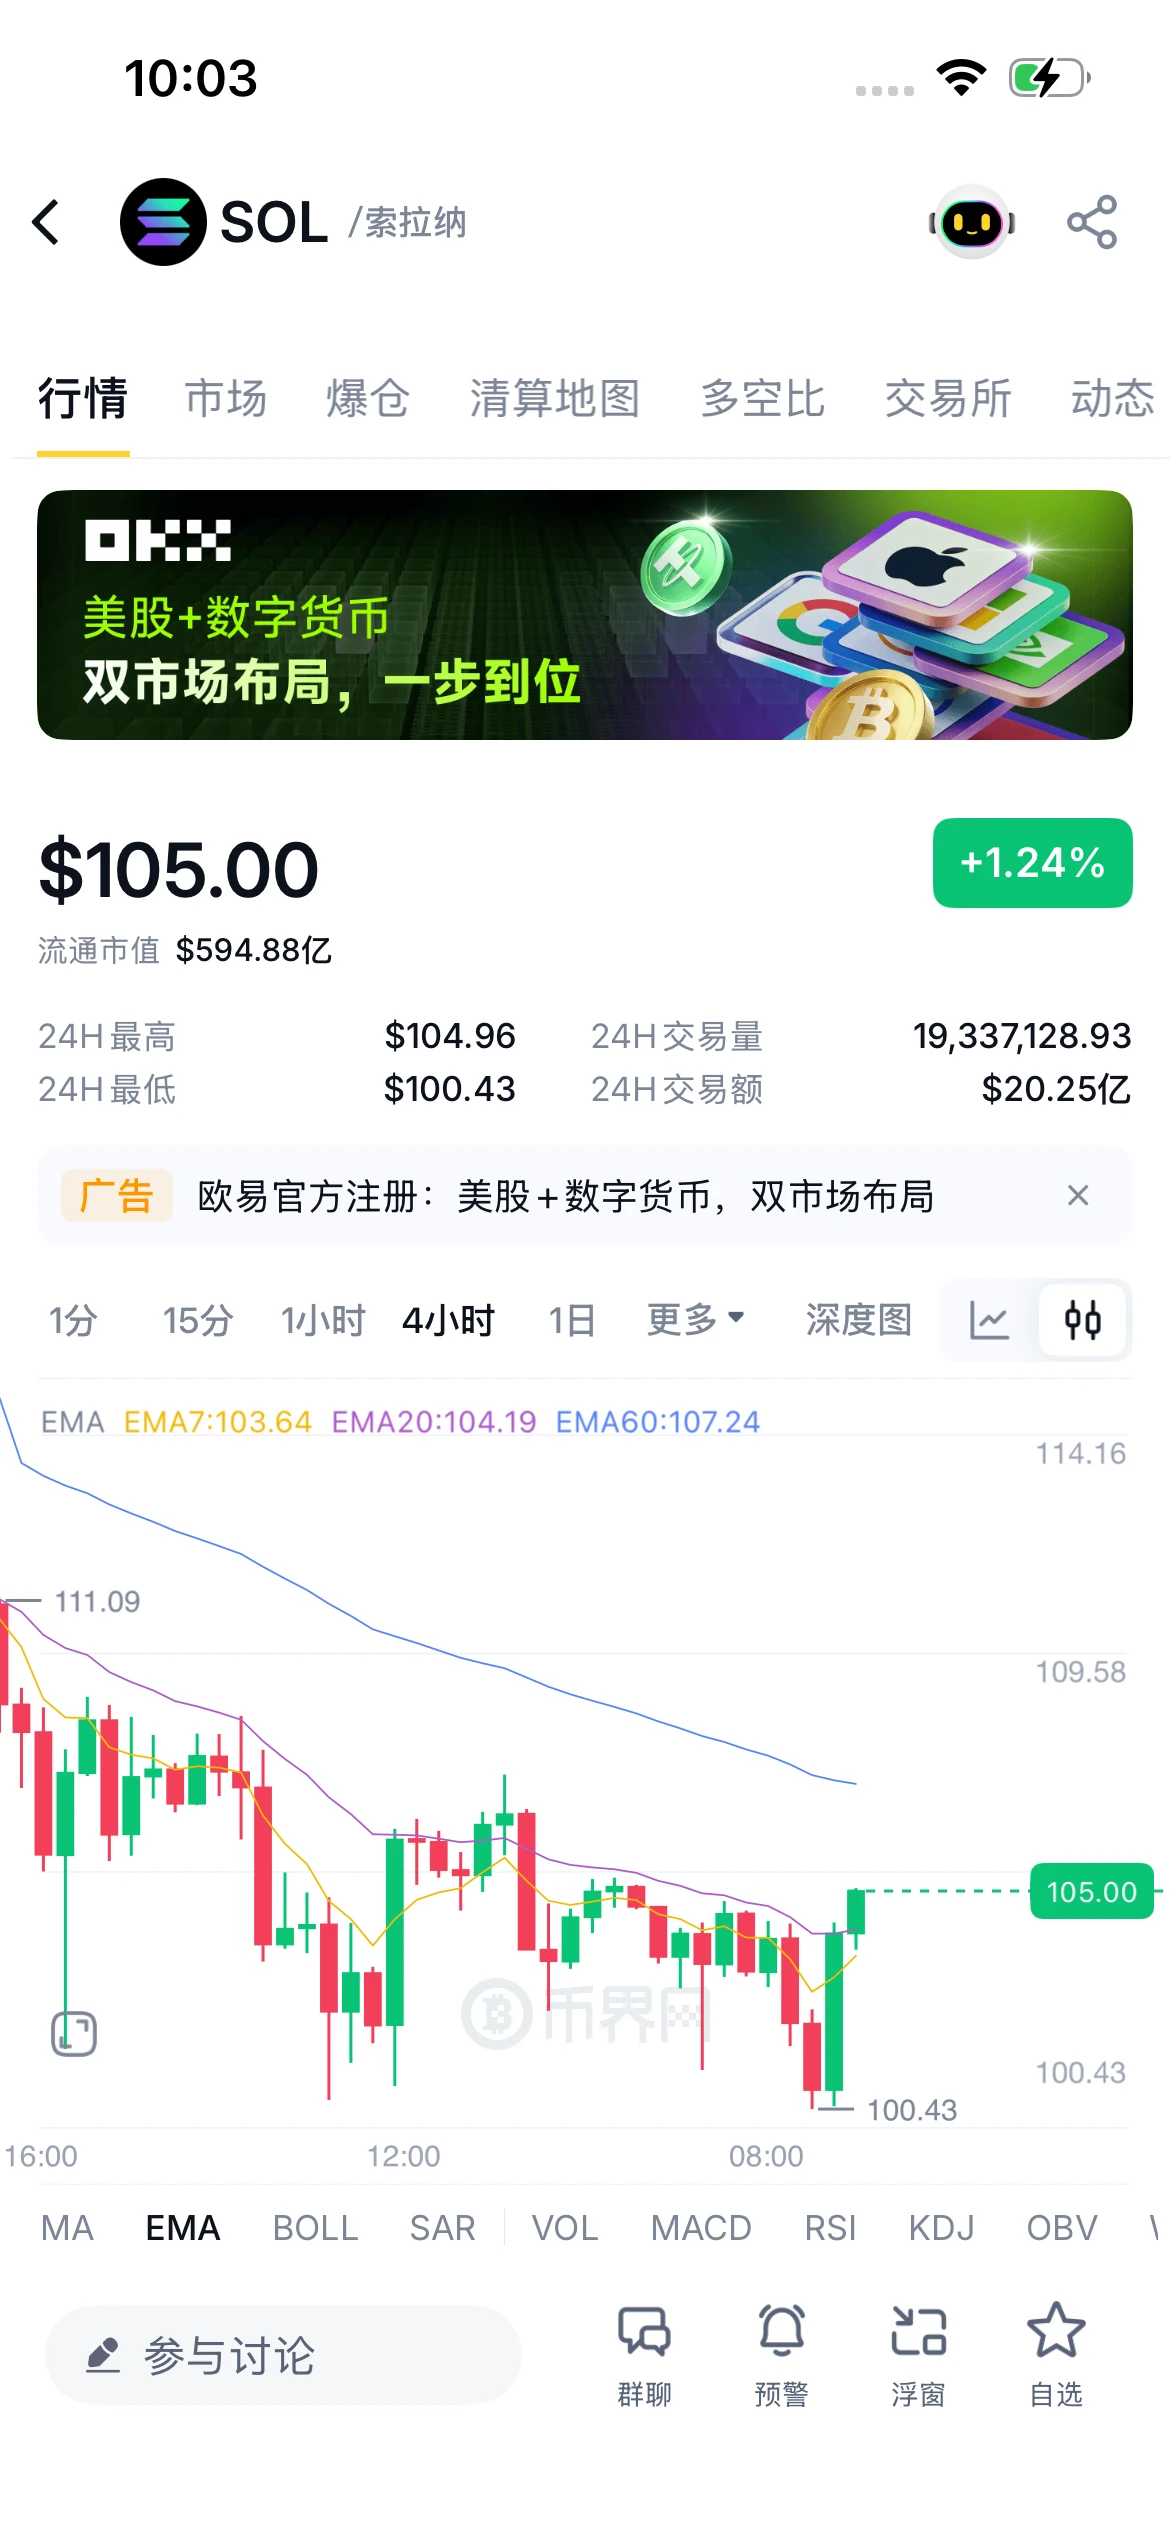
My SOL short at 117.23 is deeply in profit at the current price of 105.00; 107.24 will determine direction.
Market: On the 4H chart, SOL pulled back from 117.23, bounced after bottoming at 100.43, and is now at 105.00 (up 1.24% in 24h). It has moved above EMA7 (103.64), with EMA20 (104.19) close by and EMA60 (107.24) trending down. This is a weak rebound after the drop from 111 to 100; the bearish bias remains until price gets above EMA60.
P&L calculation: 117.23 - 105.00 = a 12.23-point price difference, with unrealized profit continuing to grow.
Key levels: Support at 100.43/10
post-image
SOL+1.38%
10.19 ETH intraday market
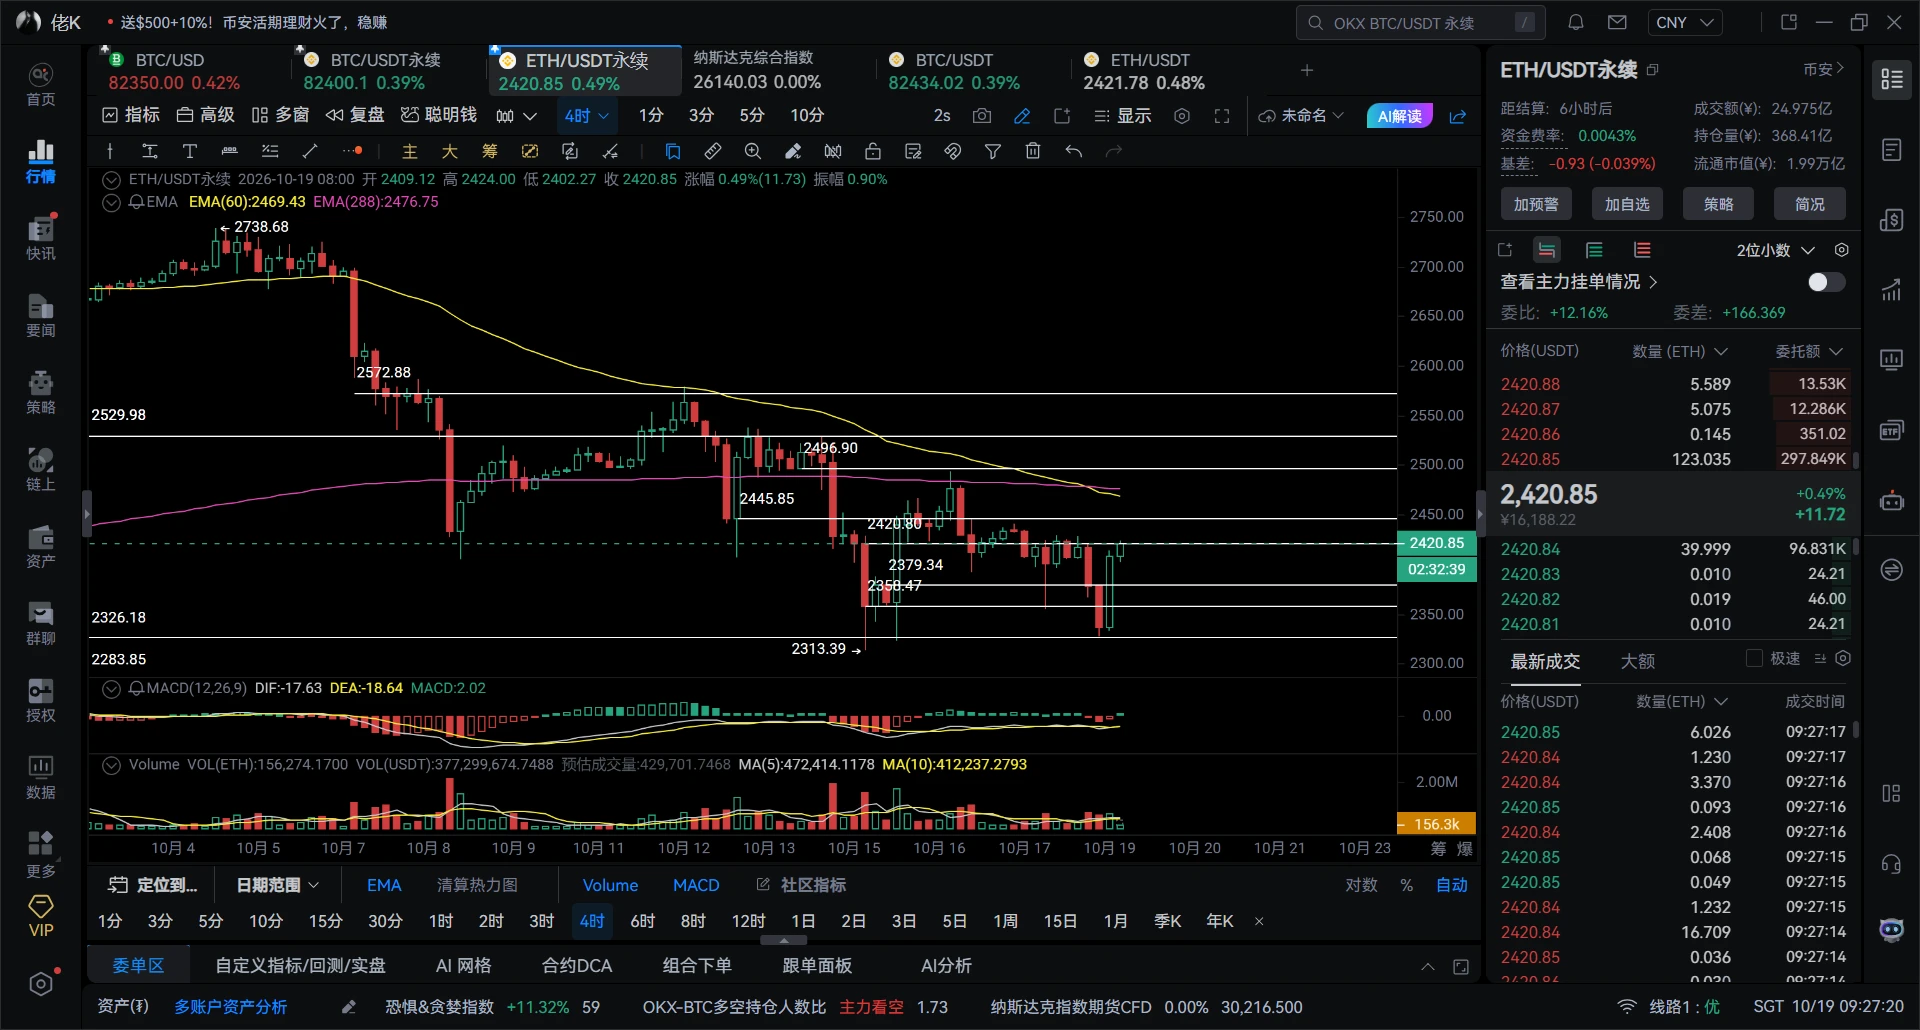
This ETH pullback is at the 2-day structural support level of 2326; the daily chart has fallen below the zero line
ETH's bottoming pattern looks much better than BTC's, with MACD golden pits on the 4/6/8-hour timeframes
A V-shaped rebound on the 15/30-minute timeframes; wait for an intraday pullback to go long
Support below: 2395 2367 2328
Resistance above: 2445 2474 2496 2528 $ETH
post-image
ETH+0.71%
Load More

Join 40 M users in our growing community

⚡️ Join 40 M users in the crypto craze discussion

💬 Engage with your favorite top creators

👍 See what interests you

Trending Topics

USSeptemberPPIBeatsExpectations

91.35k Views1.94k Discussing

US September PPI came in at 6.3% YoY, well above the 5.3% market expectation, pointing to renewed producer-side inflation pressure. Weekly jobless claims were 199K, broadly in line with forecasts. Could hotter inflation further reduce room for rate cuts, and what does it mean for $BTC, US stocks, and gold?

GateWCTCS9GlobalTradingCompetition

37.87k Views6.86k Discussing

GateBTCAndETHFuturesVolumeRanksTop3

53.8k Views1.97k Discussing

View More