
Square
Following
Hot
News
Notifications
Profile
Share your thoughts
placeholder
Article
Wow. 😍An upset? Man City actually lost to an obscure team? There was no action in the market over the weekend, so I tried a prediction. I actually got it right 😂 hahaha. Doubled my money. Faster than crypto 😂
$ON Short entry price: 0.1615 Take-profit 1: 0.1585 Take-profit 2: 0.1556 Stop-loss: 0.1663 ON is struggling to recover from the recent decline. Bears currently hold the more favorable position.
post-image
ON+4.77%
  • 1
Trenches
ZIG
Z
bade
b
ZIG
0x8c...1145
Market Cap
$.
Change
.
24h Vol
$.
Holders
.
BTC
B
bade
b
BTC
C5xp...pump
Market Cap
$.
Change
.
24h Vol
$.
Holders
.
José
J
bade
b
José
87CQ...1UJT
Market Cap
$.
Change
.
24h Vol
$.
Holders
.
STONK
S
bade
b
STONK
6GmA...UNgx
Market Cap
$.
Change
.
24h Vol
$.
Holders
.
IDOL
I
bade
b
IDOL
0x3b...ab07
Market Cap
$.
Change
.
24h Vol
$.
Holders
.
Everybody needs to understand this.
Way too many people care about always being right.
And that is not the game you should be trying to play.
A smart investor uses the data and probabilities to formulate a thesis.
But a thesis can ALWAYS be wrong.
You can never know for sure if your ideas will be correct, but, you have to take action and therefore, take risk.
So when we do that, we want to make the decisions that the data is telling us are the most likely.
For example, right now.
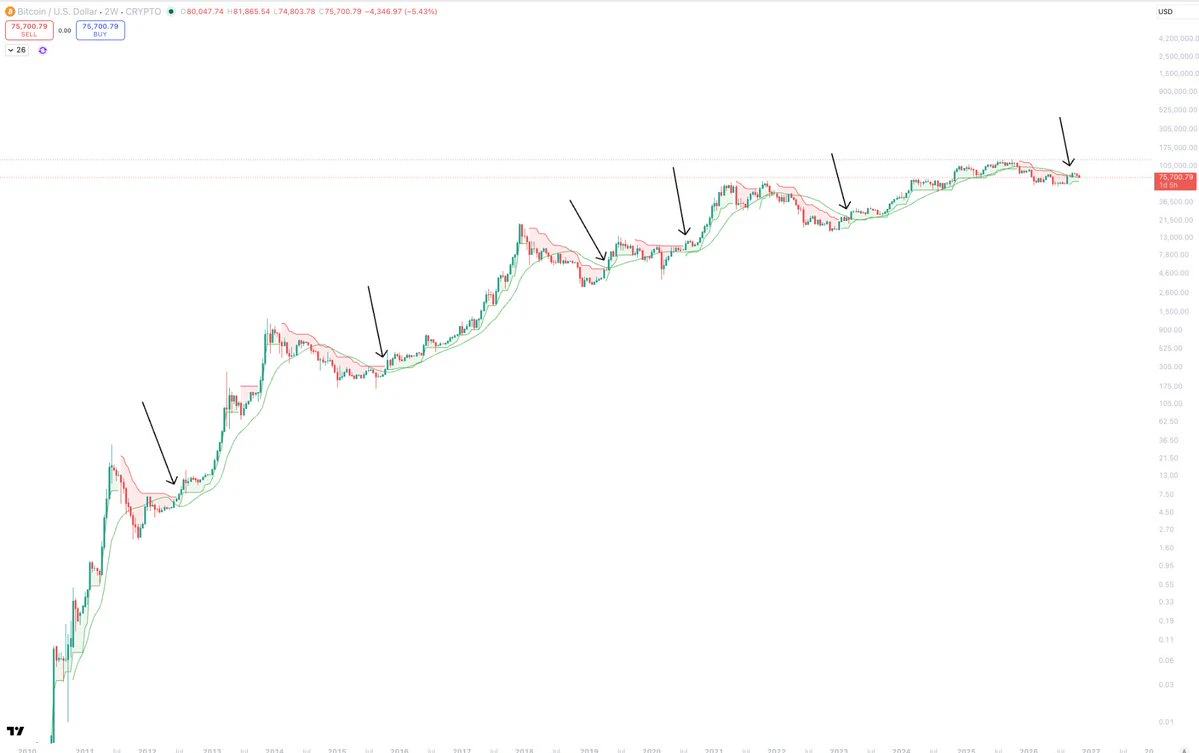
We have so many people flipping bearish or staying bearish at the end of 5 weeks of down, after bearish structure
post-image
BTC-0.67%
The Stellar Development Foundation says $5B in tokenized real-world assets are now live on Stellar.
CEO Denelle Dixon:
"$5B is a huge number, and it's just a pit stop."
@StellarOrg @DenelleDixon
XLM-0.64%
ESPORTS | Long 🟢 | Bullish | 15-minute, 24h: +6.04% | Volume: 46.5M USDT
Long rationale: Price above EMA200; EMA20/50/200 bullish alignment; RSI14 at 58.0; MACD histogram positive; ADX14 at 23.8; volume at 0.43x the 20-candle average; trend pullback/continuation.
Entry: 0.011007
Stop-loss: 0.0105583
Take-profit 1: 0.0115678 | Take-profit 2: 0.0119043 | Take-profit 3: 0.012353
Entry price is for reference only; do not chase highs. The strategy is invalidated if the stop-loss level is reached. Technical analysis only; this does not constitute investment advice.
$ESPORTS
post-image
ESPORTS-5.30%
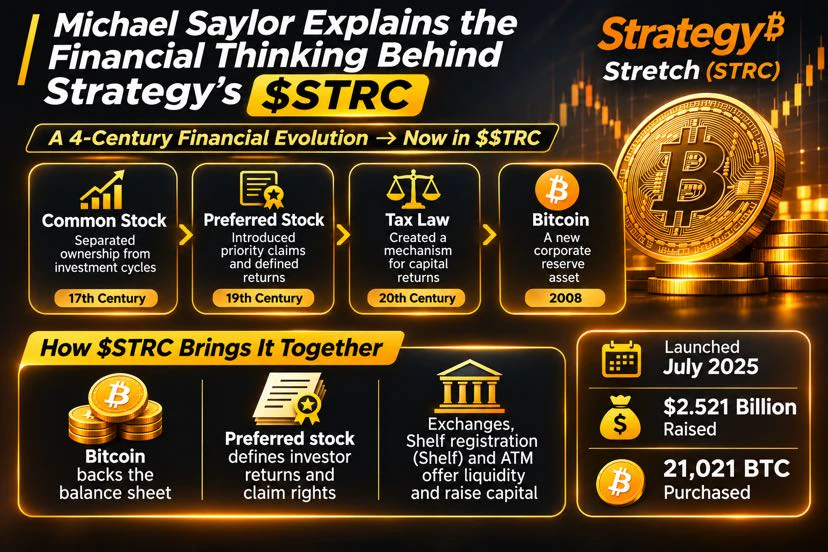
Michael Saylor Explains the Financial Thinking Behind Strategy’s $STRC

Michael Saylor is connecting four centuries of financial evolution to Strategy’s digital credit product, Stretch ($STRC).

His argument is that each stage introduced something new to financial markets:

* Common stock separated ownership from investment.
* Preferred stock introduced priority claims and defined returns.
* Tax rules created ways to structure capital returns.
* Bitcoin introduced a new type of corporate reserve asset.

STRC brings these ideas together.

Bitcoin supports Strategy’s balance sheet, preferred sto
post-image
STRC+0.34%
BTC-0.67%
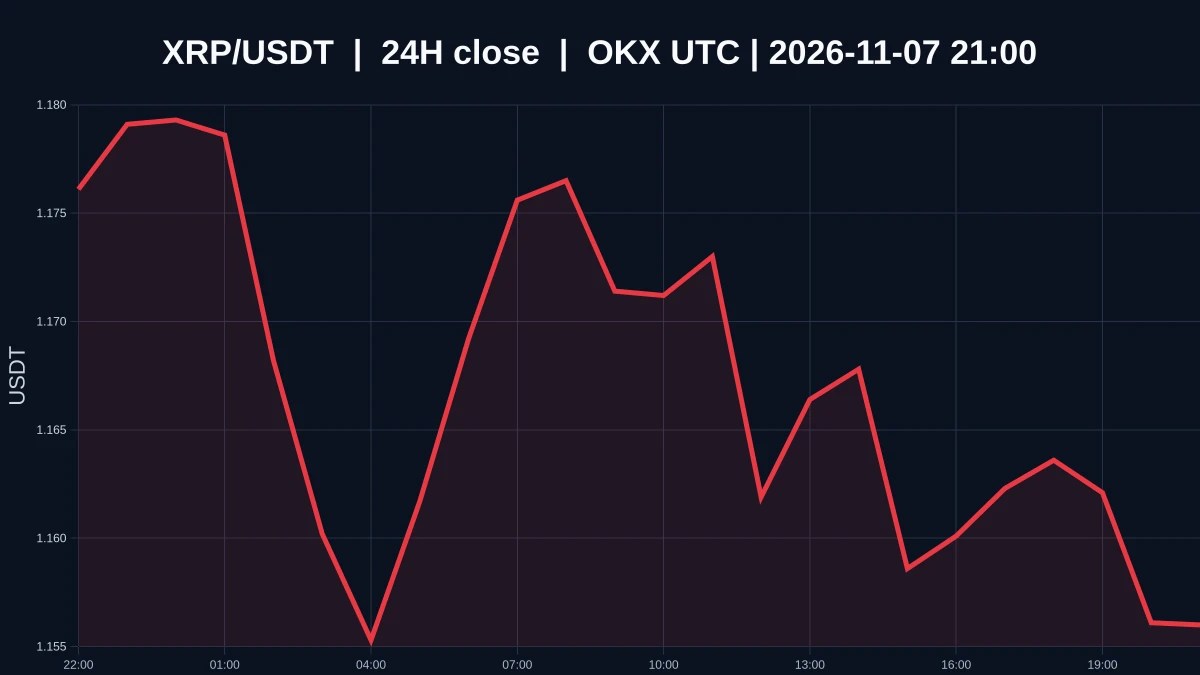
$XRP Is Weak on Low Volume at 1.1567. What’s Still Missing Between Oversold and a Bottom?
$XRP is currently priced at 1.1567, down about 1.44% over the past 24 hours, with an intraday low of 1.151 and high of 1.1853. The 1-hour and 4-hour trends are both weak, and the volume ratio is around 0.0429, indicating low market participation. Oversold describes a condition; a bottom is a confirmed outcome. A steep decline only shows that selling pressure has occurred. It does not automatically mean the price is cheap, much less prove that buyers are actually defending the area around 1.151. Demand for
post-image
XRP-1.15%
Gold 🥇
live-cover
LIVE598
$ACT It posted an 11.84% green candle over the past 24 hours, and the sentiment gauge flashed two extreme readings: the Fear & Greed Index surged to 78 (the upper end of the greed range), while the funding rate hit +0.035% (longs are paying, and positioning is crowded). How do these readings compare with historical levels? Over the past three months, ACT’s funding rate has risen above 0.03% only twice: once in early February, when it spiked to 0.0145 before pulling back 18% over two days, and once in mid-March, on the eve of a sideways stretch. The pattern is clear: once longs push the funding
ACT-1.76%
seems like there’s a new contender
post-image
World Liberty Financial's USD1 has 640,195 holders, more than 3.5 times the 181,039 holding PayPal's PYUSD.
USD1 also has 380,148 monthly active addresses, more than 3 times PYUSD's 115,565.
@worldlibertyfi
USD1+0.00%
PYUSD-0.09%
Liu Yifei was absolutely stunning back then, wasn’t she?
post-image
State Street, which manages more than $6.3 trillion, has grown its tokenized liquidity fund SWEEP 79.26% in the past 30 days to $284.13M.
More than $75.07M of it now sits on Stellar, where the fund held nothing 30 days ago.
@StateStreet @StellarOrg
XLM-0.64%
More and more people are waking up. I don't know if that's a good thing or a bad thing.
What do you mean, your social security is hitting you?
I don't even know how to respond to that 🙈
post-image
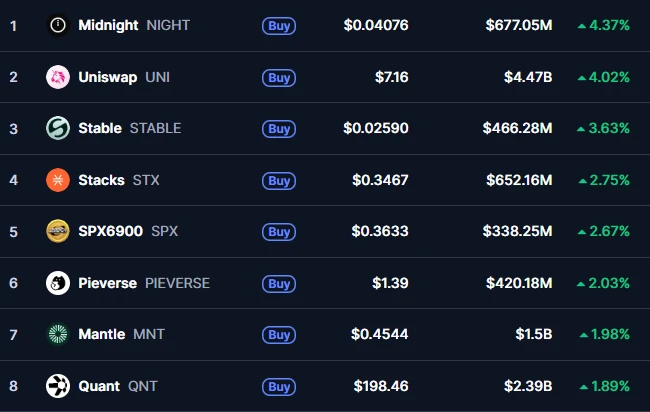
Midnight is the biggest gainer in the last 24hrs🤯
post-image
NIGHT-3.10%
MARKET PREDICTION
live-cover
LIVE89
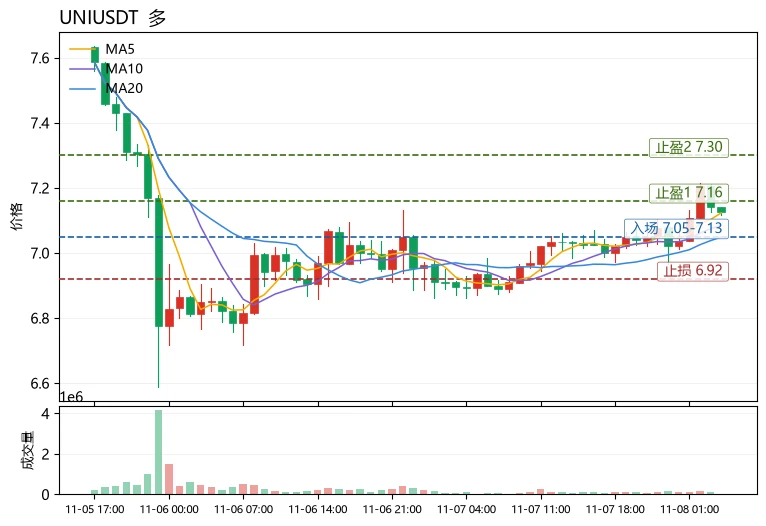
Many people go long as soon as the price moves above the moving averages, but overlook a key question: the “health” of the trend. Being above the moving averages does not mean the trend is healthy. Excessive price deviation from the moving averages, an overheated RSI, and an excessively positive funding rate are often signals of accumulating short-term risk. Take $UNI as an example: the current price is 7.125, MA5=7.1232 has crossed above MA20=7.0487, and the moving averages are in a bullish alignment—the first step toward establishing a trend. But to assess its health, look at two things: fi
post-image
UNI+3.05%
TRX+0.42%
MET-0.33%
The Nightmare of Every Trader!
post-image
  • 2
$TRX Short, sellers need to hold 0.320 on the 4H chart. Price is right below EMA50. I’d like to see a wick that spikes up and gets rejected, rather than price slowly breaking through it. That’s the whole idea. Quick read: - Price is 0.320 on the 4H chart, below EMA50 at 0.320; sellers still control the trend - 1H RSI is 68; the hourly timeframe is overheated - The daily price is below EMA200 at 0.326; the higher timeframe also supports this view. Short 0.3202–0.3204 Take profit 0.3199 / 0.3196 / 0.3192 Stop loss 0.3210 Not financial advice; do your own research.
post-image
TRX+0.42%
Load More

Join 40 M users in our growing community

⚡️ Join 40 M users in the crypto craze discussion

💬 Engage with your favorite top creators

👍 See what interests you

Trending Topics

USAIStocksHitHard

21.1k Views3.67k Discussing

U.S. stocks sold off sharply on Thursday, November 5 (UTC). The Nasdaq closed down around 5.5%, entering correction territory, while the Philadelphia Semiconductor Index plunged roughly 12%, with chip stocks including $NVDA and $AMD posting steep losses. Beyond profit-taking, investors are growing concerned about the pace of AI data center construction, capital spending, and future returns on investment. The key question now is whether the AI sector’s lofty growth expectations need to be repriced. Where do you think the next opportunities will emerge: chip stocks, tech giants, or other sectors?

USNonfarmPayrolls

34.91k Views4.34k Discussing

StakeOnLaunchpoolToShare450KVLX

9.91k Views828 Discussing

View More