Share your thoughts
placeholder
Article
I did nothing—just went to the bathroom, and when I came back, the candlestick had already done the work for me. When the market dumped early, I glanced at the volume: the rebound was weak, overhead resistance was obvious, and every push upward fell just short. This isn’t what strength looks like; it’s fuel for the shorts.

$ZEC $SOL
post-image
ZEC-0.80%
SOL+1.89%
Everyone’s staring at the 4H floor, but $HOME /USDT just armed a trapdoor at 0.00609—are you long enough to fall through it?

$HOME /USDT - SHORT

Trade Plan:
Entry: 0.00608 – 0.00610
SL: 0.00620
TP1: 0.00601
TP2: 0.00595
TP3: 0.00586

Why this setup?
Why now? The daily trend is already bearish, and this 4H signal is screaming SHORT with a 95% confidence score.
- RSI on the 15m is at 44.89—weak, no bounce fuel left.
- Entry zone 0.00608–0.00610 is a magnet; if we lose 0.00609, TP1 at 0.00601 is a formality.
- ATR (1h) is tight at 0.000047—the squeeze is primed for a sharp drop, not a
HOME+1.00%
$BTC made over 90 USDT in one day. Welcome to copy-trade, bosses! You’re also welcome to join the Zhongmeng community.
post-image
BTC+0.20%
That said, don't get greedy trying to catch the very last bit of the move. I'll take profit on 80% first to lock in the gains, and place a breakeven stop on the remaining 20%. If it keeps pumping, I'll let the profits run; if it pulls back, I won't let the gains turn into a loss.
$DOGE $ZEC
post-image
DOGE+7.05%
ZEC-0.80%
Everyone’s watching HYPE bleed—but the 4H chart just whispered a secret the crowd missed.

$HYPE /USDT - LONG

Trade Plan:
Entry: 85.409 – 85.721
SL: 84.072
TP1: 86.685
TP2: 87.431
TP3: 88.551

Why this setup?
Why now? The 1D trend is bullish, and the 4H MTF is *Armed* with 95% confidence. RSI on 15m sits at 58.18—not overheated, just warming up. ATR (1h) at 0.622 suggests volatility is coiled. Entry zone: 85.409–85.721. Targets: TP1 86.685, TP2 87.431. The invalidation line at 82.117 is your safety net. This isn’t a gamble—it’s a precision setup with a 2.4R to first target.

Debate:
If pr
HYPE+1.04%
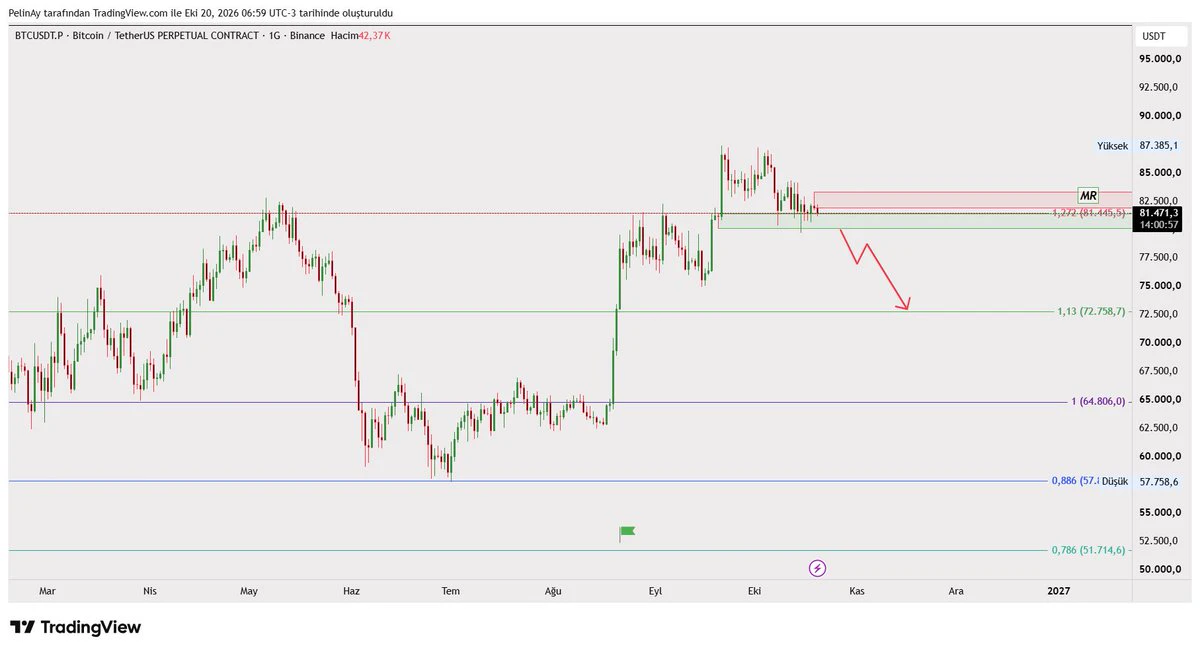
The essentials… Let’s talk about Bitcoin’s long-term cycle and some of my personal views, for reference only—not investment advice. These are merely records of historical reviews.
As seen in Chart [1], the price has formed a double-bottom pattern around a major level and a high-volume trading zone; based on the volume-price relationship, after a prolonged decline, two waves of panic-driven bottom testing have occurred. Following two waves of support and consolidation, the price broke through the bottoming region on August 17 with a high-volume bullish weekly candle, gaining nearly 26.5%. Judgi
$meme bottom ? 🤔
0x385f4f8ae47651ce5f58f5265395a669f8281e18
post-image
MEME+6.31%
Everyone’s staring at the wrong side of DOGE while the 4h chart whispers a trap.

$DOGE /USDT - SHORT

Trade Plan:
Entry: 0.09084 – 0.09122
SL: 0.09335
TP1: 0.08929
TP2: 0.08812
TP3: 0.08638

Why this setup?
Why now? RSI on the 15m is screaming at 72.87—overbought in a range. The primary signal says SHORT at 0.09103, targeting 0.08812, but the alt path flips long to 0.09327. With 77% confidence and a tight 0.000745 ATR, the market is coiling. This isn’t a breakout; it’s a liquidity grab waiting for late longs.

Debate:
If the daily is range-bound, do you fade this 4h pump to 0.09122 or rid
DOGE+7.05%
Jobs Data Is Now Behind the Market! Will Traders Shift Their Attention Toward CPI?
live-cover
LIVE587
CRYPTO MARKET UPDATE
live-cover
LIVE2,186
I only meant to snag a free breakfast, but the market ended up making dumplings out of me for half a year.
When $BE was grinding along around 200.9 intraday, it stayed flat long enough to nearly put me to sleep, but there was clearly buying support below and the low-volume selling couldn’t push it down. I judged that the bottom was solidified and entered a long position directly, without hesitation.
I just checked the chart, and the price has already surged to 265.1, +1537.65%. This bite of meat feels great—those already on board should have woken up laughing.
Take 80% off the table first, an
post-image
BE+6.98%
ZEC-0.80%
SNDK+3.19%
My hand trembled slightly when I set the stop-loss a few days ago, only to discover this morning that my filial devotion had been unnecessary.
When $BTC was bottoming out around 76872.9 this time, I already felt something was off: it could not fall any further, while every rebound repeatedly tested higher levels—a classic sign of funds quietly entering the market.
I watched the market for quite a while, and seeing someone steadily catch every pullback, I knew the direction was most likely heading upward.
I decisively went long, with the entry price landing right at 76872.9.
Hold as long as th
post-image
BTC+0.20%
ETH+0.91%
XRP+1.05%
Most traders will fade this 95% confidence LONG on NEAR — that’s exactly why it prints.

$NEAR /USDT - LONG

Trade Plan:
Entry: 2.2204 – 2.2448
SL: 2.1152
TP1: 2.3207
TP2: 2.3794
TP3: 2.4674

Why this setup?
- Daily trend is bullish, and 4h structure is armed for a breakout, not a breakdown.
- RSI 15m at 52.47 shows room to run—no overbought cliff yet.
- Entry zone 2.2204–2.2448 aligns with the 1h pivot (2.2326); TP1 at 2.3207 is a 4% scalp, TP2 at 2.3794 is the real meat.
- ATR 1h (0.0489) says volatility is expanding—waiting for a “better” entry means missing the move.
- Invalidat
NEAR+7.60%
Everyone’s chasing SOL longs at 103.79—but the 4h tape just whispered a different secret.

$SOL /USDT - SHORT

Trade Plan:
Entry: 103.61 – 103.97
SL: 105.50
TP1: 102.51
TP2: 101.65
TP3: 100.36

Why this setup?
Why now? The 1D is stuck in a range, not a breakout. RSI on the 15m is hot at 63.4, meaning the last push up is overbought on the low timeframe. ATR (0.71) shows quiet volatility—perfect for a liquidity sweep. Entry sits at 103.79 with TP1 at 102.51 and TP2 at 101.65. The invalid line at 102.34 is your canary: if we lose that, shorts get squeezed. But the math says downside is cleaner
SOL+1.89%
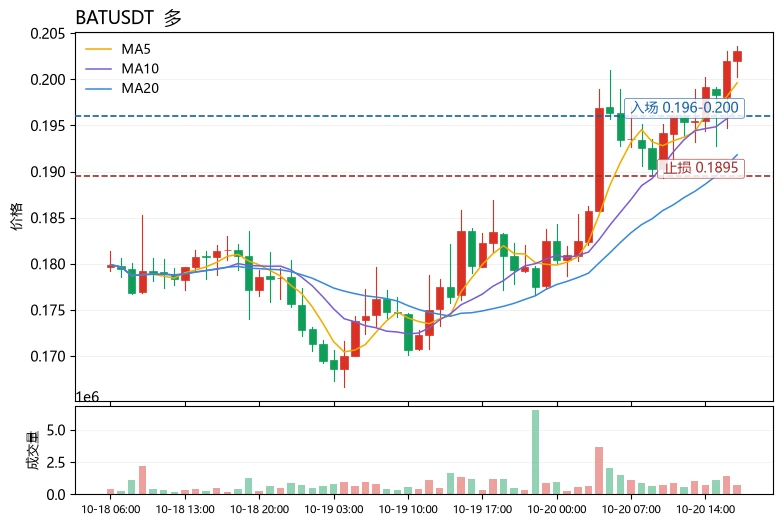
September 6 $BTC early-morning analysis
The 4-hour chart continues its range-bound recovery, up 0.78%, with net capital inflows of 143 million and buying funds continuing to return. The price has held above the Bollinger middle band at 79465.4, with solid support at the 78618 low below; large sell orders are placed in the order book, indicating clear overhead selling pressure. The Bollinger upper band at 82352.8 is strong mid-term resistance, while the lower band at 76578 serves as a key defense level. The market is experiencing a recovery rebound after the decline and has not yet entered a s
post-image
BTC+0.18%
ETH+0.92%
CHIPS: South Korean exports are accelerating as the global semiconductor boom continues.
Strong demand for memory chips and AI-related hardware is becoming a major driver for the country’s export growth, highlighting how the AI investment cycle is spreading through the global economy.
$NVDA $BTC
#Gate60MillionUsers
post-image
NVDA+0.87%
BTC-2.35%
  • 11
czs-dog:native ready to follow $4
Cz related BNB meme narrative
Same charts
Dont miss it like $4 will go huge just giving low like i gave #4 yesterday
post-image
4+44.56%
BNB+7.70%
MEME+6.31%
Most traders will fade this 95% confidence SHORT on $SKYAI /USDT—that’s exactly why you’ll win.

$SKYAI /USDT - SHORT

Trade Plan:
Entry: 0.05937 – 0.05999
SL: 0.06263
TP1: 0.05747
TP2: 0.05600
TP3: 0.05379

Why this setup?
- 4h MTF says SHORT, 1D trend is bearish—this isn’t a scalp, it’s a structural dump.
- RSI 15m at 51.85 is neutral, giving price room to drop without being oversold.
- Entry ref 0.05968, SL at 0.06263 (risk ~4.9%)—but TP1 at 0.05747 is a 3.7% move, TP3 at 0.05379 is a 9.8% drop.
- ATR 1h at 0.001228 means volatility is low—breakdowns here tend to be fast and violen
SKYAI+8.71%
Day 15. Today, I started leading trades with the smaller account. The smaller account made seven or eight tiny-position trades, with a 90% win rate and 20% profit, trading relatively conservatively. I can only comfort myself by saying that steady is fast, I guess. Leading trades really is different—every trade requires careful consideration. When the direction is right, everything is fine, but once there is a loss, I start calculating how much the followers will lose. Leading trades and trading on my own are truly very different. This will be another challenge: victory only, no defeat!!!
100U
ETH+0.91%
BTC+0.20%
Everyone’s chasing BNB’s green candle—but the 4h clock just struck midnight for bulls.

BNB/USDT - SHORT

Trade Plan:
Entry: 776.1 – 779.7
SL: 800.0
TP1: 761.3
TP2: 750.3
TP3: 733.8

Why this setup?
- RSI on the 15m is screaming at 73.61—overbought before the daily range even wakes up.
- Price is pinned at 777.9, but the 1D trend is “range,” not rocket fuel.
- ATR (1h) at 7.07 means the next 4h move could slice 30 points off your long.
- Why now? The 77.4 confidence SHORT is waiting at the exact resistance—this is the “sell the news” window, not the “buy the dip” one.

Debate:
Are we
BNB+7.67%
Load More

Join 40 M users in our growing community

⚡️ Join 40 M users in the crypto craze discussion

💬 Engage with your favorite top creators

👍 See what interests you

View More