Square
Following
Hot
News
Profile
Share your thoughts
placeholder
Article
No one here understands nuance
post-image
From NY to California.
It's been great travelling.
Trenches
AGT
A
bade
b
AGT
0x5d...e274
Market Cap
$.
Change
.
24h Vol
$.
Holders
.
CNPY
C
bade
b
CNPY
0xc6...ddd2
Market Cap
$.
Change
.
24h Vol
$.
Holders
.
TSI
T
bade
b
TSI
0xa8...1c1e
Market Cap
$.
Change
.
24h Vol
$.
Holders
.
Gato
G
bade
b
Gato
55A3...pump
Market Cap
$.
Change
.
24h Vol
$.
Holders
.
hi
h
bade
b
hi
0x8a...a7f7
Market Cap
$.
Change
.
24h Vol
$.
Holders
.
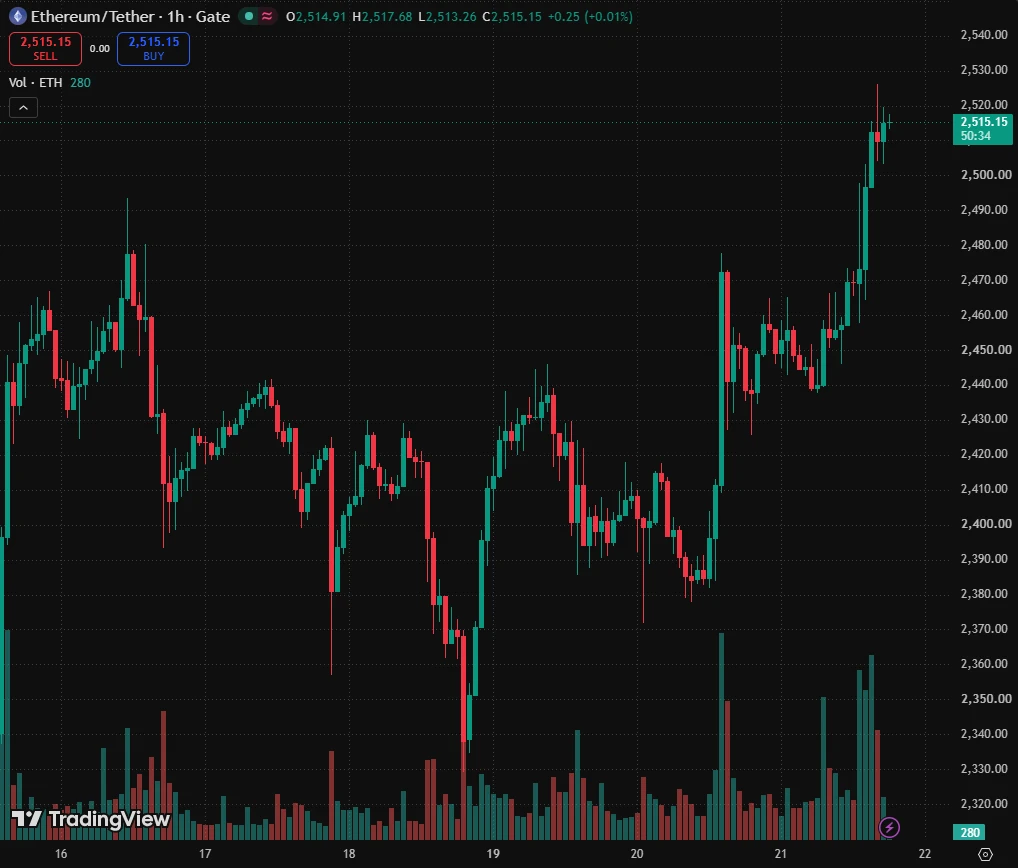
ETH is down now, and the outlook for ETH before 8:00 tomorrow morning is:
Overall bearish, showing weak consolidation amid “macro tightening + ETF outflows + technical pressure.” However, the price is already near the lower Bollinger Band and a key support zone, increasing the risk of chasing short positions in the near term. It is more likely to face pressure and test support first; if support holds, a technical rebound may follow. Bearish, but chasing shorts directly is not recommended. $NVDA #GateWCTCS9全球交易赛
NVDA-1.42%
#aidoge I’ve already launched my infinite grid bot on aidoge
post-image
AIDOGE-6.84%
#DOGE #WCTCS9 DOGE Under Pressure! Institutional Funds Flee, Retail Investors Can’t Prop Up the Market
Dogecoin (DOGE), the meme coin pioneer ranked 11th by market cap, is under intense pressure, currently trading at $0.0806, down 2.3% over 24 hours. The decline has significantly underperformed the broader market: Bitcoin is down just 0.83%, and the total crypto market cap has fallen 0.9%, putting DOGE’s losses at 2.5 times the market average.
Major institutional redemptions, trading volume nearly halved📉
Data shows that DOGE investment products recorded net outflows of $29.69 million in a si
DOGE-1.66%
  • 11
  • 1
Crypto Market Activity Improves as Buyers Return to Major Trading Pairs
live-cover
LIVE1,407
Many people use “it’s fallen this much, so it should rebound” as a reason to enter, confusing price with valuation. $WLD Current price is 0.4749, down 3.69% over 24h, and is now hugging the lower Bollinger Band at 0.47455. MA5 at 0.48226 is below MA20 at 0.49042, the MACD histogram at -0.001514 remains bearish, and the 30-candle range is about 10.63%, indicating volatility is not low. RSI at 35.2 is merely weak, not an oversold reversal signal. The funding rate of -0.0089% indicates crowded shorts and the possibility of a short squeeze, but that is a trading structure, not a trend.
My bias is
post-image
ENA-1.95%
Retail investor: Nasdaq $Q just had its worst week since June. You buying the dip?
Me: Not every dip is a buy
Retail investor: wait what? I thought you were the "stay invested guy"
Me: I am. I’m not selling anything. But “should I throw a bunch of NEW money at it” is a different question
Retail investor: ok so is it a buy
Me: My stock sheet has $Q & $VOO about 5% above fair value right now. Even after this week.
Retail investor: so it’s still expensive??
Me: A little. The market ran hot & now it’s pulling back. It’s closer to fair, not a fire sale
Retail investor: so what do you do
Me: Keep bu
post-image
NDAQ+0.51%
VOO-1.11%
When there’s no reliable project to work on, I just play around with AI.
Making generative videos is pretty fun. Any experts willing to show me the ropes?
Right now I have GPT + a local 5070 Ti 16 GB graphics card.
I want to use this setup to experiment, so I installed ComfyUI.
Then GPT didn’t directly call the software—it simply recognized the model I had downloaded locally and ran it.
What’s your approach? Let’s exchange ideas~
#WCTCS9 #每周来晒 Gold posted a recovery move this week, falling first and then rising. At the start of the week, it was hit by bearish CPI data, with prices plunging to a swing low of 4073, a recent low. Oversold buyers then entered the market in succession to provide support, driving gold to rebound in choppy trading. It is currently trading around 4163, with overall sideways consolidation in a low range.
After CPI came in above expectations, market expectations for a Fed rate cut in October cooled sharply, with bets even beginning to shift toward a further delay in the timing of rate cuts. Aft
post-image
XAU-0.14%
XAUUSD-0.12%
USIDX-0.18%
ETH-1.37%
BTC at 81k, ETH at 2,375; ETH's drop is more than three times BTC's
BTC fell just 0.44% over 24 hours, while ETH dropped 1.55%—a difference of more than 3x. This divergence is more worth watching than the absolute prices.
📊 First, a Gate spot snapshot (October 18, 15:47 UTC):
BTC was trading at 81,074.7 USDT, with a 24-hour high of 82,285.8, a low of 80,817, and a trading volume of about 380 million USDT.
ETH was trading at 2,375.76 USDT, with a 24-hour high of 2,430, a low of 2,356.97, and a trading volume of about 149 million USDT.
Both coins are down, but ETH has fallen nearly 2.2% from it
post-image
BTC-0.08%
ETH-1.37%
$TRUMP So many people are going long
If they don't liquidate you all,
how could they pump the price?😂
post-image
TRUMP-4.38%
hedera-hashgraph:native: IS A 1,000%+ RALLY ABOUT TO BEGIN?
#HBAR Has Already Delivered 105% From Our Accumulation Zone.
Now, Watching For A Re-Entry Before The Next Potential Expansion.
Re-Entry Zone: $0.08–$0.07
Targets: $0.30 / $0.60 / $1.00
Hedera Could Be Preparing For Its Next Major Bullish Move.
NFA & DYOR.
@hedera
post-image
HBAR+4.55%
A nine-company Quantum Alliance estimates 6.4 million bitcoin, 30.2% of supply, sit in addresses whose public keys are already exposed. About 1.1 million of those coins are attributed to Satoshi Nakamoto.
BTC-0.08%
The 2-year Treasury is at an interesting level. An actual rate hike might not even push yields higher. The front end has already priced in a lot of tightening, and the spread is nearing 90 bps. Another 25 bps might not even be enough to budge yields. When liquidity is thinnest in the early hours, that’s when you’re most likely to see a wick—and the bond market is no different. What does the curve look like on your end?
post-image
#WCTCS9 #每周来晒
Machi's $4.3M 25x ETH long: the math behind the headline
The news is dramatic, but the useful part is the numbers. Here is what is reported, what the position implies, and what it teaches about leverage.
The timeline
On October 15, Machi Big Brother's Hyperliquid account was fully liquidated, falling from a $12.25 million peak to $21,800 after heavy Ethereum longs. Four ETH liquidations hit within about three minutes, ranging from 380 ETH at $2,379 to 800 ETH at $2,331. Then about 25 minutes later he opened a new 25x ETH long of 290 ETH with a liquidation price of $2,324.
On Oct
post-image
ETH-1.25%
HYPE-1.28%
USDC-0.02%
ETH-1.25%
The rate decision is about 10 days away. The Fed’s blackout period has begun—officials are staying silent, so the market can only guess.
There aren’t many key events: China’s Q3 GDP tomorrow (October 19), then straight to October 28–29 for the decision and press conference. Don’t expect to hear anything new from officials in between.
BTC is currently around 81.2k, down about 0.5% over 24 hours; ETH is around 2,380, down about 1.8%. This kind of grind during the blackout period is pretty common.
The hexagram drawn this time is Dun (Retreat): Heaven above the Mountain, the noble person withdraws
post-image
BTC-0.08%
ETH-1.37%
Gold Prices Rise as Investors Reassess Currency Strength and Inflation Trends
live-cover
LIVE325
Good afternoon fam!
Touching grass today.
Enjoy your Sunday ❤️
post-image
Load More

Join 40 M users in our growing community

⚡️ Join 40 M users in the crypto craze discussion

💬 Engage with your favorite top creators

👍 See what interests you

Trending Topics

USSeptemberPPIBeatsExpectations

91.35k Views1.93k Discussing

US September PPI came in at 6.3% YoY, well above the 5.3% market expectation, pointing to renewed producer-side inflation pressure. Weekly jobless claims were 199K, broadly in line with forecasts. Could hotter inflation further reduce room for rate cuts, and what does it mean for $BTC, US stocks, and gold?

GateWCTCS9GlobalTradingCompetition

37.87k Views6.81k Discussing

GateBTCAndETHFuturesVolumeRanksTop3

53.8k Views1.92k Discussing

View More