Square
Following
Hot
News
Profile
Share your thoughts
placeholder
Article
Gm everyone ☀️
post-image
Wow 😮 everyone is getting instantly rich 🤑 from this coin solana:DFMt2FyLpB6ekPNAzVErLXgpSnJ9CRf1VnxBAkTLpump
Probably backed by @elonmusk
Gaurantee to make you rich 🤑 100%
Nobody loses it goes up forever ♾️
DFMt2FyLpB6ekPNAzVErLXgpSnJ9CRf1VnxBAkTLpump
post-image
SOL+1.25%
BTC UPDATE
live-cover
LIVE50
Layout: Bitcoin, Ethereum, Dogecoin
live-cover
LIVE880
  • 4
I can't be the only one 😭
post-image
$merge bottomed . These micro caps always have these random pumps especially if there are hodlers & bots 🤖 see
AGq9Y4TnfkSiP1JTE6ndfAz7nAqTY9NC3qaPuW9Ppump
#crypto
post-image
CAPS-4.00%
Insiders are quietly stacking shorts on BTW while the 1h ATR screams volatility.

$BTW /USDT - SHORT

Trade Plan:
Entry: 1.875069 – 1.928019
SL: 2.155704
TP1: 1.710924
TP2: 1.583844
TP3: 1.393224

Why this setup?
Why now? The daily trend is range-bound, which favors mean reversion and gives the short bias a structural edge. The 15m RSI sits at 49.09, hovering just below neutral and signaling that momentum is not yet oversold enough to invalidate a pullback. The 1h ATR of 0.1059 confirms that the asset is in a high-volatility phase, making the entry zone between 1.875069 and 1.928019 a preci
BTW-20.20%
Who is truly leading the gains in the same sector? The answer points to $INJ
.
A horizontal comparison makes it clear: $INJ rose 10.92% over 24h, with a trading volume of 24.0M USDT, while $JTO fell 3.94% and $DOGE barely moved (-0.28%) over the same period. All three have an MA5 crossing above MA20, but only $INJ ’s RSI surged to 71.2, with the MACD histogram expanding significantly to +0.136. Its price of 8.379 is already approaching the Bollinger upper band at 8.618, and its 30-candle amplitude of 17.89% shows far greater volatility elasticity than the other two. The funding rate of +0.0
post-image
INJ+11.34%
JTO-2.75%
DOGE-0.24%
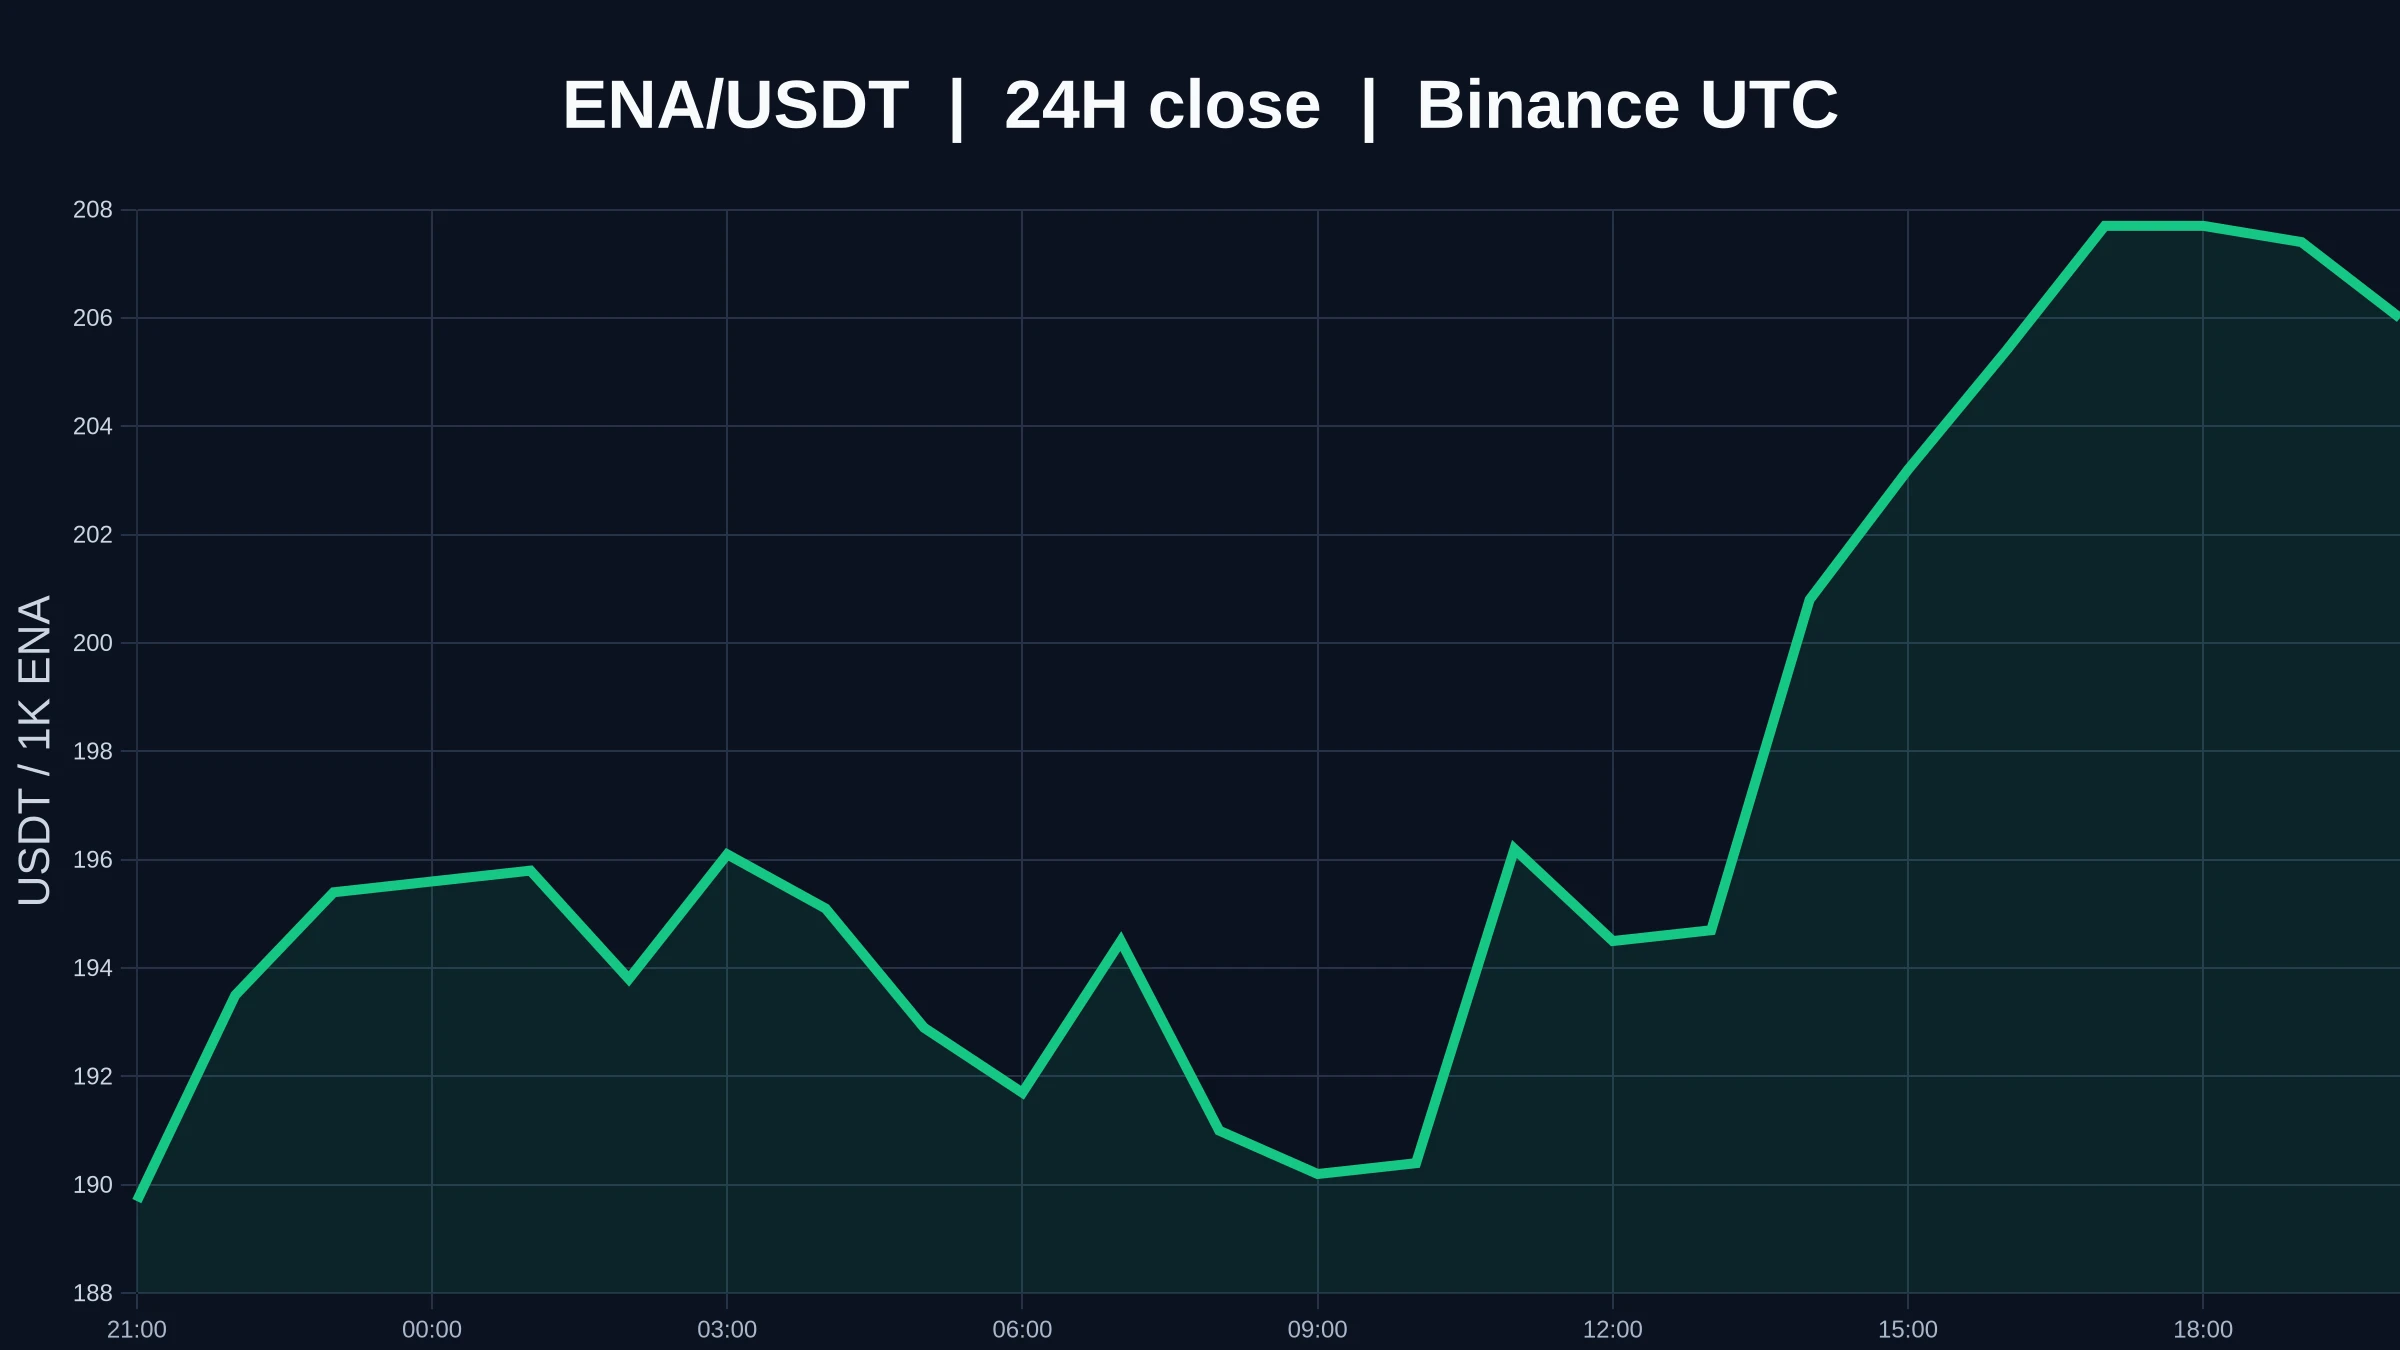
$ENA Right now it feels like a multiple-choice question with no standard answer, but the answer will not be hidden in emotions.
First, let’s copy the full question: $ENA is currently at 0.2051, up 4.32% over 24 hours. The 1-hour support is 0.1825, resistance is 0.2069, and current volume is 0.43 times the average volume of the past 20 candles. The 1-hour trend is strong, with RSI at 80; the 4-hour trend is strong, with RSI at 46.
The angle I’m watching is that $ENA remains strong, while the crowded positioning is already on the table. I acknowledge that the trend is strong, but what matters ne
post-image
ENA+4.48%
10.16 $SNDK The strategy has once again reached everyone’s favorite moment: the “three storage clowns.” First, SanDisk’s decline is not over yet; it’s just that the short positions exited early, while long positions still have to withstand further downward pressure. We previously discussed one logic,
namely, the three underlying elements for training small and large AI models: 1. Computing power: continuously allowing small and large AI models to iterate and upgrade step by step; 2. Electricity: demand for computing power continues to rise, and stable power supply is the foundation, with typic
post-image
SNDK-0.56%
all my goats at the top of the lb
post-image
we crushed the PPI news 📊
“Black Monday” for the storage sector—Micron falls below $1,000: What exactly happened?
On October 13, the U.S. storage sector experienced a textbook-style mass sell-off. Micron Technology closed down 3.88%, falling below the $1,000 per-share mark to close at $989.04, nearly 20% below its June record closing high and nearing technical bear market territory. SanDisk fell 5.97%, Western Digital dropped more than 6%, Seagate Technology fell 6.97%, and SK Hynix’s U.S. shares declined more than 5%. The Philadelphia Semiconductor Index closed down 2.67% at 12,236.79 points.‌
Seagate and Western Dig
SNDK-0.56%
With the same 1,000U, some people doubled their money on $STRK last night, while others rushed in at today’s open and got trapped at the top. Which outcome would you choose?
Let’s look at the data first. $STRK is currently at 0.0881, up 14.3% in 24 hours, with a high of 0.0988, a low of 0.0717, and $465 million in trading volume. What does that mean? An intraday range of 38%, with trading volume several times the circulating market cap. This isn’t an ordinary rally—it’s a meat grinder for bulls and bears.
Bullish logic: STRK’s current move started around 0.07, with genuine volume coming in rat
STRK+13.53%
$ZEC The altcoin king is a money printer—stay steady, hold spot through the bull market. It feels incredible
ZEC+9.33%
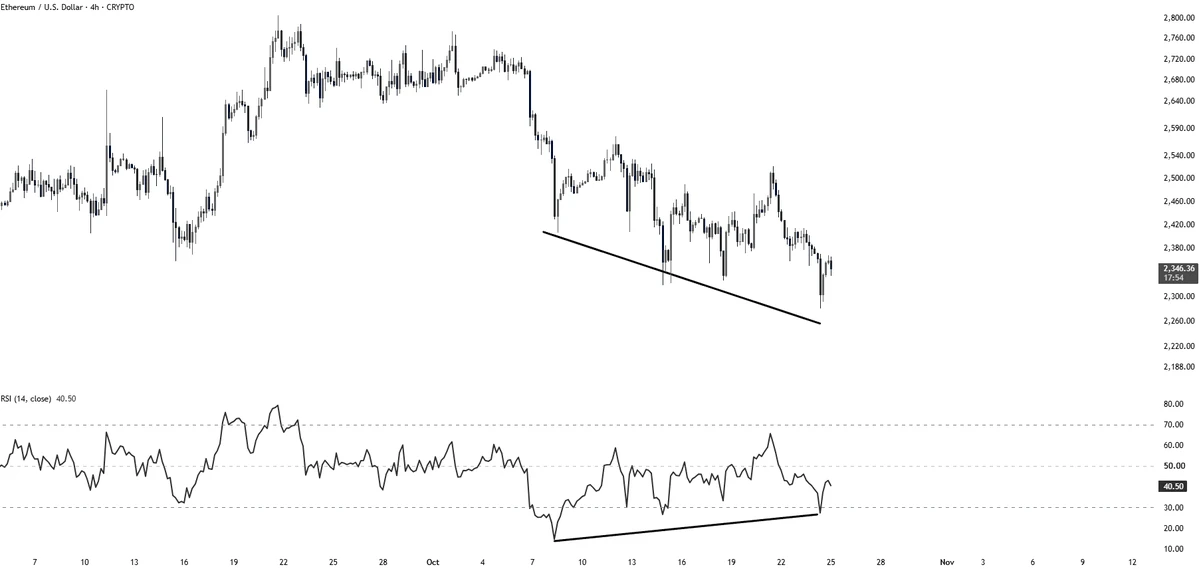
On October 16 $ETH , the ETH strategy is actually very similar to the BTC view; both are headed in the same direction, as discussed during the livestream.
Currently, 2545 is the resistance level. After the decline from the October 7 starting point, there was a natural rebound high when the price fell to 2545. This high, 2586, is tentatively set as an anchor point. From the price action, 2545 was broken and reclaimed twice. The second time, the price did not touch the area above 2545, so we will enter short in the area of selling pressure here, taking shorts in the 2500–2530 range.
The hard sto
post-image
ETH+1.90%
  • 2
$INJ continues to rise strongly
Buy at 8.30–8.05; targets 8.56, 8.72, 8.90; stop-loss 7.85
post-image
INJ+11.20%
$CORE Everyone, do you think it will reach 2u?
post-image
CORE+0.24%
10.16 Gold $XAU Recent Strategy Gold has been moving sideways within this range since falling at the end of September, with 4220 on the upside and 4110 on the downside. We have gradually sold high and bought low several times here.
Here is what we are doing now: 1. Short-term strategy: go long at 4100, exit around 4200, with a hard stop-loss at 4020. 2. After playing a few short-term rounds, switch to a long-term position (you can choose PXAG due to the high weekend fees). The unchanged point for both long-term and short-term trades is going long at 4100 with a stop-loss at 4020; the only dif
post-image
XAU+1.52%
  • 3
$BTW Long plan: 4-hour chart support at 1.908–1.925
Buyers must hold this area to maintain dominance. I will watch whether they can defend it here and avoid chasing the price. Why focus on this level: - The 4-hour price is 1.92, above the EMA50 at 1.81, favoring buyers - The stop-loss risk is 6.4%, while the potential TP3 gain is 10.3%, giving a favorable risk-reward ratio - BTC's short-term trend is bullish, providing support🟢 Long · Entry 1.908–1.925 · Take profit 1.990 / 2.039 / 2.113 · Stop loss 1.794
Not investment advice · Do your own research
post-image
BTW-20.28%
BTC+0.94%
Load More

Join 40 M users in our growing community

⚡️ Join 40 M users in the crypto craze discussion

💬 Engage with your favorite top creators

👍 See what interests you

Trending Topics

USSeptemberPPIBeatsExpectations

91.35k Views1.88k Discussing

US September PPI came in at 6.3% YoY, well above the 5.3% market expectation, pointing to renewed producer-side inflation pressure. Weekly jobless claims were 199K, broadly in line with forecasts. Could hotter inflation further reduce room for rate cuts, and what does it mean for $BTC, US stocks, and gold?

DrLinHanSpeaksAtOxfordUnion

135.63k Views1.86k Discussing

JapanAndKoreaStocksPlunge

47.27k Views1.76k Discussing

View More