Square
Following
Hot
News
Profile
Share your thoughts
placeholder
Article
[New Streamer] Market Prediction
live-cover
LIVE2,140
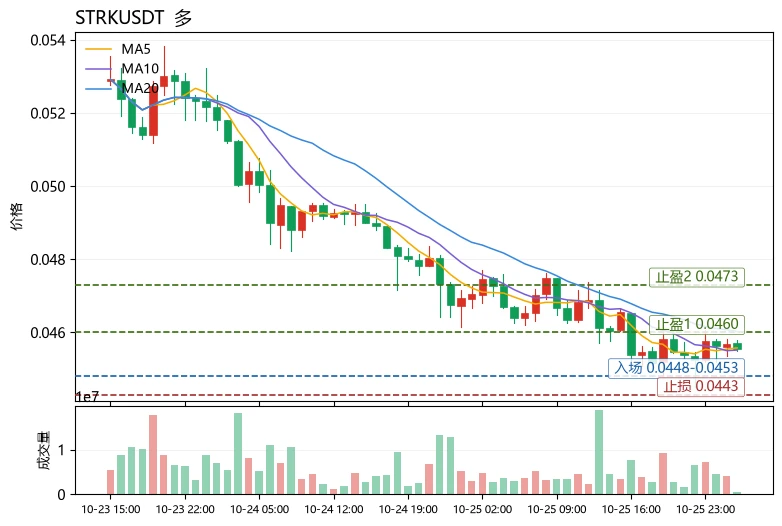
When the moving averages have not formed a bullish crossover, should you buy the pullback? The answer is yes, but only if the pullback leaves the structure intact—use moving averages to determine direction, RSI to determine position, and MACD to determine momentum; all three are essential. Take $STRK
as an example: the current price is 0.04554, and MA5 is below MA20, indicating that the short-term trend has not yet recovered. However, the price is still above the Bollinger lower band at 0.0447048, and the MACD histogram is positive, so momentum has not turned bearish. This is a “trend awaitin
post-image
HYPE+1.83%
Trenches
STONK
S
bade
b
STONK
6GmA...UNgx
Market Cap
$.
Change
.
24h Vol
$.
Holders
.
BTC
B
bade
b
BTC
C5xp...pump
Market Cap
$.
Change
.
24h Vol
$.
Holders
.
CNPY
C
bade
b
CNPY
0xc6...ddd2
Market Cap
$.
Change
.
24h Vol
$.
Holders
.
ZIG
Z
bade
b
ZIG
0x8c...1145
Market Cap
$.
Change
.
24h Vol
$.
Holders
.
Q
Q
bade
b
Q
0xc0...0589
Market Cap
$.
Change
.
24h Vol
$.
Holders
.
Hello everyone!
The coming week is set to be incredibly intense for the markets. A series of critical developments—including back-to-back interest rate decisions from three major central banks, U.S. inflation and growth data, a massive Bitcoin options expiry, and the shutdown of the Blast network—are all converging in the same week. Let’s take a calm, clear-eyed look at this calendar from the perspective of an individual investor.
The Week’s Focal Point: The Fed Decision and Kevin Warsh’s Signals (Wednesday, October 28)
Wednesday is undoubtedly the most critical day of the week. Following the
post-image
BTC+0.38%
NAS100+0.30%
USDJPY+0.04%
XAUUSD-0.71%
  • 1
  • 1
I declare that GPT is the AI that understands me best.
post-image
Five words are worth more than a thousand words.
post-image
$HYPE This market action has really shown just how absurd the market is.
I looked into the fundamentals: the U.S.-listed PURR project announced a $100 million buyback plan, but it is buying its own Nasdaq-listed shares, which have absolutely nothing to do with the HYPE tokens circulating on-chain.
The ridiculous part is that a bunch of people took this news as a lifeline for the token and rushed in to become exit liquidity.
Now that the positive news has landed, it has barely made a ripple. The area around $80 is packed with tokens held by people trapped after chasing the highs, and the bears
post-image
HYPE+1.83%
PURR+0.92%
#Gate广场万圣节
BTC Technical Outlook Heading into Halloween
As the calendar approaches Halloween, the BTC/USDT market is presenting a specific technical structure characterized by consolidation and downward pressure across multiple timeframes.
Macroeconomic Context
Current market sentiment is being influenced by broader economic indicators. Notably, elevated oil prices continue to drive inflation concerns. Persistent inflation typically leads to expectations of sustained higher interest rates, which generally exerts downward pressure on risk assets, including Bitcoin. This macroeconomic backdrop
post-image
BTC+0.38%
The ultimate rush!
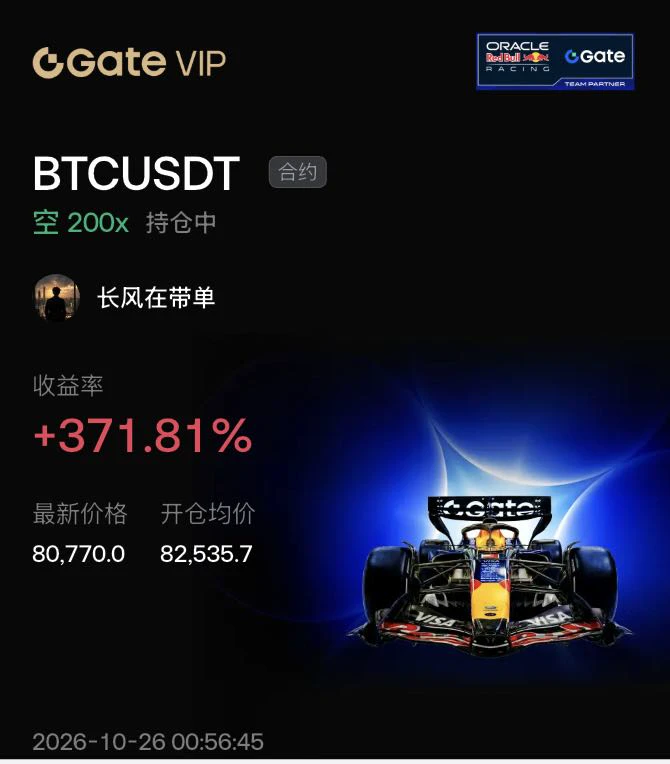
Many people are afraid to touch high leverage because they can't find that “sure-win point.”
But we caught this short on $BTC ! 200x leverage, currently up +371.81%! 🚀
From an entry at 82,535 to 80,770 now, it looks like a drop of less than 2,000 points, but amplified 200x, that's 3x profit!
That's the power of being a pro: dancing on the edge of a knife and still keeping your footing. Those who joined in, how was the ride? 😎$ETH #现货黄金跌破$4000
post-image
BTC+0.43%
ETH+1.24%
  • 1
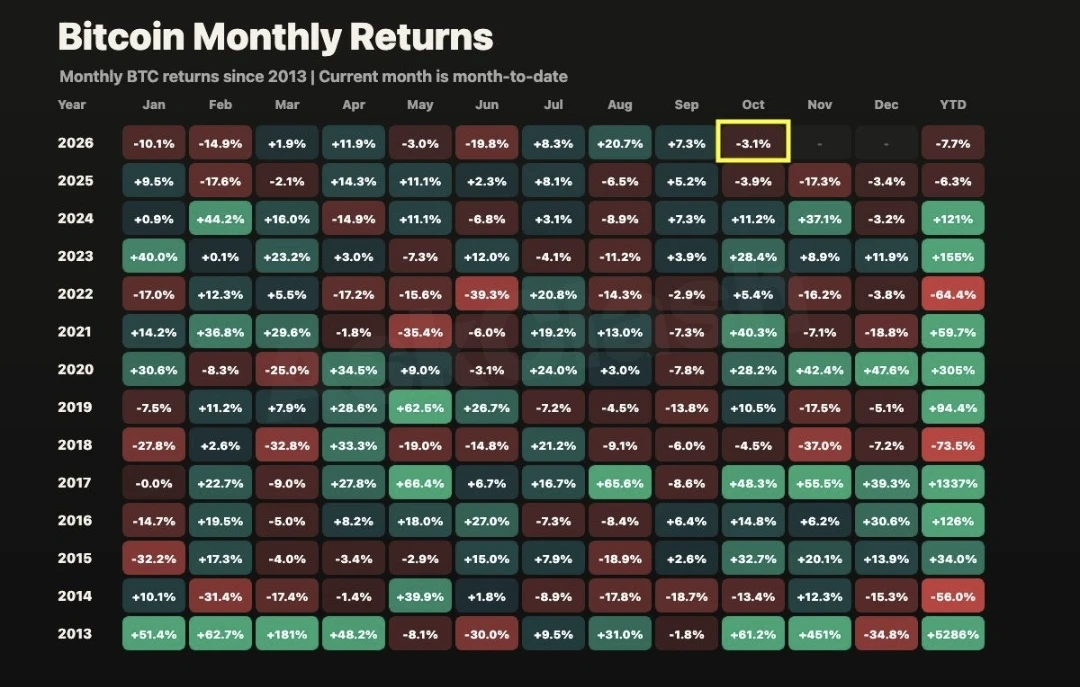
🚨 INSIGHT 🚨: Bitcoin has never had two red Octobers in a row.
October 2025 closed at -3.9%, and October 2026 is sitting at -3.1% with only 7 days left.
Uptober has one week to flip the script and end in the green 🔄
✅️ FOLLOW FOR MORE ✅️
#GateSquareHalloween
#USEarningsSeason
$BTC ‌$ZEC ‌
post-image
BTC+0.38%
ZEC+5.63%
2am check: xrp +2.3%, sol +1.5%, doge +1.3%. everything green and nobody awake to see it. my cat and I are watching the moon like it owes us bags. probably nothing.
post-image
XRP+1.71%
SOL+0.94%
DOGE+0.80%
The price has sharply retreated from the 24-hour high of 0.062010, and strong selling pressure is forming an immediate top. The 1-hour RSI is as high as 85.09, in severely overbought territory, signaling severe market momentum exhaustion and an imminent mean-reversion pullback. Short on $T .
Entry range: 0.0602 - 0.0615 Take-profit 1: 0.05550 Take-profit 2: 0.05122 Stop-loss: 0.06396 Popular coins: $JC : Current price 0.006874 - 24-hour change: +14.91%
$ZEC : Current price 1,212.12 - 24-hour change: +4.79%
post-image
ZEC+5.55%
Bitcoin and Ethereum Face Renewed Selling Pressure as Large Traders Reduce Market Exposure
live-cover
LIVE1,953
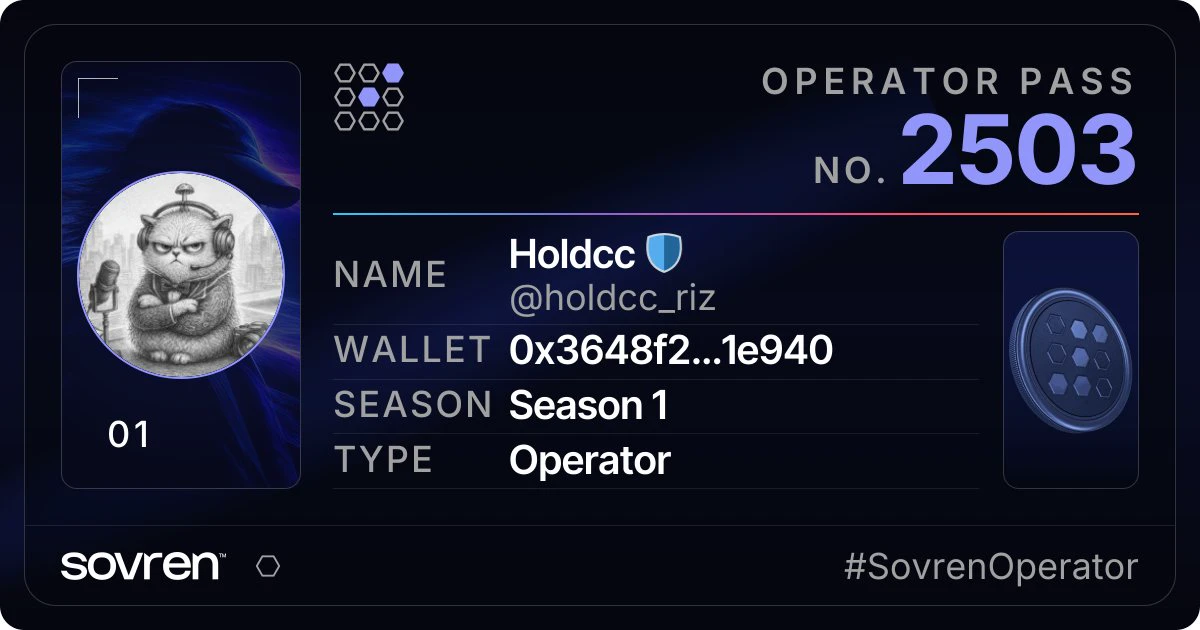
#SovrenContest Operator Pass No. 2503. Issued once, in order.
#SovrenOperator
post-image
Price is showing a potential short-term base near the 0.04528 support level, with the 15m chart printing a bullish cross of the MA7 over the MA25. RSI(6) at 55.82 suggests building momentum for a mean reversion scalp toward the 0.052 resistance zone.Going to Long $ORDE now.
Fill Zone: 0.04678 - 0.04783Scale Out 1: 0.0515Scale Out 2: 0.0549Risk Cut: 0.0444Market watch:$CA : Current Price 0.10313 - 24h Change: +37.69%
$ETH : Current Price 2,354.7 - 24h Change: +1.70%
post-image
ETH+1.19%
Don't watch the market over the weekend; enjoy life
#交易员日常 #ETF
On Friday, I expected it to reach 2280, but since I never hold positions over the weekend, I hastily took profit at 2410. I didn't expect it to hit 2281 only on Saturday
But opportunities are always there
There's more to come; don't get complacent—stay humble and level-headed
$T The current price is 0.0055, up 20.82% in 24 hours. But after surging to 0.0076, it plunged back to 0.0045—that kind of volatility has already trapped intraday chasers twice. Trading value is 290 million, with intense turnover: a classic divergence after sentiment overheats.
My sentiment gauge currently reads: Fear and Greed Index at 78, nearing the extreme greed zone; funding rate at +0.11%, with long-side crowding in the top 5% of the past 30 days. For historical context, the last time the funding rate topped 0.1% was in the middle of last month, after which $T pulled back 18% in two days
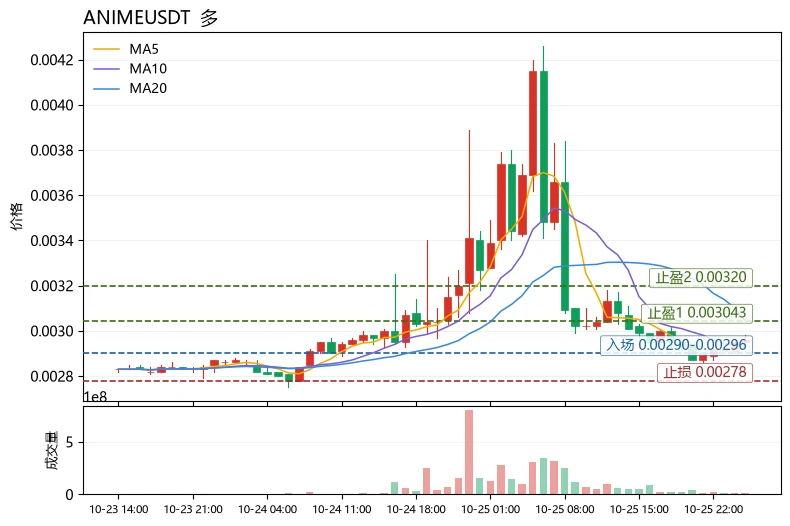
$ANIME The most unusual detail today isn’t the 12.68% drop, but that the funding rate was pushed down to -0.1049%—shorts are paying to hold their positions, yet the price remains below MA5=0.002928 and MA20=0.003043, while the MACD histogram at -1.505e-05 remains bearish. This is a classic “crowded shorts, but no trend reversal yet” setup. Negative funding means short costs are accumulating; if 0.002928 is reclaimed, the force of short covering will intensify. But RSI is only 45.9 and not oversold, and the Bollinger lower band at 0.002664 has yet to be tested, so the risk of a wick flushing o
post-image
ANIME-14.59%
ETH+1.19%
UNI+3.43%
$BIRB A brutal 18.47% plunge in 24 hours, with the current price at 0.0774 and a low of 0.0691, yet trading volume surged to 155.5M—this isn’t panic selling; someone is aggressively changing hands at the lows. The chart shows clear buying support around 0.07, but momentum fades above 0.08—a typical aftereffect of a long liquidation cascade. The fund flows are clear: a sharp morning sell-off liquidated leveraged longs, followed by sideways accumulation in the afternoon. Volume hasn’t declined, which shows there’s still significant disagreement. My trading advice: don’t chase shorts at the curre
BIRB-19.32%
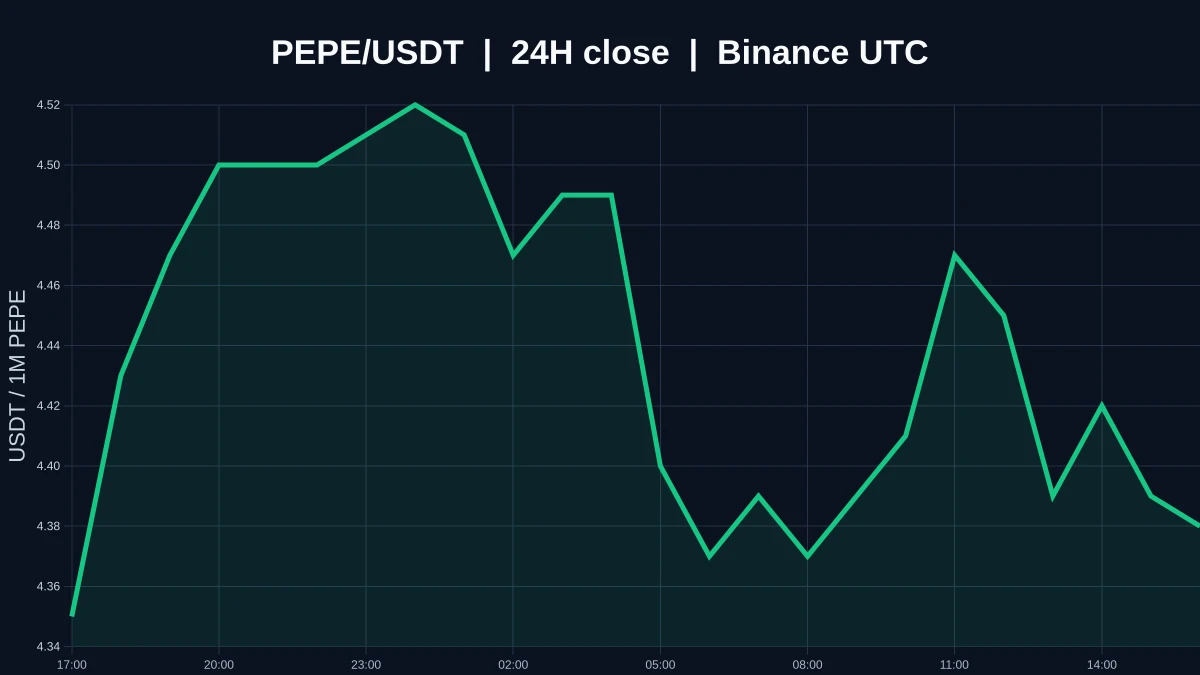
$PEPE is currently trading at 0.00000438, up 3.30% over 24H (range: 0.00000423–0.00000456). The 1H trend is weak, with an RSI of 40; the 4H trend is weak, with an RSI of 24. If it breaks above 0.00000456 decisively, the upside potential can be monitored; if it falls below the 0.00000429 support, the short-term structure may weaken. Market volatility is high; for observation only.
post-image
PEPE-0.11%
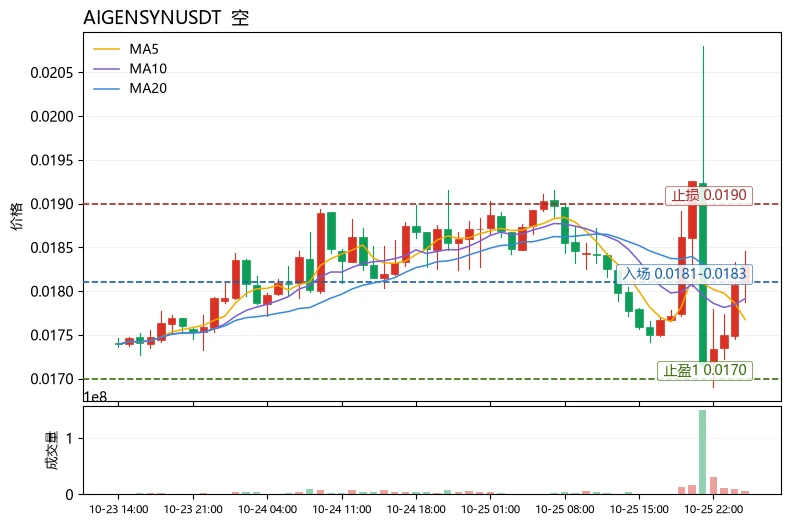
$AIGENSYN Short-term bearish; a rebound is an opportunity to reduce positions, not a signal to chase longs. The reason is that the balance of power between bulls and bears still favors the bears: the price of 0.01832 is below MA20 (0.018129), MA5 is below MA20, the MACD histogram is negative, and the trend structure has not recovered. Meanwhile, the funding rate remains positive at +0.0050%, meaning longs are paying to hold positions, while the 24h decline of 3.27% shows that longs are stuck absorbing losses. A break below the lower Bollinger Band at 0.0169701 could easily trigger stop-loss or
post-image
XRP+1.71%
Load More

Join 40 M users in our growing community

⚡️ Join 40 M users in the crypto craze discussion

💬 Engage with your favorite top creators

👍 See what interests you

Trending Topics

USEarningsSeason

99.7k Views3.52k Discussing

The U.S. Q3 earnings season is in full swing, with major tech companies including Tesla and Meta reporting results. Market focus is shifting beyond revenue and profit toward AI spending, capital expenditure, margins and forward guidance. Which company’s earnings are you watching most closely?

GateWCTCS9GlobalTradingCompetition

720.76k Views8.09k Discussing

USConsumerSentimentNearRecordLow

12.12k Views299 Discussing

View More