




Square
Following
Hot
News
Profile
Share your thoughts
placeholder
Article
Nearly $1 Billion Leaves $BTC and $ETH ETFs
Crypto investors are pulling money out, but the real story is why.
Bitcoin and Ethereum ETFs have seen nearly $986 million in combined outflows so far in October.
Rising Treasury yields are making safer investments more attractive. At the same time, oil prices and inflation concerns are putting pressure on risk assets.
Ethereum is facing another problem. Some institutional investors use ETH ETFs for trading strategies that become less profitable when futures premiums shrink.
But here is the key point. ETF outflows do not automatically mean investor
post-image
BTC+2.33%
ETH+2.99%
  • 7
  • 1
2026.10.10
Daily entry point: 2487
Resistance levels above: 2490-2500-2510-2520-2560
Support levels below: 2480-2470-2460-2450-2430-2420-2410-2400
On the first break of support or resistance, or if it fails to break, trade the rebound; on a subsequent break, follow the trend. In the 2460-2450 upper range, favor buying dips; in the lower range, favor shorts. Once 2480 holds, favor longs; if 2400 is not broken in the lower range, favor longs; if 2400 breaks, favor shorts. Break above 2520 in the upper range and chase longs. Once 2560 holds, chase longs; if it fails to hold, favor shorts.
post-image
Join the weekly posting event to post, earn points and win big rewards! https://www.gate.com/campaigns/6244?ref=VLARBF1YAG&ref_type=132
post-image
+148.80% sounds like a rocket. The range says it already came back down.
‍$CODEX touched $0.28 in the last 24 hours. It’s now at $0.1506, about 46% below that high. The low was $0.054, so the peak was around 5x the low (my arithmetic).
Volume is only $157.26K on a $1.09M market cap. At that size, a few buyers can move the price a lot, and a few sellers can move it back.
The headline gain is real. But the person who bought the top and the person who bought the low are living in different markets.
Watch whether volume returns while price holds above the middle of the range.
Which price do you r
post-image
CODEX+148.87%
I’m seeing mostly bearish signs.
People are selling ahead of October 10. That’s tomorrow. A Saturday.
Add thin weekend liquidity to the mix 💀
The market remembers last year. Doesn’t mean we get a repeat, but If I was a bull I wouldn't like what am seeing now.
post-image
Retail investor: If we get another 2022 I'm going to cash. That year broke me... BAD.
Me: Look at that chart. Down over 36%. Now tell me what you did.
Retail investor: Held as long as I could, sold near the bottom, got back in way higher.
Me: So the market took a temporary 36% dip & your reaction made it permanent... You sold when it went on sale...
Retail investor: I know. It still eats at me inside.
Me: Here's my 2022. Same chart. I sold 1+ year portfolio secured puts the whole way down while premiums were the fattest they'd been in years. Collected the cash flow and reinvested in back in to
post-image
Inflation expectations are at 3.9%, the highest since May 2023, and more gut-wrenching than the actual CPI. This is exactly what the Fed is watching—when ordinary people expect prices to rise, they really do feel emboldened to demand higher wages, and businesses really do feel emboldened to raise prices. One link leads to another, and inflation ends up feeding itself. Don’t ask why rate cuts are taking so long—it’s that simple. What do you think?
post-image
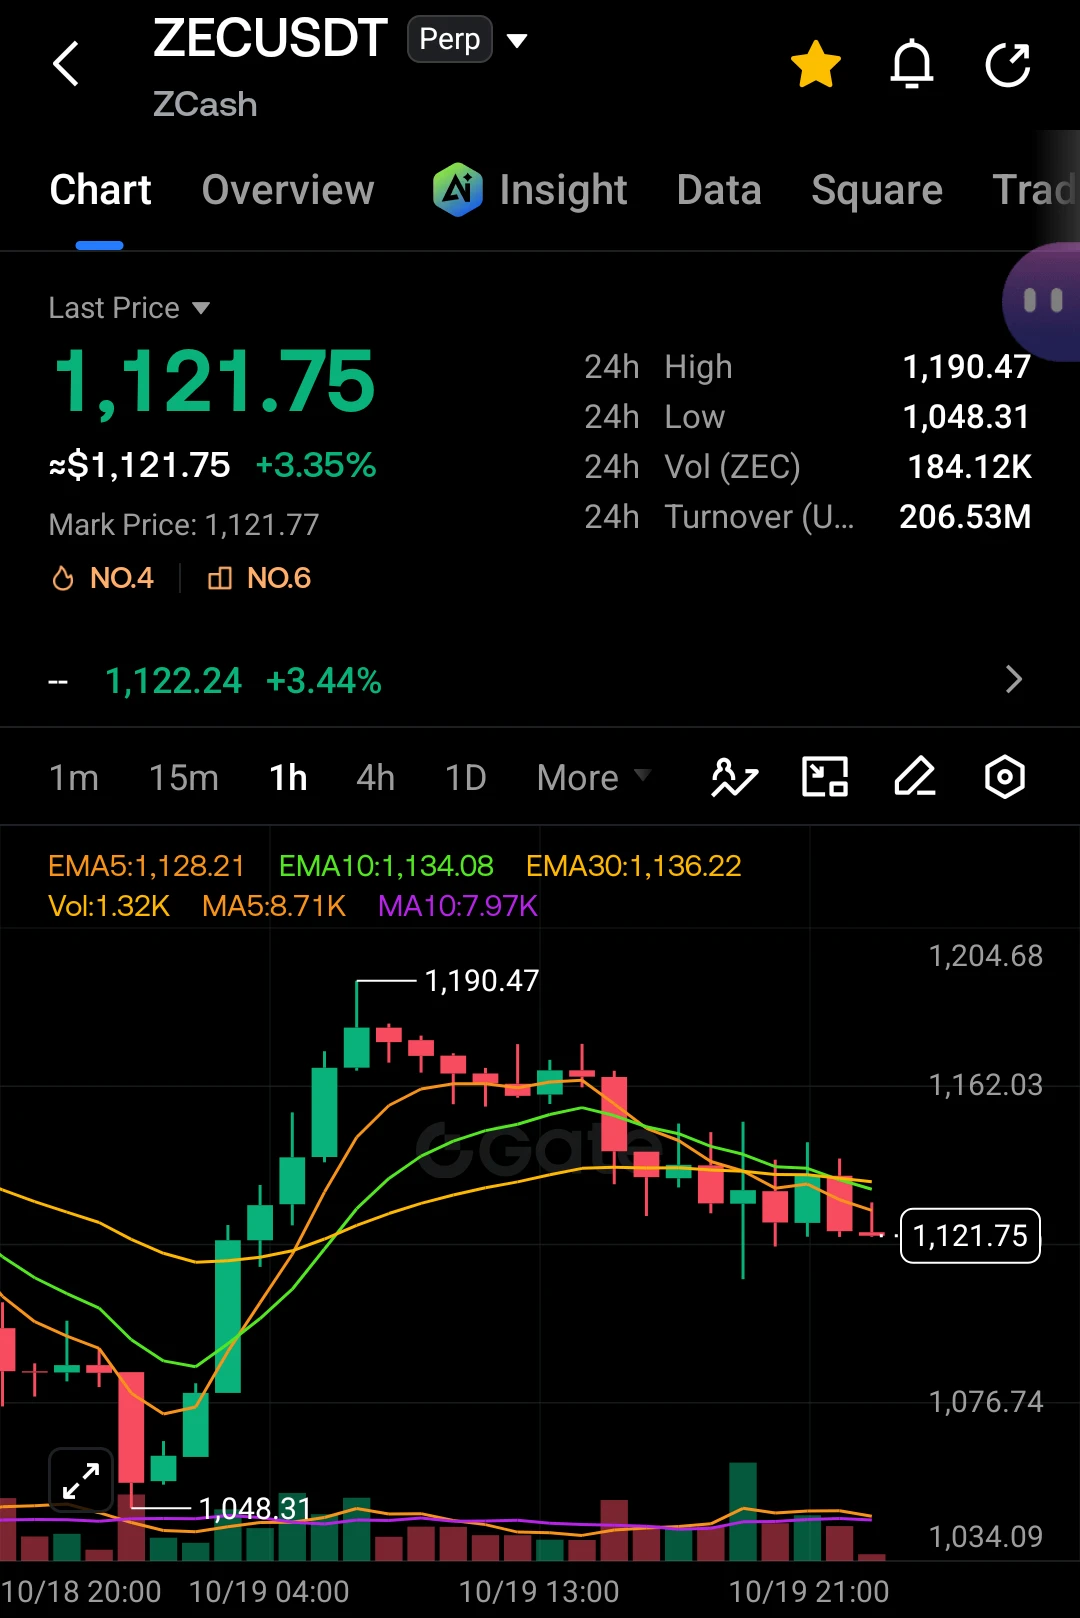
$ZEC Current price: 1216.19. The short-term long/short dividing line is MA5 at 1218.63. Support below is the lower Bollinger Band at 1183.45, while resistance above is the upper Bollinger Band at 1244.83.
First, the method: to determine whether the trend is healthy, I look at only two signals. First is the moving average alignment: MA5 must hold above MA20 without a death cross, indicating that short-term costs remain higher than medium-term costs and the bullish structure has not been broken. Second is the MACD histogram: continuously positive red bars indicate that momentum remains in the ha
post-image
PYTH+8.67%
Market update
live-cover
LIVE2,141
Robinhood adds $25million worth of Bitcoin to its balance sheet
live-cover
LIVE1,146
THE TELEGRAM WALLET IS LIVE.
Update your app now. The next billion users are getting onboarded now.
Durov played this one smart.
To get access, someone who already has the wallet has to send you at least 0.1 $GRAM .
Then it shows up in the “Money” tab.
Every new user can activate the next one.
That’s how it spreads like wildfire.
For now you can only send and top up your balance.
Drop your usernames below, I’m activating people now 👇
post-image
GRAM+8.26%
Hermes got the unicorn. BitcoinSV already has the rail.
Nous Research closed a $90 million round on October 7 at a $1.5 billion valuation. Bitcoin (SV) is the chain that can log what that agent will eventually have to pay for. BitcoinSV is not in the term sheet. The socket is already open. 📈
The company says Hermes has been cloned more than 24 million times since February and drives about 2.5% of global AI token use. Those are its estimates. Annualized revenue was about $36 million by mid-September. The target is $100 million before year-end. Nvidia, Samsung, and Union Square Ventures are in
post-image
BSV+4.72%
NVDA-0.47%
Floki pump pump big pump ath go
post-image
FLOKI+7.11%
ZEC was expected to rebound in the afternoon, with resistance around 1250 manageable. The evening rebound subsequently came under pressure at 1250, reaching a high of 1246 before pulling back, easily delivering 46 points of room!
The intraday surge and retreat under pressure completely matched the earlier assessment. #BTC回调触及81000美元 $ZEC ‌
ZEC+8.46%
Sold out instantly🎉
GPT5X 20X 50X top-ups will be restocked and listed again at 12 noon tomorrow; other top-up services are operating normally.
post-image
  • 1
10.9 Jin Ce Midnight Gold Review: Gold surged and pulled back on the 15-minute chart, followed by high-level consolidation! Is 4207 a top or a continuation of the uptrend?

Intraday spot gold on the 15-minute chart first rose and then fell. In the morning session, it began a one-way rally from the interim low of 4121, with bulls continuing to push higher to the interim high of 4207. Profit-taking then drove prices lower, and the market entered a high-level range-bound phase. It is currently trading around 4191, with bulls and bears battling below the 4200 level, while short-term divergence is
post-image
XAUT+1.52%
Trading China’s A-shares—this lifetime is set.
post-image
$SOL
Rejected from 123.77, now bouncing off 105.72 support. Price is below all three MAs—bearish structure, but showing a relief bounce. Break above 110.72 triggers recovery; failure retests 105.72. Momentum cooling—wait for the close.
Entry Zone: 109.00 – 110.00
TP1: 110.72
TP2: 116.45
TP3: 120.16
Stop-Loss: 104.00
#SOL #ShareWeekly #GateAtTOKEN2049 #GateWCTCS9GlobalTradingCompetition #BTCPullsBackTo81000
post-image
SOL+2.07%
  • 1
The climate policy has been implemented, so why is the money still not moving? Because policy documents don’t solve the mismatch between the inflation rate and the unlock schedule—the real thing that determines price is when tokens hit the market, not who shouts the loudest. Before the halving, $BTC will also trade sideways for a while. The climate narrative is the same, so don’t rush to buy the dip. If you think I’m talking nonsense, take a screenshot and save it.
post-image
BTC+2.33%
Load More

Join 40 M users in our growing community

⚡️ Join 40 M users in the crypto craze discussion

💬 Engage with your favorite top creators

👍 See what interests you

Trending Topics

GateAtTOKEN2049

37.62k Views21.11k Discussing

Gate brought a series of major events to TOKEN2049 Singapore! From the official launch of Gate Money to the F1 Red Bull driver meet-and-greet and the Gate Gala, we witnessed a new chapter of "One Gate, Borderless Finance." Which moment from TOKEN2049 stood out most to you?

GateWCTCS9GlobalTradingCompetition

32.62k Views3.49k Discussing

BTC Pulls Back to 81000

26.48k Views35.93k Discussing

View More