Square
Following
Hot
News
Profile
Share your thoughts
placeholder
Article
#AnthropicTurnsProfitablebutGrowthSlows
Anthropic Turns Profitable, but Growth Slows: Is the AI Giant Losing Momentum or Preparing for Its Next Big Leap?
The artificial intelligence industry has reached an important turning point as Anthropic, the developer of Claude AI, reportedly achieved adjusted profitability while experiencing a slowdown in revenue growth. This development presents both an encouraging business milestone and a challenge for investors evaluating the company's future.
📊 Strong Revenue, Slower Growth
According to reports from Anthropic's October 14, 2026 investor meeting, t
GOOGL+0.23%
Bitcoin Support and Resistance Levels
live-cover
LIVE577
$ACU is showing promising bullish momentum on the 15minute chart.
After consolidating around $ACUpricebroke out with strong upward movement and reached a local high near $0.1030.
$ACUis now trading around $0.1000,withthe $0.1011levelremaining important to watch.
Holding above the $0.0970 $0.0975supportzone could help maintain the current recovery structure while a strong move above resistance may bring another test of the recent high.
Watching volume and price action closely as the next move develops.
Patience and confirmation matter more than chasing the pump.#ACU #USSeptemberPPIBeatsExpecta
post-image
ACU+4.47%
  • 2
  • 1
$BTC Bitcoin's 80,501 bid eaten by market orders
In the London session, 95 BTC of market orders went through the 80,501 bid at 13:03 UTC. Eaten, not cancelled.
post-image
BTC+0.83%
✨ US equity futures traded mixed on October 15 as technology and AI-related stocks faced renewed pressure.
🔹 Futures tied to the tech-heavy Nasdaq 100 fell about 1.2%, while S&P 500 futures slipped 0.3%. Dow Jones Industrial Average futures held relatively firm, trading slightly positive. The divergence reflects a selective risk rotation rather than a uniform selloff.
📊 The data behind the market's sharp reaction:
🔹 Inflation pressures are broadening
▪️ US September PPI rose 1.3% month-over-month and 6.3% year-over-year, far exceeding the 5.3% forecast and marking the largest annual increas
NAS100-0.11%
SPX500+0.30%
US30+1.36%
GAS-5.66%
MU+0.95%
  • 1
✨ US Data Update: What Today's Numbers Signal for Markets
🔹 A dense set of US economic data released today painted a picture of an economy that remains resilient, but with inflation pressures proving more persistent than expected. The combination of hot inflation, strong consumer spending, and a tight labor market is reshaping rate expectations.
📊 The data on the table:
🔹 PPI (Producer Price Index): September PPI rose 1.3% MoM and 6.3% YoY, far exceeding the 0.5% and 5.3% forecasts. This is the largest monthly increase since March 2022. Core PPI, excluding food and energy, rose 0.7% MoM and
post-image
User_any
#美国9月PPI大超预期 ✨ US PPI Inflation Surges to 6.3%, the Highest Since Late 2022
🔹 The US September Producer Price Index (PPI) rose 1.3% month-over-month and 6.3% year-over-year, significantly exceeding the consensus estimate of 5.3%. This marks the largest monthly increase since March 2022 and the highest annual reading since December 2022.
📊 The data behind the print:
🔹 Core PPI: Excluding food and energy, core PPI rose 0.7% MoM and 5.0% YoY, both above expectations.
▪️ Energy: Energy prices surged 10.8%, accounting for more than 80% of the broad-based increase in goods prices. Gasoline jumped 20.3%.
▪️ Context: The reading follows Wednesday's CPI report, which also came in above forecasts at 3.7% YoY headline and 2.6% core. Retail sales for September rose 0.8% MoM, beating the 0.3% estimate.
⚖️ Market impact:
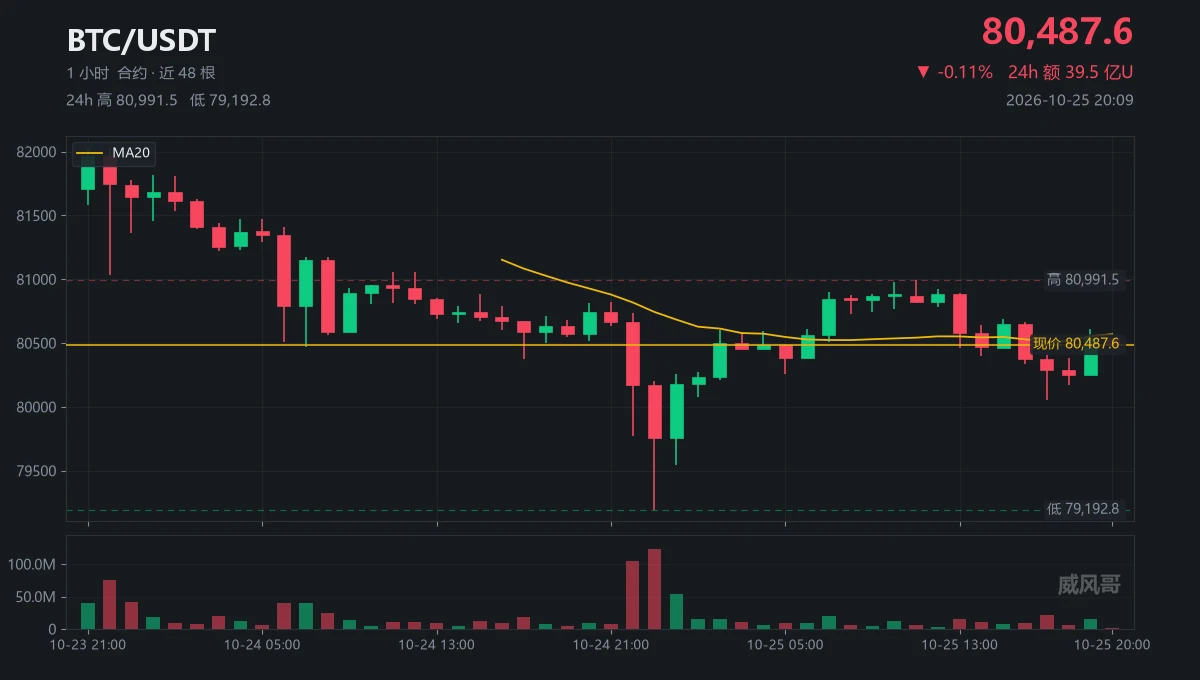
🔹 Bitcoin: Briefly fell below $80,000 to $79,800 before rebounding to near $82,000. Market-wide liquidations reached approximately $930 million over 24 hours, with long positions accounting for $780 million. The $80,000–$81,500 zone remains a critical support area, overlapping with the estimated ETF cost basis.
▪️ US Equities:The S&P 500 and Nasdaq 100 traded mixed, with tech and semiconductor names under pressure. The Philadelphia Semiconductor Index fell over 4% in the prior session. Cyclical sectors and the Dow Jones outperformed as investors rotated toward defensive positioning.
▪️ Treasuries & Dollar: The 10-year Treasury yield dipped to approximately 5.04% from 5.10%, as safe-haven demand for bonds offset the inflation surprise. The dollar index retreated from its 18-month high toward 102.0.
▪️ Gold & Silver:Spot gold recovered above $4,150, up over 1%, while silver rebounded above $56.9 per ounce, gaining more than 2.4%. The recovery was driven by falling yields, a softer dollar, and renewed safe-haven demand.
⚖️ Structural perspective:
🔹 The PPI acceleration broadens the inflation narrative beyond consumer-level price pressures. With producer costs rising across energy, transportation, and services, the data reinforces the case for the Federal Reserve to maintain a restrictive stance. Markets now price roughly a 29% probability of a rate hike at the October 27-28 meeting, with December tightening expectations remaining elevated.
▪️ For risk assets like Bitcoin, the primary pressure channel is the rate outlook: higher-for-longer borrowing costs reduce the relative appeal of non-yielding assets. Gold and silver, however, face a more layered dynamic, balancing safe-haven demand against real-rate headwinds.
▪️ The key variable ahead is whether the Fed signals patience at the October meeting or adopts a firmer tone. Until that guidance arrives, markets are likely to remain in a recalibration phase, with capital rotating selectively between growth, defensive, and hard-asset exposure.
🔹 How are you assessing the market's response to two consecutive inflation surprises? 👇
#PPI #Inflation #Bitcoin #Gold
Not financial advice.
repost-content-media
BTC+0.82%
US500+0.37%
NAS100+0.01%
$ACU is showing some life 👀🔥
After that sharp move to $0.11049, ACU is holding around $0.0995, with buyers still trying to keep the momentum alive.
MACD is looking bullish on the 1H chart, but $0.1005 is the level I’m watching next. A clean move above it could make things interesting.
Let’s see if the bulls can take control 👀
#ACU $ACU
post-image
ACU+4.42%
  • 5
  • 2
$UNI UNI this pile of fancy renovations 💩 — the protocol looks glossy, the token lies flat, the team counts money until their hands cramp, and retail investors get stuck so badly they start questioning life 😅 . Big trading volume? More users? Just the words “leading” and “leader” get you a get-out-of-death gold card? They’re doing business; you’re holding a daytime dream. If it drops, it’s called “wrong kill”; if it moves sideways, it’s called “building up strength”; if you’re trapped, it’s called “long-termism.” With a different package, people will kneel and舔 — this isn’t investing, it’s
post-image
UNI+4.56%
“Sausage Index”: Why Is PPI More Important Than It Seems?
The gist: Explain a complex term simply. “PPI is factory-gate inflation. If it costs a meat plant more to buy raw materials and make sausages, those sausages will cost more in stores for you a month later (that’s CPI). So PPI is like a spoiler for future prices. Factories are sounding the alarm now, so the Fed is reaching for its belt.”
#USCPISoon #ShareWeekly
Oversold rebound does not alter the weak trend! 4110 support temporarily holds, while bears await an opportunity to probe lower again
Gold extended its bearish move overnight, falling on increased volume and touching the key support at 4111 before beginning a technical recovery. It oscillated higher during today’s Asian session, reaching a high near 4168 before encountering resistance, and is currently trading around 4157. Overall, it remains in a weak oscillating pattern of “accelerated decline and oversold recovery.” Bears still have the upper hand in the bull-bear battle. The 4110 area is a
post-image
GLDX+1.58%
PAXG+1.21%
XAU+1.35%
6.5T supply → burn → less → burn → less.
The formula is working.
Keep burning. Keep building.
#LUNC #TerraClassic #Crypto 🔥
post-image
LUNC+1.18%
#美国9月PPI大超预期
The September CPI data (3.7% year-on-year / 0.6% month-on-month), combined with today’s PPI figures—which show a sharp increase (6.3% year-on-year / 1.3% month-on-month)—have fundamentally altered the short-term macroeconomic outlook. Driven by energy costs, price hikes linked to chip shortages ("chipflation"), and persistent pressures in the housing and services sectors, this trend is causing inflationary pressures to re-accelerate. This leaves Federal Reserve (Fed) policymakers in a very difficult position ahead of their policy meeting at the end of October.
Federal Reserve Pol
post-image
BTC+0.82%
XAUUSD+1.32%
MU+0.95%
NAS100-0.11%
INDEX-4.42%
before you ask me
were you invit...
📉 Japanese and South Korean stocks plunged across the board, while memory chips became the focus of traders' attention
The Nikkei 225 Index fell 4.90%, the South Korean KOSPI Index fell 7.56%, and semiconductor and memory stocks once again became market hotspots.
Interestingly, the more volatile the market, the higher the trading attention on related assets.
Odaily reports that CoinGlass data shows:
🔥 SK Hynix: Gate holdings account for 15.8% of the total network, ranking second
📊 SanDisk: Gate holdings account for 18.15% of the total network, also ranking second
Amid the sharp decline, som
GateSquare
📉 Japanese and South Korean stocks plunged across the board, while memory chips became the focus of traders' attention
The Nikkei 225 Index fell 4.90%, the South Korean KOSPI Index fell 7.56%, and semiconductor and memory stocks once again became market hotspots.
Interestingly, the more volatile the market, the higher the trading attention on related assets.
Odaily reports that CoinGlass data shows:
🔥 SK Hynix: Gate holdings account for 15.8% of the total network, ranking second
📊 SanDisk: Gate holdings account for 18.15% of the total network, also ranking second
Amid the sharp decline, some are seeking rebound opportunities, while others are choosing to hedge risks.
The long-term logic of AI-driven memory demand remains intact, but have short-term stock prices already undergone a sufficient correction?
Do you have greater confidence in rebound opportunities for Hynix and SanDisk, or do you think the memory sector still needs to digest valuation pressure?
Bring #日韩股集体大跌 to Gate Square to share your market observations, trading strategies, or portfolio review.
💬 Is the decline creating an opportunity, or even greater volatility? Share your view.
📖 Odaily reports:
https://www.odaily.news/zh-CN/newsflash/524805
repost-content-media
JPN225-2.01%
SK Hynix-11.06%
$BTC
BTC is bouncing around $82.3K, but still trading below the 4H SuperTrend near $84K.
Hold $81K and we could see another push toward $84K. Lose it, and $79.5K is back in play. No bullish confirmation until BTC reclaims $84K.
post-image
BTC+0.82%
  • 2
No wonder Eric Tsang is so optimistic about her—she’s indeed beautiful.
$NEAR is beginning to awaken after a long period of accumulation… $6.60 could be the next major target!!!
I’m looking for a major long opportunity in $NEAR here. Entry price: 5.20–5.30, stop-loss: 4.95, target 1: 5.54, target 2: 6.01, target 3: 6.61, as the chart is beginning to show a different trend. After a prolonged decline, the price rebounded strongly from the $4.50–$4.60 area and is currently testing around 5.25. Buyers are entering, but the next challenge is breaking through resistance with sustained volume. ‼️‼️‼️If 5.54 is decisively broken, the price could advance toward $6.01 and
post-image
#美国9月PPI大超预期 ✨ US PPI Inflation Surges to 6.3%, the Highest Since Late 2022
🔹 The US September Producer Price Index (PPI) rose 1.3% month-over-month and 6.3% year-over-year, significantly exceeding the consensus estimate of 5.3%. This marks the largest monthly increase since March 2022 and the highest annual reading since December 2022.
📊 The data behind the print:
🔹 Core PPI: Excluding food and energy, core PPI rose 0.7% MoM and 5.0% YoY, both above expectations.
▪️ Energy: Energy prices surged 10.8%, accounting for more than 80% of the broad-based increase in goods prices. Gasoline jumpe
post-image
BTC+0.82%
SPX500+0.30%
NAS100-0.11%
  • 1
$WAL The most interesting thing right now isn’t guessing whether prices will rise or fall, but seeing who is forced to change their tune first.
The bulls’ test is at 0.06786, while the bears’ test is at 0.0503. $WAL is currently at 0.05137, down 18.54% over 24 hours. The 1-hour support is 0.0503, resistance is 0.06786, and current volume is 0.14 times the average volume of the past 20 periods.
I’ll first note that the 1-hour chart for $WAL has moved, while the 4-hour chart still hasn’t acknowledged it, because I treat shorter timeframes as alerts, not direct conclusions; if the higher timefram
post-image
WAL-14.62%
Load More

Join 40 M users in our growing community

⚡️ Join 40 M users in the crypto craze discussion

💬 Engage with your favorite top creators

👍 See what interests you

Trending Topics

USSeptemberPPIBeatsExpectations

91.35k Views1.86k Discussing

US September PPI came in at 6.3% YoY, well above the 5.3% market expectation, pointing to renewed producer-side inflation pressure. Weekly jobless claims were 199K, broadly in line with forecasts. Could hotter inflation further reduce room for rate cuts, and what does it mean for $BTC, US stocks, and gold?

DrLinHanSpeaksAtOxfordUnion

135.63k Views1.86k Discussing

JapanAndKoreaStocksPlunge

47.27k Views1.76k Discussing

View More