




Share your thoughts
placeholder
Article
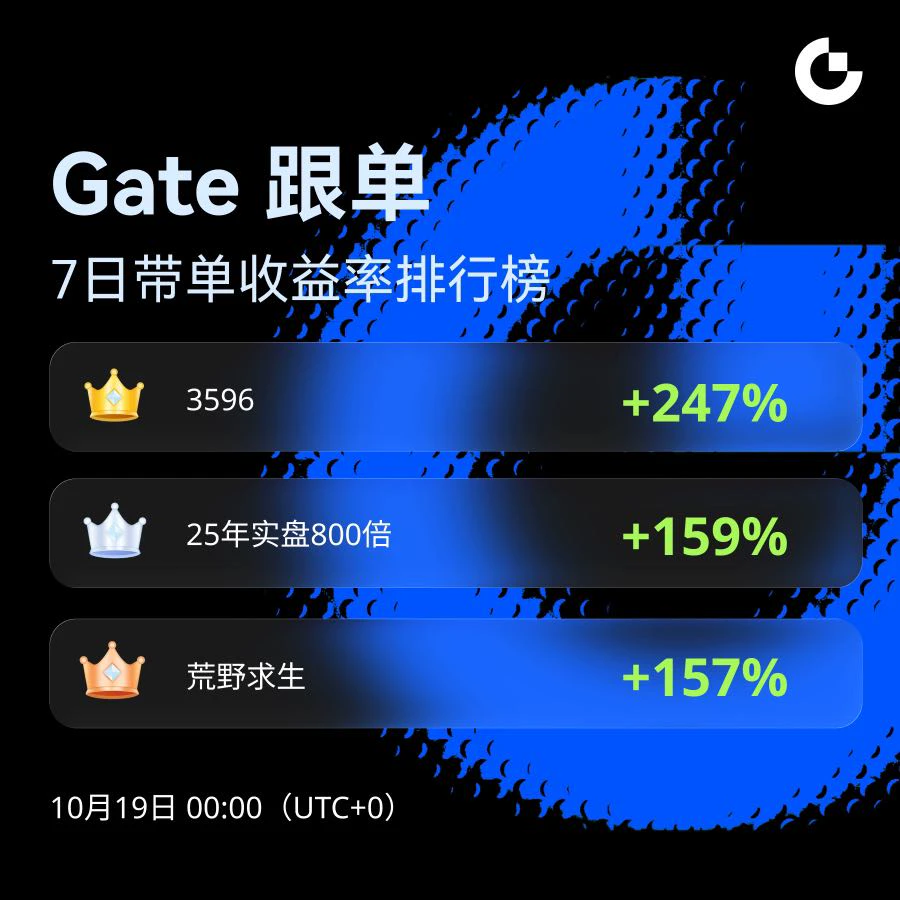
156%, excluding fees. Note this down.
post-image
$LUNA Conclusion first: bullish in the short term, but chasing higher at the current level offers poor risk-reward; only buy on pullbacks, do not chase highs.
Three reasons. First, the moving averages are in a bullish alignment, with MA5=0.05124 crossing above MA20=0.04834, while the MACD histogram at +0.001025 continues to expand, making the upward trend direction clear. Second, RSI=87.1 has entered the extreme overbought zone, and price at 0.0571 has directly broken above the Bollinger upper band at 0.05433. The 30-candle range is 33.8%, indicating highly euphoric bullish sentiment, with pr
post-image
LUNA+16.37%
NEAR+11.25%
ENA+10.92%
#GarrettJinHolds320MInZEC
Garrett Jin’s ZEC position is a lot more interesting than a simple “whale is shorting ZEC” headline.
The records he shared show roughly 202,080 ZEC still held in spot, worth around $320M at the reported price. At the same time, his Hyperliquid position is a short of about 38,000 ZEC, worth roughly $60M. The short is currently carrying a large unrealized loss.
But look at the structure.
Around 202K ZEC spot versus roughly 38K ZEC short.
That means the short represents only a portion of his overall ZEC exposure. If the purpose is hedging, the logic is very different fr
post-image
ZEC-0.27%
Most traders are about to get this trade wrong

$XAUT /USDT - SHORT

Trade Plan:
Entry: 4366.6 – 4368.0
SL: 4374.1
TP1: 4362.2
TP2: 4358.8
TP3: 4353.8

Why this setup?
Why now? The daily trend is range, which means the 1h price of 4367.3 is sitting right at the entry zone and the 15m RSI of 46.1 shows momentum is neutral, not bullish. The 1h ATR of 2.819066 tells us a sharp move is possible from this level, and the SHORT bias targets TP1 at 4362.2 and TP2 at 4358.8 if the range breaks downward. The invalidation level of 4363.4 is the hard line that proves the setup wrong.

Debate:
Are you
post-image
XAUT-0.14%
#JapanRealEstatePowerChipStocksRise
Japan’s stock market continues to attract attention as investors focus on two important themes: real estate and semiconductor-related companies.
Recent trading has shown strong interest in Japanese chip and AI-related stocks. Semiconductor names such as Advantest, Tokyo Electron and Kioxia have been among the companies drawing significant buying interest, reflecting the continued global focus on AI infrastructure, advanced computing and memory demand.
The semiconductor story is particularly important for Japan because the country remains a major part of the
post-image
private chatgpt x ai bitcoin barbell is gonna age so well
post-image
BTC-0.32%
Bitcoin Market overview
live-cover
LIVE1,579
#StandardCharteredSeesARBAt10By2030
Standard Chartered has put Arbitrum’s $ARB back in the spotlight with a highly ambitious long-term outlook, initiating coverage with an end-2030 price target of $10.
The bank’s published path is $0.50 by the end of 2026, $1.50 in 2027, $3.50 in 2028, $6.50 in 2029 and $10 by the end of 2030. The report was based on ARB trading around $0.13–$0.14 at the time, meaning the 2030 target represented roughly a 70-fold increase from that reference level. These are Standard Chartered’s projections, not guaranteed outcomes.
What makes the report particularly interest
I had already finished complaining to my friends about this week's market, but now I have to take it all back—kind of awkward.

A few days ago, I checked $ETHFI before bed. It held above support on the pullback, and buying pressure was strengthening, so I told those in long positions not to panic—it was forming a base without breaking down. From 0.4789 to 0.7232, unrealized gains reached +3614.79%. Those who got in must have woken up laughing.

Take 80% off the table first, and protect the remaining 20% at the entry price. Put the bulk of the profits in your pocket, and let the profits run i
post-image
ETHFI-2.11%
ADA-0.70%
XRP-1.40%
$BTC #BTCRetakes80K
Bitcoin Reclaims $80,000: A Recovery Built on Liquidations, ETF Flows, and a Shift in Sentiment
Bitcoin has pushed back above the $80,000 mark for the first time in over ten days, recovering ground lost after last week's Federal Reserve rate hike. The move was not a slow grind higher. It was a sharp, almost violent repricing that caught the market off guard.
The first phase of the rally was mechanical. In a single hour, more than $183 million in short positions were liquidated as Bitcoin broke through the $80,000 level, forcing bearish traders to buy back their positions
BTC-0.32%
  • 18
  • 2
Range-bound XRP is about to break lower and most traders are not ready.

$XRP /USDT - SHORT

Trade Plan:
Entry: 1.4038 – 1.4106
SL: 1.4398
TP1: 1.3828
TP2: 1.3665
TP3: 1.3420

Why this setup?
Why now? The daily trend is range, so the market is coiling for a directional move. The 1h ATR at 0.013577 shows volatility is compressed enough for a sharp push. The 15m RSI at 67.61 signals the short-term buyers are exhausted, not that a reversal is starting. The entry zone between 1.4038 and 1.4106 gives a precise trigger, with TP1 at 1.3828 and TP2 at 1.3665 offering clear profit targets. The inval
post-image
XRP-1.40%
Short-term traders, another benefit is here! Bullish on BTC at the current price, with 1,000 points of profit precisely in hand—did you catch this move?
Behind the 1,000-point profit is the mature trading system Jiaoyang has refined over time. Don’t let short-term market fluctuations disrupt your plans. Price levels are never mentioned casually; once the trend starts, resistance and support are the core factors. You may not believe it for now, but when the market move plays out, it will be time for us to lock in profits.
If you’re always led around by the market after entering a position, why
BTC-0.32%
ETH-0.35%
  • 3
Quick short trade entry levels on $EPIC
: 0.5750 or 0.5850
First target: 0.5400
Second target: 0.5200
Third target: 0.5000
Final target: 0.4800++
Stop loss: above 0.6450
post-image
EPIC+7.09%
Insiders are calling $ENA /USDT a trap after this move.

$ENA /USDT - LONG

Trade Plan:
Entry: 0.22524 – 0.22924
SL: 0.20809
TP1: 0.24161
TP2: 0.25118
TP3: 0.26555

Why this setup?
Why now? The daily trend is bullish, the 1h price sits at 0.22724, the 15m RSI is at 72.22 and the 1h ATR is 0.007981, which together signal strong momentum but also a risk of a sharp squeeze. The entry zone between 0.22524 and 0.22924 keeps risk tight, with TP1 at 0.24161 and TP2 at 0.25118 offering a clear two-stage exit plan. The invalidation level at 0.16312 is the hard line that protects the position if the
ENA+10.88%
Bitcoin Market overview
live-cover
LIVE19
$LINK On the 15-minute chart, it shot straight up from 11.911 to 12.56, and is now churning around 12.54. This move is a classic short squeeze combined with a shakeout. $NVDA
post-image
LINK-0.56%
NVDA+1.23%
  • 11
  • 2
#MSTRTopsNasdaq100
To determine whether MicroStrategy's ($MSTR ) upward trend is sustainable, it is useful to analyze the mechanisms driving the company's outperformance relative to the market and to identify key risks that could halt or reverse this momentum.
Key Factors Behind the Momentum
1. Leveraged Bitcoin Beta and Debt Structure
MicroStrategy operates much like a leveraged proxy for Bitcoin. The company acquires Bitcoin by raising capital—through convertible notes, senior notes, and preferred shares—at fixed, low interest rates (or low coupon rates). When the price of Bitcoin rises, equ
MSTR+16.51%
BTC-0.32%
NAS100+0.81%
  • 6
HYPE IS NOT THE SAME AS STRENGTH
A Meme can have attention without liquidity.
It can have hype without structure.
And it can have a huge candle without sustainable participation.
This is where I separate narrative from market strength.
Meme assets are unique because culture itself can become a catalyst.
A community grows.
A meme spreads.
Social attention accelerates.
Then traders arrive.
That feedback loop can create extraordinary momentum—but it can also reverse quickly.
So when I evaluate a Meme opportunity, I don't stop at the story.
I ask:
Is volume expanding?
Is liquidity deep enough to s
post-image
DOGE-3.15%
PEPE-6.37%
BONK-2.07%
DOG-4.73%
  • 1
#MSTRTopsNasdaq100
MSTR is moving much faster than Bitcoin right now, and that is exactly why I think this rally deserves a closer look.
Strategy jumped roughly 16% on September 18 and closed around $154, while Bitcoin reclaimed the $80K area. Crypto-linked equities moved sharply higher as BTC recovered, but MSTR amplified the move much more aggressively. That tells me traders are not only buying Bitcoin exposure — they are also buying the higher-beta version of the Bitcoin treasury story.
The foundation of this story is still Strategy’s Bitcoin treasury. As of September 13, the company held
post-image
MSTR+16.35%
BTC-0.32%
STRC+0.43%
As the tide rises and falls, human nature is revealed; through every gain and loss, one's discipline is tested.
After years of ups and downs in the market, I deeply understand the hardships ordinary traders face.
When first entering the market, with no one to guide them, they struggle forward alone. Staying up late watching the market, unable to sleep over trapped positions; rushing to exit at the slightest profit, while stubbornly holding on through deep losses. Emotions pull them back and forth until they are mentally exhausted. They fail to keep their profits, and are consumed by the market
post-image
BTC-0.32%
ETH-0.35%
Load More

Join 40 M users in our growing community

⚡️ Join 40 M users in the crypto craze discussion

💬 Engage with your favorite top creators

👍 See what interests you

Trending Topics

MSTRTopsNasdaq100

74.26k Views3.03k Discussing

Strategy (MSTR) has gained about 48% over the past month, making it the best-performing stock in the Nasdaq 100, while Bitcoin rose roughly 12% over the same period. The company holds 845,050 BTC with a cumulative cost basis of about $63.73B. MSTR is not a pure Bitcoin proxy — its price swings can be more extreme. Can this rally last?

Gate Tops 24H Net Inflows Among Exchanges

26.51k Views3.69k Discussing

BTCRetakes80K

57.37k Views60.68k Discussing

View More