
Square
Following
Hot
News
Notifications
Profile
Share your thoughts
placeholder
Article
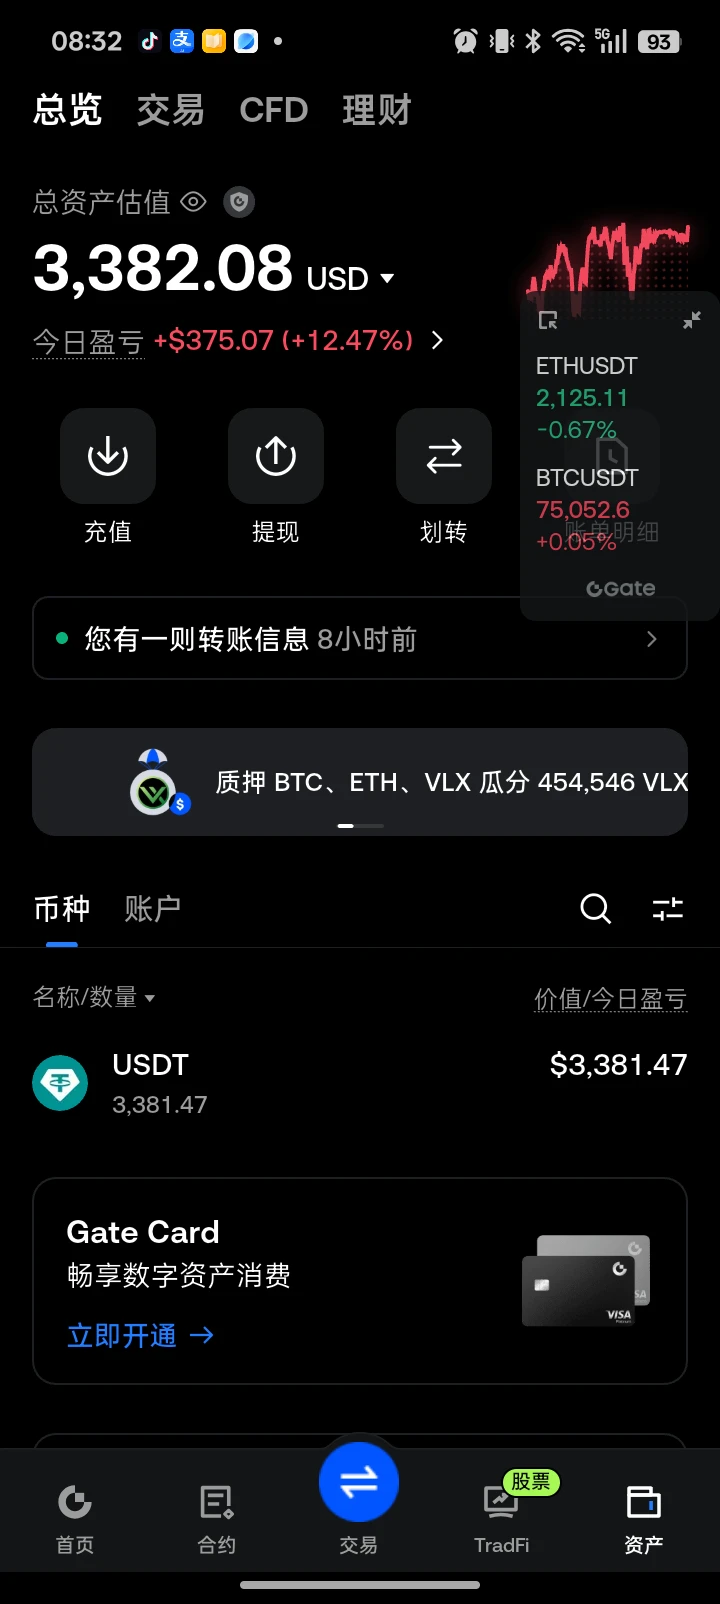
Today’s challenge: make a profit of 30,000 u with 3,000 u #山东济宁大壮哥
post-image
Tuesday morning, Nov 10 — Zhongling Gold Strategy

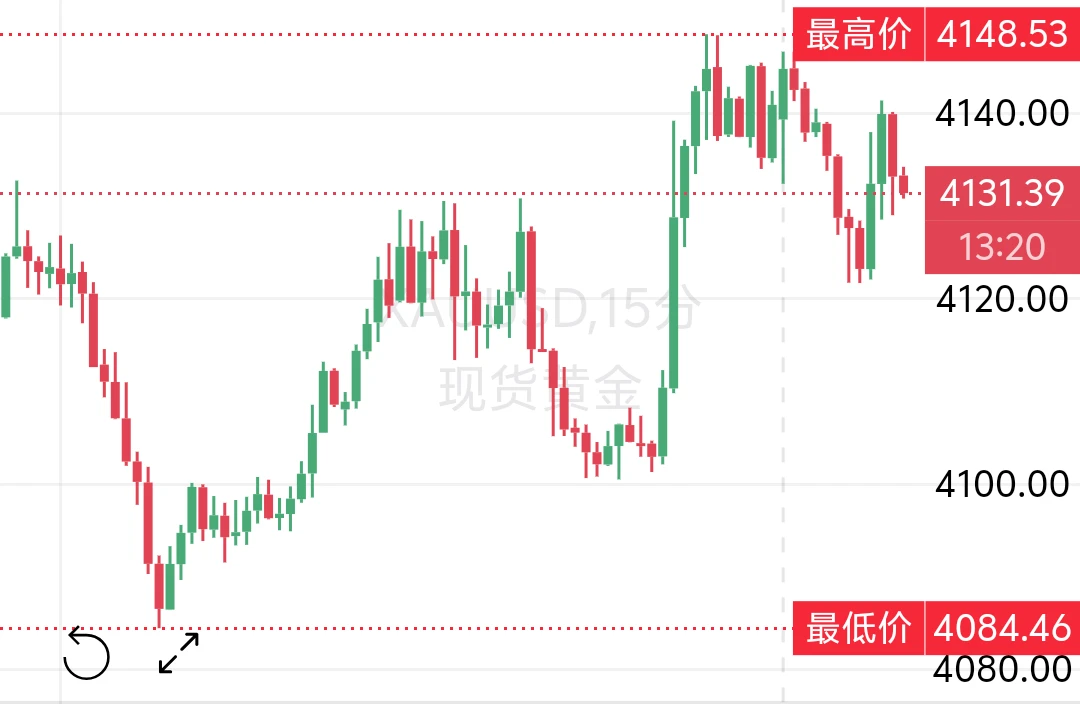
Review of yesterday’s price action: Gold rallied from an early-session low of 4054, climbed to 4134 before meeting resistance and pulling back, then touched a low of 4084 and consolidated. It stabilized and surged again in the evening.

Today, focus on the US CPI inflation data, a key recent market driver. If the data comes in above expectations, it could quickly fuel rate-hike expectations and pressure gold lower.

On the hourly chart, gold rebounded after bottoming out last night, with bullish sentiment recovering and the short-term bias tur
post-image
XAU+0.38%
BTC-0.65%
Trenches
Libra
L
bade
b
Libra
0xd2...4444
Market Cap
$.
Change
.
24h Vol
$.
Holders
.
牛逼
牛
bade
b
牛逼
0x96...7777
Market Cap
$.
Change
.
24h Vol
$.
Holders
.
PIEVERSE
P
bade
b
PIEVERSE
0x0e...25a9
Market Cap
$.
Change
.
24h Vol
$.
Holders
.
STONK
S
bade
b
STONK
6GmA...UNgx
Market Cap
$.
Change
.
24h Vol
$.
Holders
.
ON
O
bade
b
ON
0x0e...1d48
Market Cap
$.
Change
.
24h Vol
$.
Holders
.
Bitcoin short idea for the evening of 11/9: 1,000 points easily captured!
BTC-0.65%
US stocks rebounded 2.7% overnight, but Bitcoin is stuck at 75,000; it plunged through 73,500 last night, and tonight's CPI will determine the direction

Risk appetite in US stocks recovered somewhat overnight, with the Nasdaq up about 2.7% and the S&P 500 up about 2.3%. A sharp drop in oil prices eased inflation expectations, but Bitcoin failed to follow, rebounding to around 75,600 before being pushed back down. BTC was hovering around 74,900 to 75,200 in the morning, with a 24-hour high of about 75,600 and a low of about 73,750. The weekend low touched around 73,510, the lowest level since
BTC-0.65%
ETH-1.23%
SOL-0.74%
11.09 BTC Trade Review
Yesterday, I shared a short setup in advance at 75400-75800, looking for a pullback as the price faced resistance at the consolidation platform.
After reaching the range, the price stalled and came under pressure. The market moved in line with the structure, and profits were booked smoothly.
After spending a long time in this market, you learn not to bet on direction, but to identify key resistance and patiently wait for opportunities that are yours. $BTC #美国10月CPI即将公布
BTC-0.65%
This is the green OOTD that's trending online!
Save this mint-green look, everyone!
You’re welcome /////
post-image
Layout: Bitcoin, Ethereum, Dogecoin
live-cover
LIVE911
  • 1
There probably aren’t many men who could resist such an affectionate gaze from a beautiful woman, right? 🫣
post-image
Next Generation AI Chip $NVDA
post-image
NVDA-4.34%
morning update with skyvera
live-cover
LIVE1,869
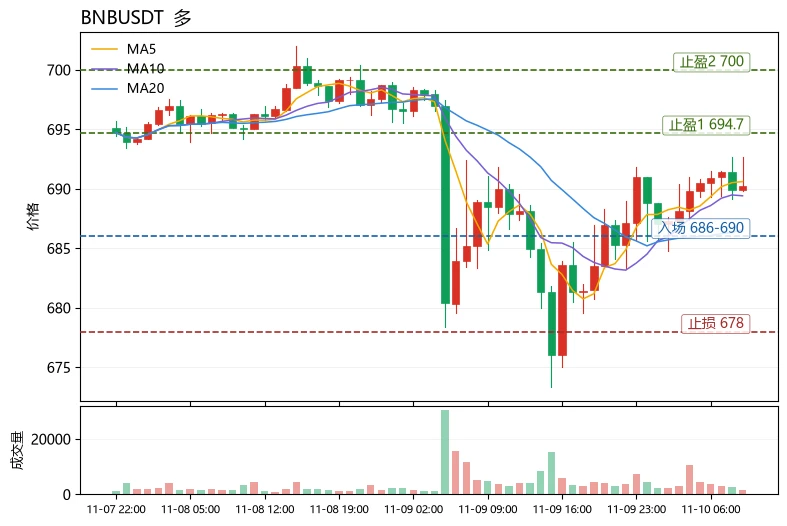
The most unusual detail in today's market action isn't the top losers, but $BNB 's funding rate: its price is up just 0.47% over 24 hours, yet longs are paying a positive funding rate (+0.0125%), while the Fear & Greed Index is only 32. Price is not overheated, sentiment is subdued, but leverage is tilted long—this is a typical “sentiment lagging positioning” setup, where a pullback after a false breakout is most likely.
Here's a reusable way to read the charts: use “moving average alignment + price position” to judge whether a trend is healthy, rather than just looking at gains and losses. MA
post-image
BNB-0.76%
TRX+0.42%
#美国10月CPI即将公布

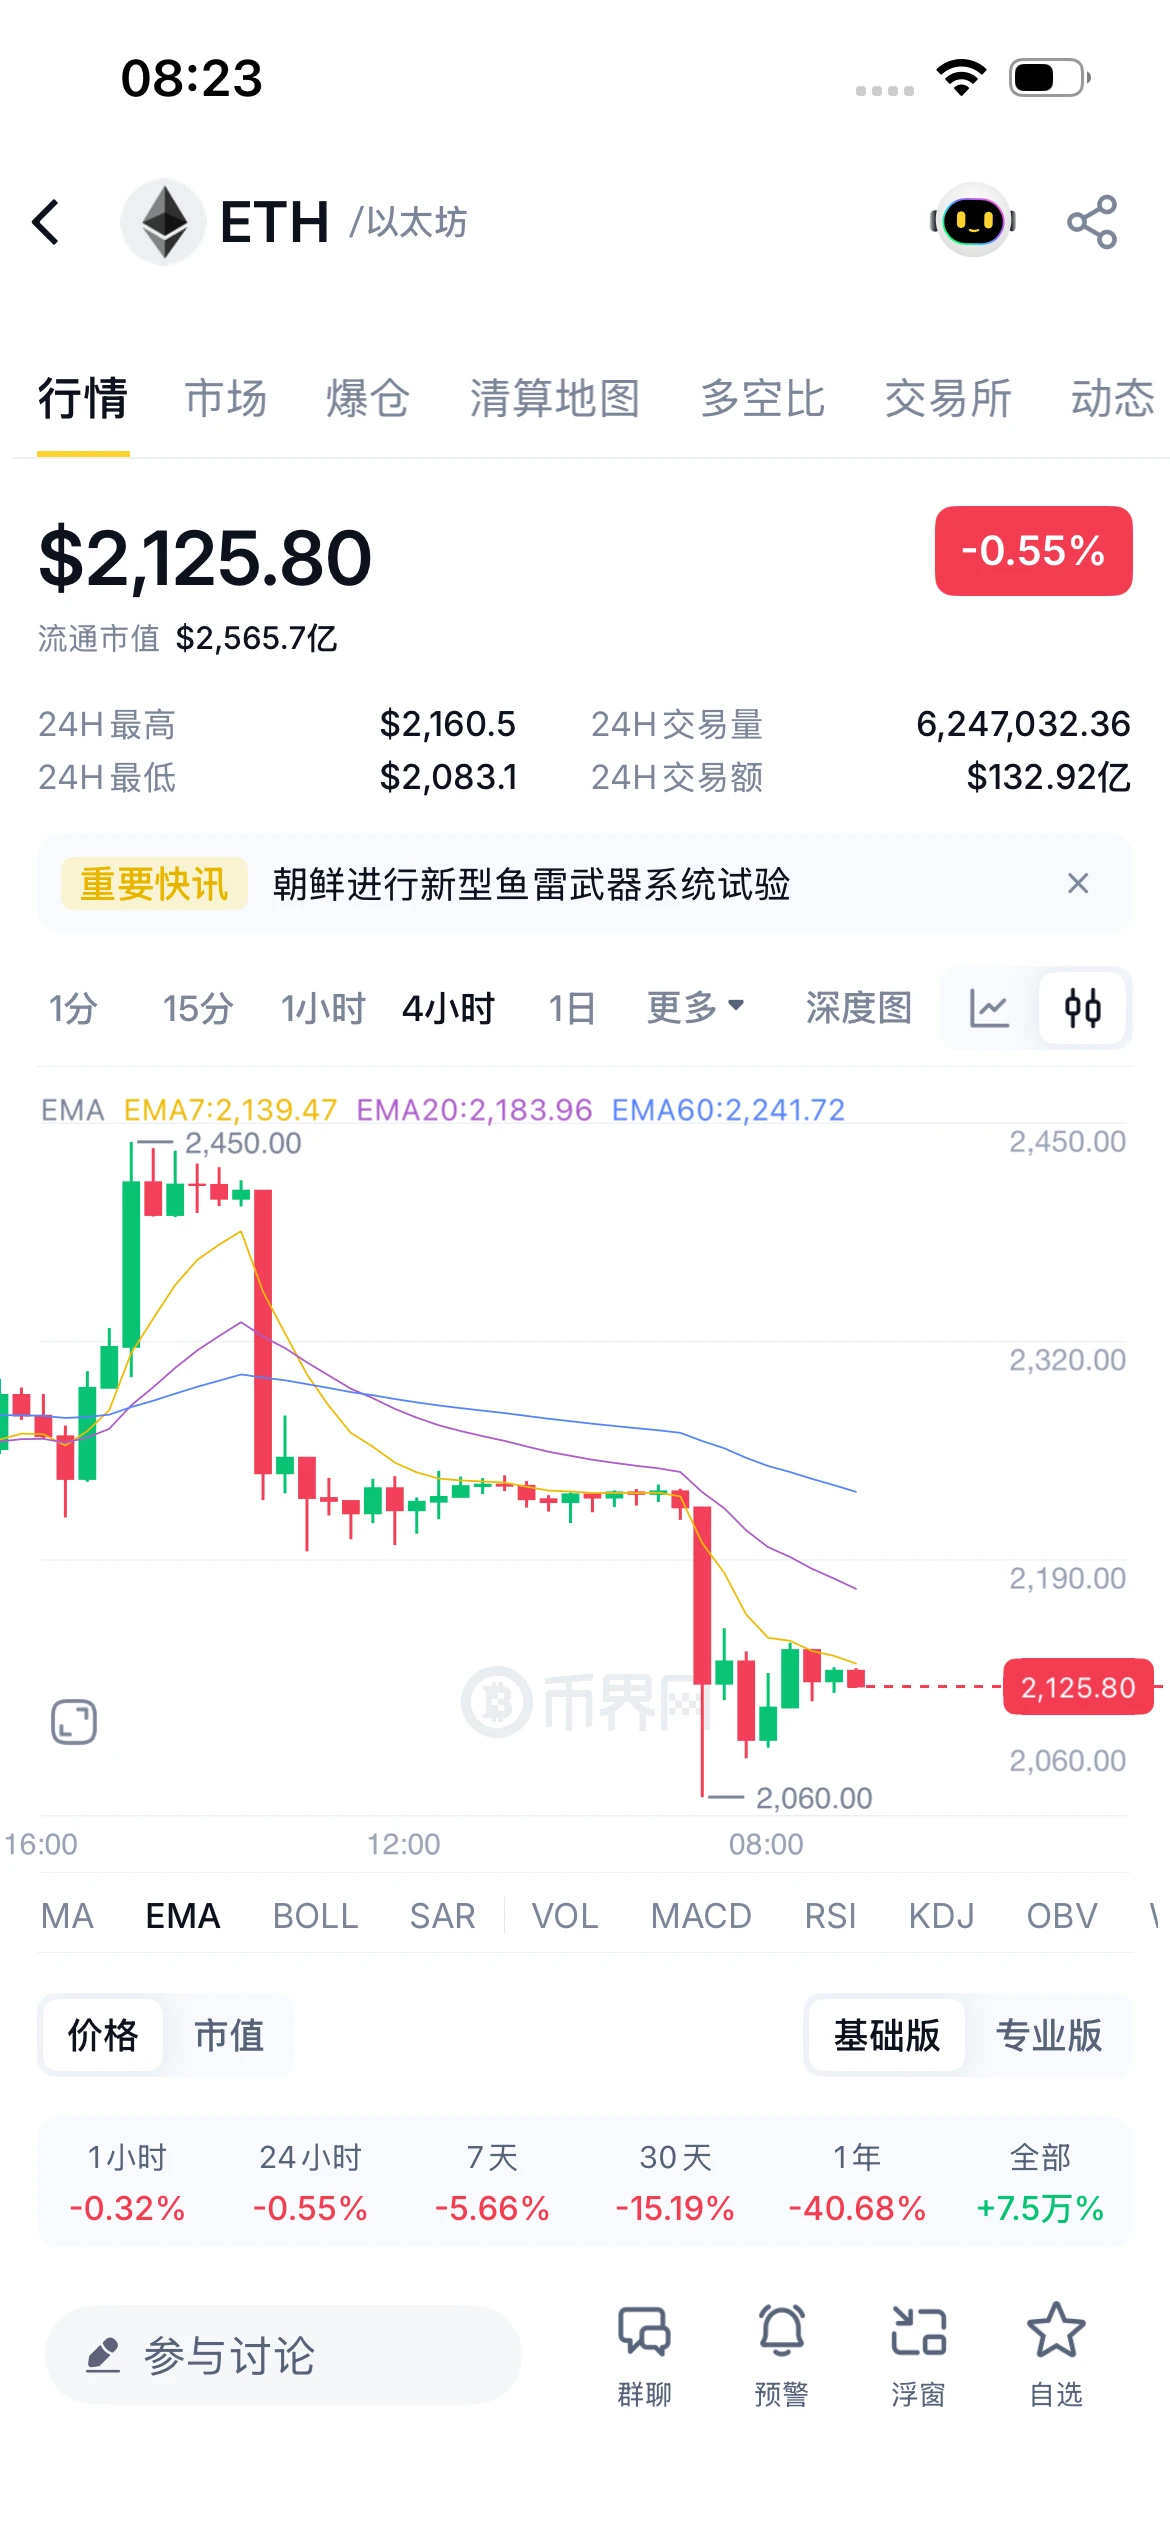
ETH weakly bounced after probing 2083; moving-average resistance remains to be confirmed

Currently at 2125.80 (-0.55%), after retreating from 2450 and bottoming at 2060, it has rebounded slightly. The 4H moving averages are bearishly aligned (EMA7:2139.47/EMA20:2183.96/EMA60:2241.72), with price still below EMA7. The short-term rebound has not changed the bearish outlook; price needs to reclaim EMA7 for initial signs of stabilization, and a break above EMA20 would be needed to discuss a reversal.

Outlook: If 2083 holds → a base-building rebound toward 2139; a break above that
post-image
ETH-1.23%
#70%OfAltcoinsFallBelow200DMA #ShareWeekly

Altcoin Market Structure Is Deteriorating: Is Capital Preparing for a Rotation or Leaving the Market Entirely?

The altcoin market is entering a critical phase, and the latest technical data deserves serious attention. According to CryptoQuant analyst Darkfost, approximately 70% of altcoins are now trading below their 200-day moving average. At the beginning of October, this figure was only around 10%. Such a dramatic shift in a relatively short period suggests that market weakness is spreading across the broader digital asset ecosystem rather than
BTC-0.67%
  • 2
  • 1
-500U to 50,000U Challenge Series-
Haste makes waste. Avoid giving back profits and steadily grind out gains! The core of trading is technical skills➕position management➕emotional management.
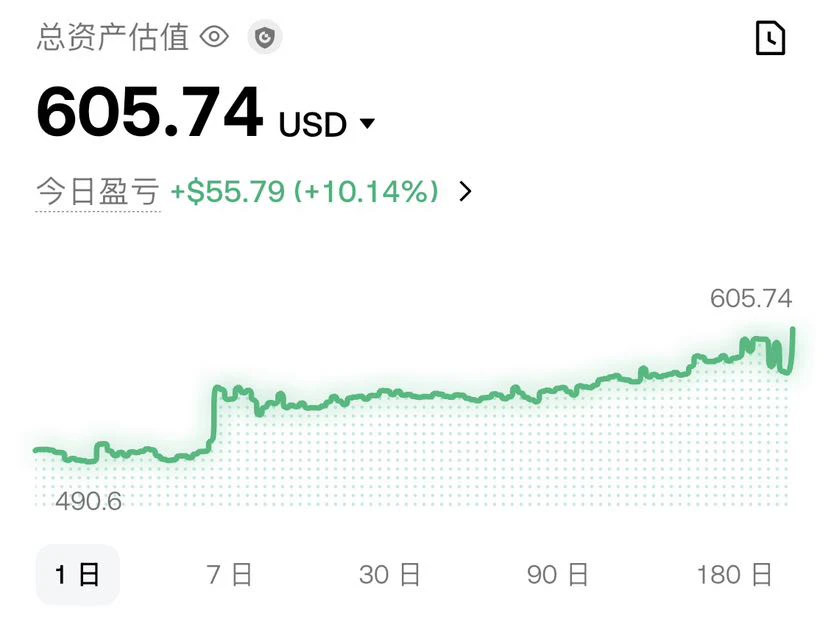
Successfully hit 600+, doubled the account and compounded further—believe in the power of compounding!
post-image
As expected, it backfired. I was up 40u but didn’t exit around 4040. The saying “make money quietly and don’t interfere with other people’s fate” is right, but I can accept it—this small pullback will help me gain more.
Livestreams these days are getting more and more outrageous.
They’re getting all their traffic by showing skin.
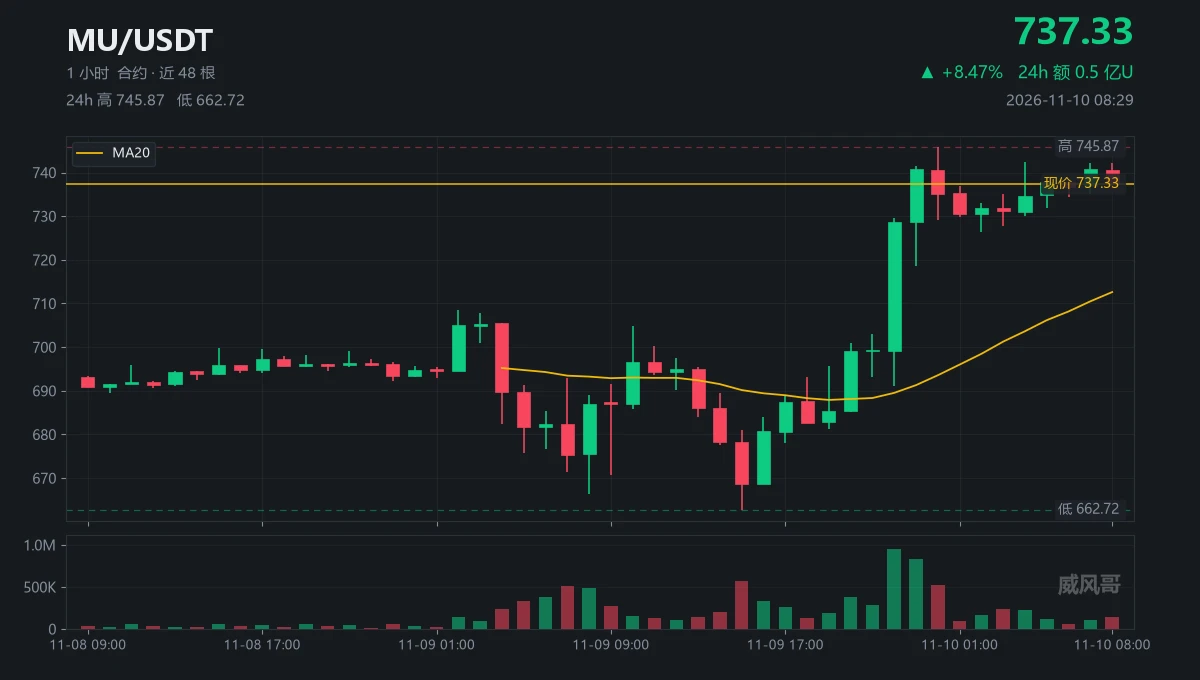
Up 8.5 points.
$MU Now at 737.33.
Eight hours, and it hasn’t moved forward another step.
The 22:00 candle traded 945k lots, 4.8 times the average volume of 196k.
At 23:00, another 827k lots came in, pushing the price up to 740.73.
If it was really in such a hurry, why did it touch 745.87 only once?
At 00:00, it touched the level and then pulled back to 735.13, leaving a 10-point upper wick.
After that, volume fell from 526k all the way to 54k.
With volume drying up and the price holding sideways, who’s placing the supporting bids?
I don’t speculate; I only go by the levels.
Get above 742.46 be
post-image
MU-0.63%
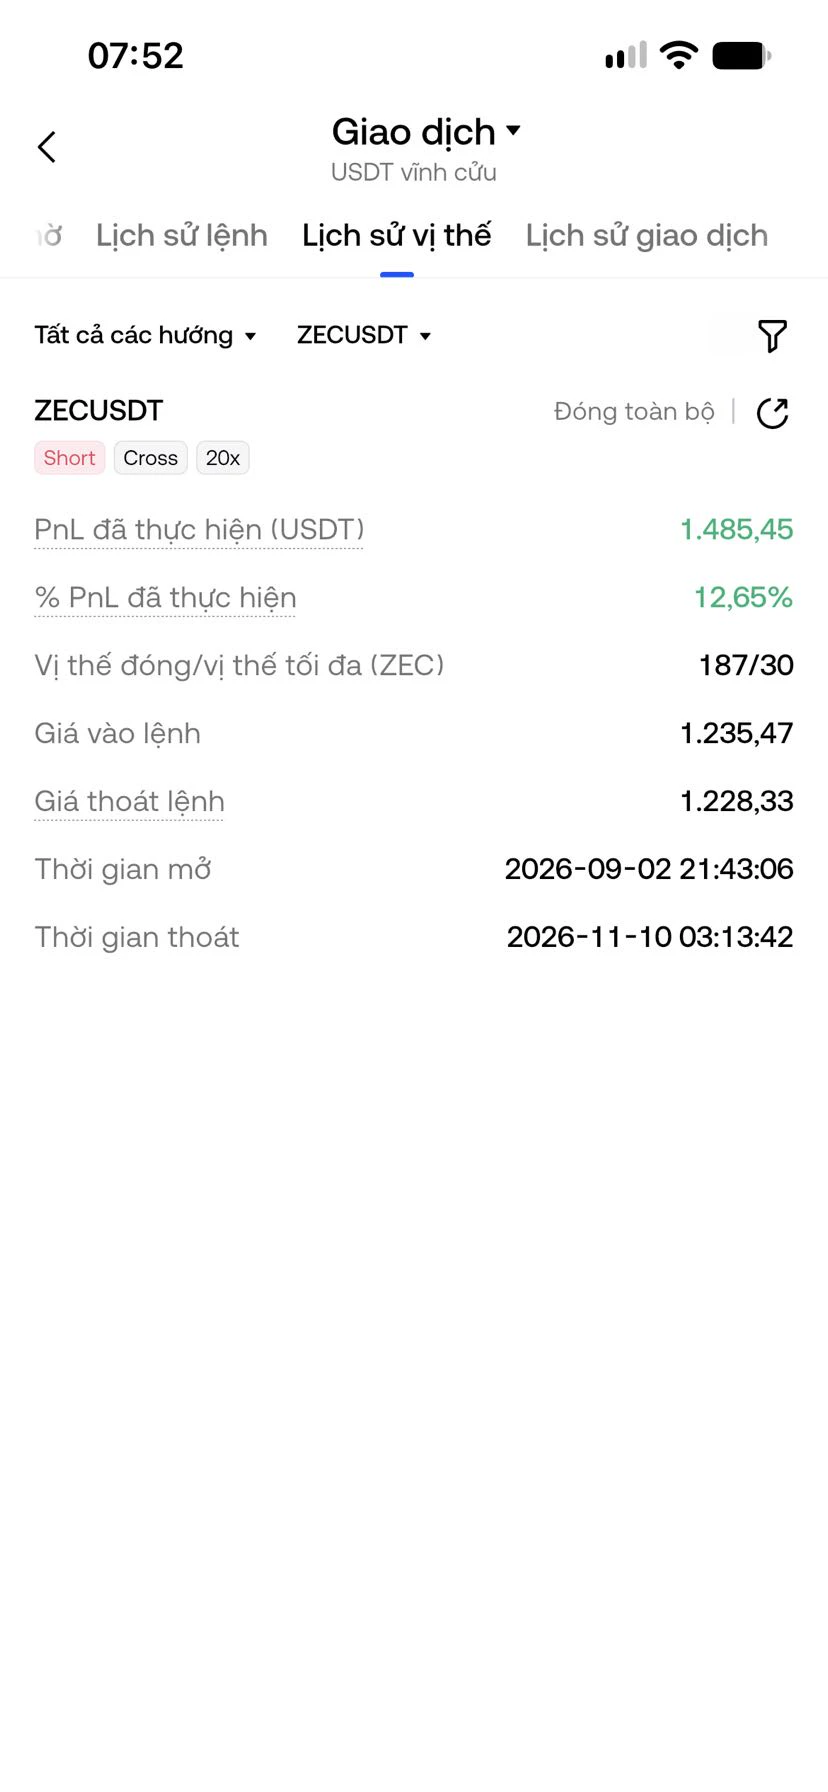
$ZEC Yesterday, I officially closed all my short positions after holding them for more than 2 months. I started shorting at 1000 with 3 tokens and added to my position. When the price climbed close to 1700u, I was temporarily down as much as 12k USDT. I then had to follow a swing-trading strategy, opening more shorts and then closing part of them. After more than 2 months, the total amount I had shorted reached 187 tokens. When I was temporarily down 12k, my short position had reached 30 tokens. I went from being down over 12k to being up over 1485u. Now I’m waiting; if it rises to 1300, I’ll
post-image
ZEC+1.16%
📊 Macro Financial Calendar | 11.10 (Beijing Time)

2026.11.10
⭐⭐⭐ Extremely high impact
✅ 21:30 U.S. October CPI and Core CPI [Today's top-tier data]

Directly affects future Fed rate expectations. Market volatility can spike sharply at release, with sudden wicks. Be sure to strictly manage position sizes and use stop-losses.

⭐⭐ Medium impact
✅ 17:00 Fed Governor Waller speaks publicly
✅ 22:35 Dallas Fed President Logan (FOMC voting member) speaks
✅ From 13:01: Continue suspending additional tariffs on some U.S. goods, retaining a 10% tariff rate for 2 months

⭐ Regular watch
✅ 07:50 Summar
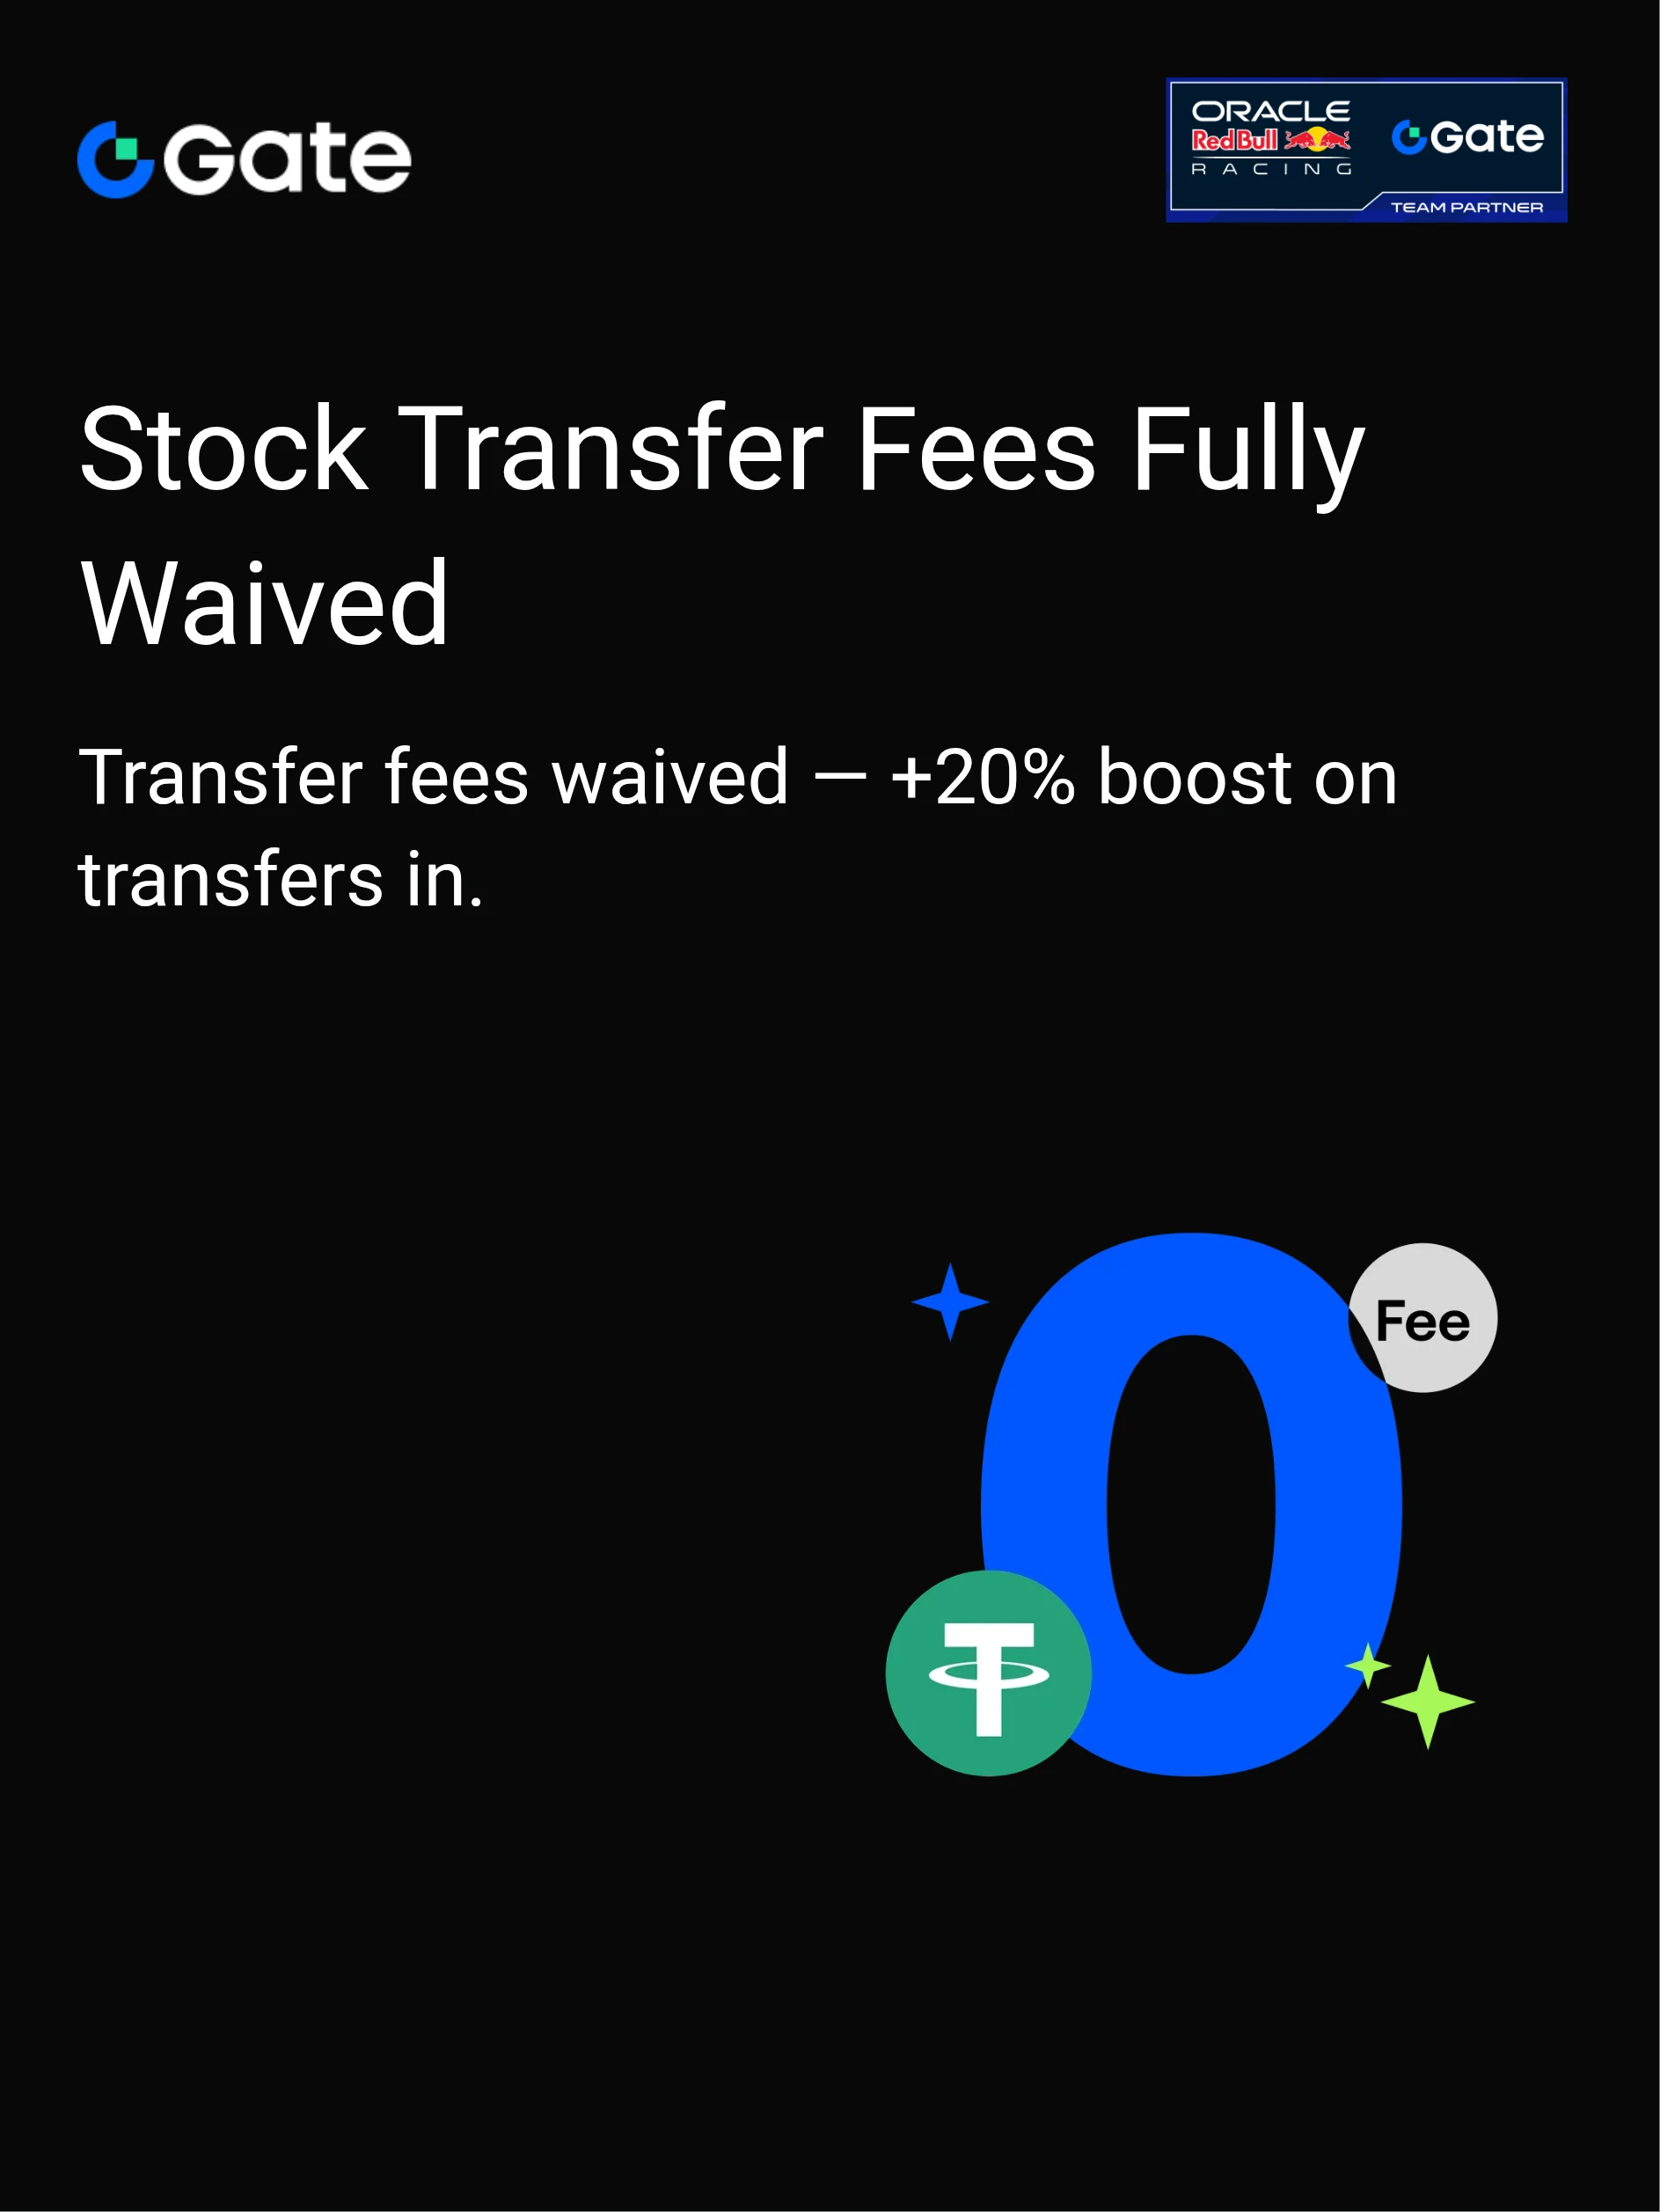
No transfer fees — get a +20% boost on incoming transfers. https://www.gate.com/campaigns/6677?ref=VLARBF1YAG&ref_type=132
post-image
Load More

Join 40 M users in our growing community

⚡️ Join 40 M users in the crypto craze discussion

💬 Engage with your favorite top creators

👍 See what interests you

Trending Topics

USCPIDataIncoming

47.01k Views2.11k Discussing

The U.S. October CPI report will be released on November 10 at 8:30 a.m. ET. September CPI came in at 3.7% year over year, and markets will be watching closely for signs that inflation is cooling, especially in core CPI. A softer-than-expected reading could strengthen rate-cut expectations, while hotter inflation may pressure risk assets through higher Treasury yields and a stronger dollar. How do you think this CPI print will move $BTC, U.S. stocks and gold?

KoreanStocksJumpOver5%

492.08k Views4.8k Discussing

RedBullDoublePodiumInBrazil

11.92k Views30.6k Discussing

View More