Share your thoughts
placeholder
Article
Everyone watching BNB upside while this indicator screams short.

$BNB /USDT - SHORT

Trade Plan:
Entry: 760.34 – 763.16
SL: 779.40
TP1: 748.52
TP2: 739.69
TP3: 726.46

Why this setup?
Why now? The daily trend is bullish yet the 1h price sits at 761.75, exactly at our entry_ref, while the 15m RSI reads 64.19 showing room before overbought. With the 1h ATR at 5.655766, the current setup respects the entry zone between 760.34 and 763.16 for a short bias. The first target is 748.52 and the second sits at 739.69, both offering meaningful risk-to-reward against the invalidation level of 732.70.
post-image
BNB+4.85%
  • 1
I had already finished complaining to my friends about this week's market, but now I have to take it all back—kind of awkward. A few days ago in the afternoon, $AKE retested and held, buying pressure strengthened, and I said not to rush into long positions; keep holding while it bottoms out as long as it doesn't break down.
First, let's look at the results: entered at 0.0101698, reached 0.0281265, return +4302.21%. It was truly sluggish at first, but the payoff was just as real once it got moving.
Panic comes from having no plan; losses come from overthinking.
Hold as long as the trend remain
post-image
AKE+85.19%
ADA+9.78%
SNDK+8.20%
To be honest, I’m surprised this trade is still alive—I felt it was a close call myself, and luck played a significant part.
A few days ago, I was watching $LAB in the early hours. It couldn’t break higher, volume failed to follow, and buying support was insufficient. I judged the setup to have strong bull-trap characteristics and called for a short from high levels.
Opened a short at 0.08529 and held through the grind down to 0.05306, with floating profit reaching +744.28%. That was a satisfying chunk of profit.
Closed 80% first, then moved the protection on the remaining position to the brea
post-image
LAB+2.20%
ZEC-0.94%
ADA+9.78%
$DOT
1.116 Who dares catch these blood-soaked chips? The big players have shaken out retail investors until they’re crying for mercy, while the old guard of public-chain L1s is pretending to be dead 😤 Shorts are pressing it down to the 1.13 mark to set a trap? I’ll hold the line anyway! 1.172 is the trigger point—break it and the shorts get stampeded 🤯 If you’re not getting in now, don’t shamelessly chase after it once it takes off! 🚀
post-image
DOT+6.12%
Everyone is about to get wiped on SYMBOL right now.

$PEPE /USDT - SHORT

Trade Plan:
Entry: 0 – 0
SL: 0
TP1: 0
TP2: 0
TP3: 0

Why this setup?
Why now? The daily trend is a range, meaning SYMBOL has been stuck in a tight band and sellers are finally stepping in with conviction. The 15m RSI sits at 61.94, which is still elevated but rolling over fast enough to confirm that momentum is shifting into the shorts we are positioned for. The 1h ATR is reading 0.0, so the recent candles have compressed into near-zero volatility, and that compression is exactly what precedes a sharp directional move
PEPE+6.26%
#NEARSurgesOver21Breaking3 NEARSurgesOver21Breaking3 — NEAR Is Back Above a Critical Psychological Level
NEAR Protocol just delivered the kind of move that forces the market to pay attention.
NEAR surged more than 21%, breaking above the $3 psychological level and placing the asset firmly back on the radar of traders, developers and investors watching the next phase of the Layer-1 market.
A move of this magnitude is not simply another green candle.
It is a reminder that crypto markets can rapidly reprice assets when momentum, liquidity, ecosystem development and market sentiment begin moving i
#ZECKeepsRisingBreaking1500 ZEC Keeps Rising — Breaking $1,500 and Rewriting the Zcash Market Narrative
Zcash just crossed another psychological milestone — and this rally is becoming impossible for the broader crypto market to ignore.
ZEC has surged above $1,500, extending one of the most dramatic rallies in the cryptocurrency market during September 2026. The move pushed Zcash to levels not seen in years, with the token reaching an intraday high around $1,535 before pulling back toward the mid-$1,400s.
What makes this move particularly significant is the speed.
ZEC has risen from roughly $47
long the top type shi
post-image
"I'm waiting on a dip for an entry on $CATS !"
The dip on $CATS
post-image
my Bias for $XAU for the coming week
4hr candle rejection at 4420..30.levels sells are valid ,Target 4260..4220
Body close above 4430 buys continue, target 4560..4580 fvg on the 4hr Timeframe
Nfa
XAU+0.88%
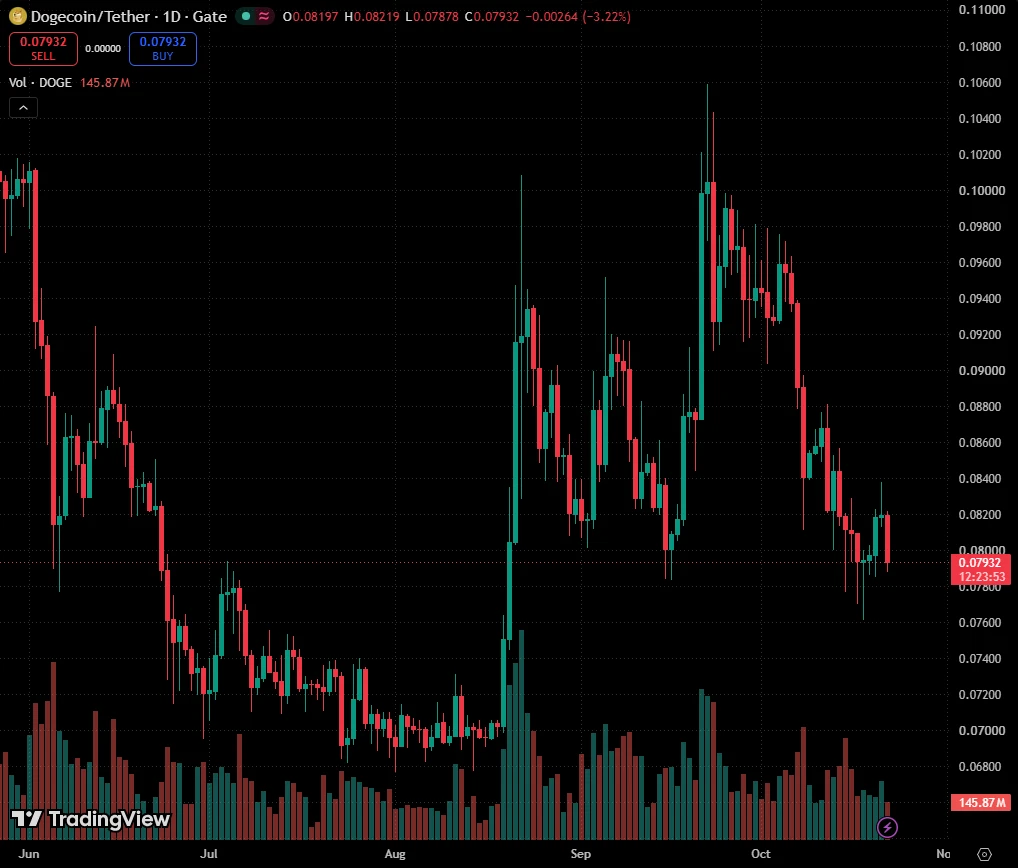
Layout for Bitcoin, Ethereum, and Dogecoin
live-cover
LIVE2,034
$SHIB Current price 5.46e-06, 24h +5.61%, with trading volume of only 6.6M USDT. MA5 has crossed above MA20, RSI 68.1 is nearing overbought, the MACD histogram at +1.349e-09 remains bullish, and the Bollinger upper band at 5.54622e-06 is within reach. The 30-candle price range is 8.79%. The Fear and Greed Index is 56, in the greed zone. Assessment: Short-term bias is bullish, but the risk of chasing highs is high. Volume is insufficient to support an effective breakout, so consolidation after resistance at the upper band is more likely.
In terms of position management, entering with a full po
post-image
SHIB+5.67%
DOT+6.12%
Mrket Updates
live-cover
LIVE555
SUI is range-bound all day, but a quiet breakout could crush longs.

$SUI /USDT - SHORT

Trade Plan:
Entry: 0.7991 – 0.8047
SL: 0.8368
TP1: 0.7757
TP2: 0.7583
TP3: 0.7322

Why this setup?
Why now? The daily trend is range, which often compresses before a directional move, and the 1h ATR of 0.011177 shows enough volatility to push price to the targets. The 15m RSI at 52.86 is neutral, so the bias is not overbought yet, and the 1h price sitting at 0.8019 aligns perfectly with the entry zone of 0.7991 to 0.8047 for a short. A move to TP1 at 0.7757 captures the first leg of downside, with TP2 a
SUI+9.45%
I didn't make any judgment call—I just held it a little longer. I didn't expect it to actually reward me. When I opened the market screen this morning, $ETHFI funds quietly entered, and the pullback held. I said not to touch the long position yet and let it play out on its own.

Floating P&L +3662.23%, entry price 0.4789, current price 0.726. The timing was spot on, so everyone on board should have woken up laughing.

The prerequisite for compounding is staying alive; the shortcut to getting rich is often going to zero.

Have a strategy before the market opens, discipline during the sessio
post-image
ETHFI+19.26%
SOL+11.46%
LAB+2.20%
Why Did Tech Rally While the Fed Raised Rates?
The Fed raised rates, and tech stocks still rallied.
Every textbook says the opposite should happen.
The explanation comes down to one thing: the gap between what the market had priced in and what it actually got.
On 16 September, the Fed raised its policy rate by 25 basis points to 3.75–4.00%. The decision was unanimous at 12–0 and marked the first hike since 2023. Projections point to one more increase before year-end. August CPI came in at 3.4% year on year with core inflation at 2.4%, and nonfarm payrolls beat expectations at +162,000. The mac
post-image
xxx40xxx
One Day, +14.9%: Is This a Turn, or Just a Bounce?
One stock jumped 14.9% in a single session.
Most of the market read it as the return of the AI rally.
But the central bank raised rates the same week — so where did the buying really come from?
On Thursday, 17 September 2026, all three major US indices closed higher. The Nasdaq Composite gained 1.7% to 26,418.30, the S&P 500 added 1.1% to 7,637.76, and the Dow Jones rose 0.6% to 51,778.04. The day belonged to AI names: Tempus AI (TEM) climbed 14.9%, Super Micro Computer (SMCI) 9.5%, Astera Labs (ALAB) 9.0% and Arm Holdings (ARM) 8.5%. The semiconductor index added 3.1%.
Step back, though, and the numbers tell a different story. Over the full week the Nasdaq was up just 0.3%, while the Dow was down 1.5%. What we have is not a trend change but a powerful one-day surge.
The reason is that each of the four stocks carried its own company news: a growth message from Tempus AI management at a healthcare conference, record order intake at Super Micro, a new memory controller from Astera Labs, and a data-centre chip target at Arm.
The takeaway is blunt: headlines amplify moves, data supplies context. In Web3, analysts who read on-chain liquidity before the headline apply exactly the same discipline here.
So are these four really part of one story? The answer is more uncomfortable than it looks — Article 2 goes straight at it.
This content is not investment advice. Always perform your own research before making financial decisions.
$BTC $GT $ETH
#Gate广场中秋团圆局 #美股AI概念股全线反弹 #USAIConceptStocksRally #JapanRealEstatePowerChipStocksRise #GateSquareMidAutumnReunion
repost-content-media
UBS-0.10%
  • 4
  • 1
#每周来晒 #Where should idle money go when the bull-bear direction is undecided?
My approach is to set rules in advance and follow them when the time comes, rather than making decisions on the spot.
Step one: Confirm the signal before taking action. I don't want to build a full position before the direction is confirmed. If the market turns bullish, ETH will be the first asset I watch—not because it will necessarily rise the most, but because its price action often confirms whether the market's risk appetite has truly returned.
Step two: Rotate positions in stages instead of going all-in at once.
post-image
ETH+6.47%
GUSD-0.02%
  • 7
$MYX Signal】Long + 1H high-volume breakout with wick retest
$MYX After the 1H high-volume breakout, price is hovering at the highs. The 4H MACD histogram is expanding at 0.0033, while the 1H histogram continues rising at 0.0048. The 1H RSI is 84.25, and the 4H RSI is 92.47. Price has surged above the 1H Bollinger upper band at 0.0971, leaving the 4H upper band at 0.0812 far behind. Order book depth is -30.48%, with a bid/ask ratio of 0.53 and heavy sell orders overhead. 4H volume is 749M, while the 1H late-stage volume is 143M. Selling pressure is being absorbed quickly, but buying support h
post-image
MYX+34.10%
Old friend ETH, as the barometer for altcoins, means that if ETH fails to stabilize, many strong altcoins will still be unable to make a major move. ETH’s overall structure is bullish, but attention should be paid to the high-pressure zone near 2600 on the daily chart, with caution warranted for a pullback after a surge. Longs should reduce positions and lock in profits in time. I also opened a long following BTC just now. Seeing that it had repeatedly failed to break below 2480 and began to stabilize and rebound after pulling back to around 2490, I decisively entered a long. Unexpectedly, its
post-image
ETH+6.47%
BTC+5.68%
$7.3k an HOUR keeps the 9-5 away $SPY
post-image
SPY-0.32%
Load More

Join 40 M users in our growing community

⚡️ Join 40 M users in the crypto craze discussion

💬 Engage with your favorite top creators

👍 See what interests you

Trending Topics

JapanRealEstatePowerChipStocksRise

58.56k Views3.5k Discussing

Japan's Nikkei extended gains on Sept 18, with real estate, power, and semiconductor sectors leading. Gate covers over 12,800 global stocks and ETFs, offering one-stop USDT trading across US, HK, Korean, and Japanese markets. [👉 Read more](https://www.odaily.news/en/newsflash/518749)

USAIConceptStocksRally

33.39k Views466 Discussing

GateTopsStockPerpetualCoverage

37.54k Views2.31k Discussing

View More