Square
Following
Hot
News
Profile
Share your thoughts
placeholder
Article
new stimers
live-cover
LIVE2,390
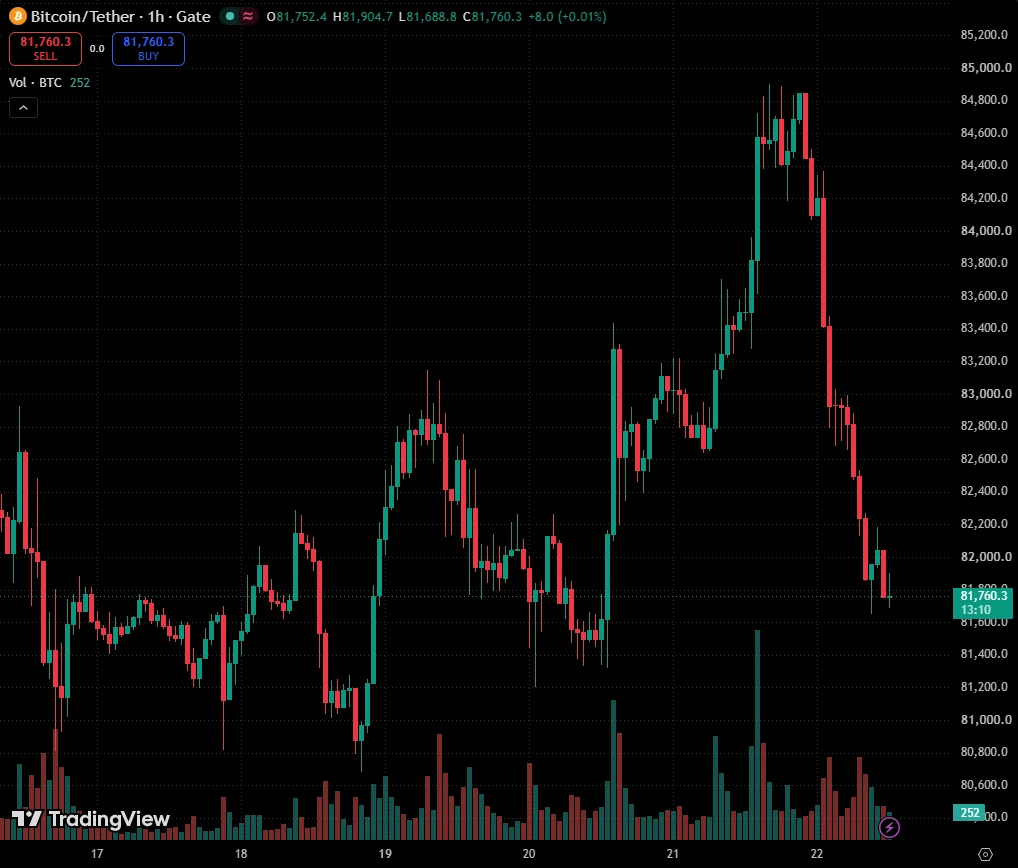
$BTC BTCUSD 1H | A Key Moment for Bitcoin — Bounce or Breakdown?
Bitcoin has taken a sharp hit after getting rejected near the $84,400–$84,700 supply zone. Now price is testing the rising trendline, and I’m watching closely to see what happens next.
Here are the two scenarios I’m keeping an eye on
Bullish scenario
If buyers manage to reclaim the $82,000–$82,400 area and hold above it, we could see a recovery toward $82,800 first, followed by $83,200. I’d like to see a proper close and retest before giving this scenario more weight.
Bearish scenario
If the rising trendline and the $81,600 ar
post-image
BTC-2.46%
Trenches
Kimchi
K
bade
b
Kimchi
CSoc...pump
Market Cap
$.
Change
.
24h Vol
$.
Holders
.
CYBER
C
bade
b
CYBER
CMo7...pump
Market Cap
$.
Change
.
24h Vol
$.
Holders
.
PANGEA
P
bade
b
PANGEA
JAFq...Y6ea
Market Cap
$.
Change
.
24h Vol
$.
Holders
.
Dacity
D
bade
b
Dacity
nxPq...pump
Market Cap
$.
Change
.
24h Vol
$.
Holders
.
AGT
A
bade
b
AGT
0x5d...e274
Market Cap
$.
Change
.
24h Vol
$.
Holders
.
BTC continued to retreat after surging on the one-hour chart, falling below the Bollinger midline as the bands expand downward and a bearish structure takes shape. The slight stabilization at current lows is merely a weak recovery during the decline, with no sign of a bottom or reversal. Correlated coins are weakening in sync, market support is weak, and short-term rebound potential is limited, with the Bollinger midline serving as key resistance. The strategy is to follow the trend and look for short positions, waiting for a rebound to stall before entering. If support at the Bollinger lower
post-image
BTC-2.46%
AMD up 3.4%, Nvidia up 2.5%! How long can the AI chip rally stay hot?
AI chips have once again taken center stage in the US stock market! AMD rose 3.4%, Nvidia rose 2.5%, and the Nasdaq closed up 1.05%. Looking at these figures, many people are already wondering: could the next rally once again emerge from chip stocks?
I. Demand for computing power remains the key focus.
AI model training, inference, and data center construction all require computing resources. As long as companies keep investing, chips and related infrastructure will continue to have growth opportunities.
But remember, a prom
META+0.57%
  • 11
AMD rises 3.4%, Nvidia rises 2.5%! Chip stocks rebound across the board, but the real opportunity may not be at the top of the gainers’ leaderboard
U.S. tech stocks are buzzing again! The Nasdaq is up about 1.05%, AMD is up about 3.4%, and Nvidia is up about 2.5%. Chip stocks are back in favor with investors, and the AI value chain is once again in the market spotlight.
Seeing a market like this, many people’s first reaction is: jump in now—don’t miss the next big rally!
Not so fast. The stock market isn’t a bus: missing one ride doesn’t mean you’ve reached the end of the road; getting on the
GER40-0.33%
  • 37
While running on the bridge, I suddenly remembered how awful it feels to lose money and wanted to jump off
post-image
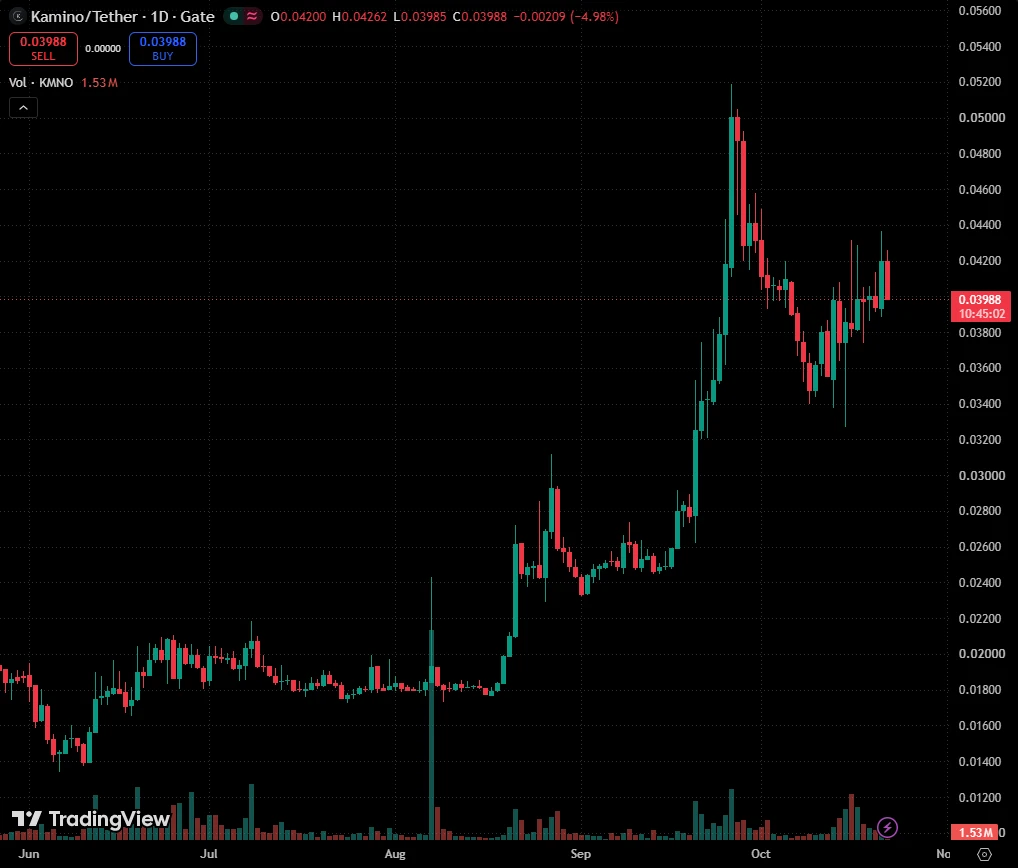
$KMNO KMNOUSDT Forming Bullish Continuation
KMNOUSDT is showing strong signs of a bullish continuation on the daily chart after completing a clean retest of its key support block. Following an initial impulse wave and an orderly multi-week pullback, the price tapped right into this former resistance-turned-support zone and immediately held its ground. The formation of a higher low directly inside this demand area shows that the corrective phase is running out of steam while buyers step back in to protect the trend. With the structural floor intact, the chart maps out a projected upside extensi
post-image
KMNO-5.83%
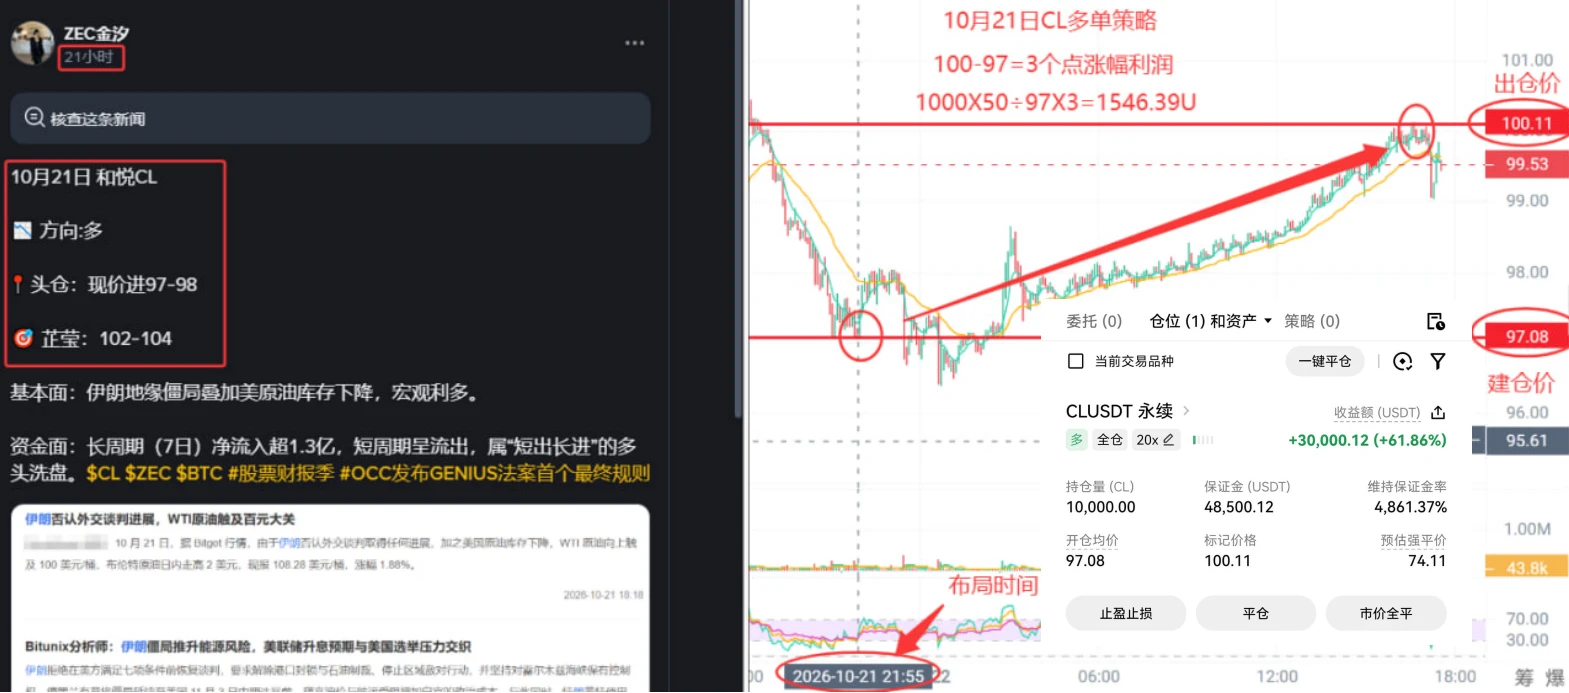
$CL Core rationale for building a long position:
Fundamentals: Iran’s geopolitical standoff combined with a decline in US crude oil inventories sets a “macroeconomically bullish” tone.
Capital flows: Net inflows over the 7-day long-term period exceeded 130 million, while short-term flows were out, interpreted as a “long shakeout” by major players. $SPCX $MU
post-image
CL+2.43%
SPCX+7.65%
MU+1.98%
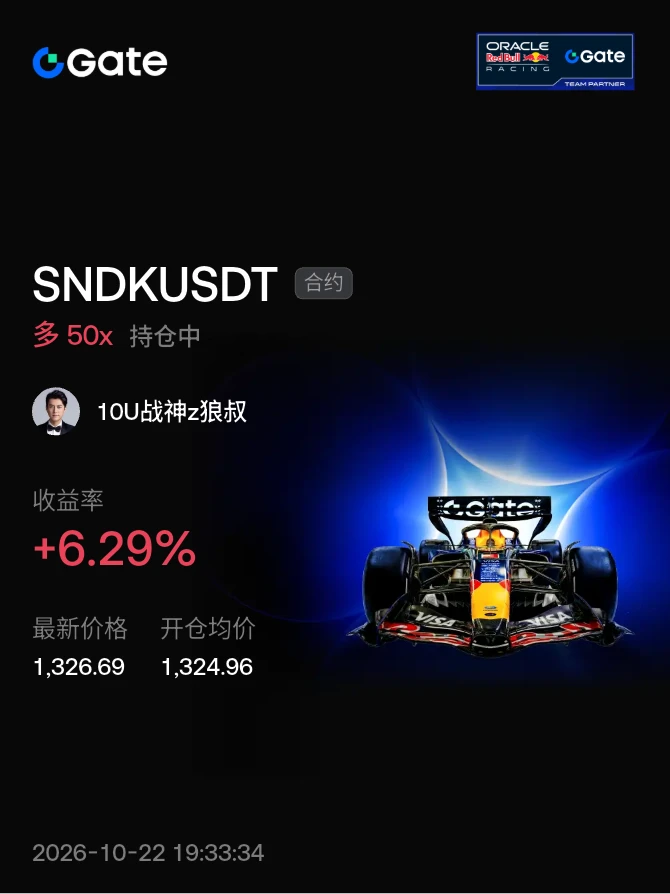
#晒出我的持仓收益 Guys, we're building our positions and getting to work, #sndk —go long for me!!!
post-image
SNDK+0.88%
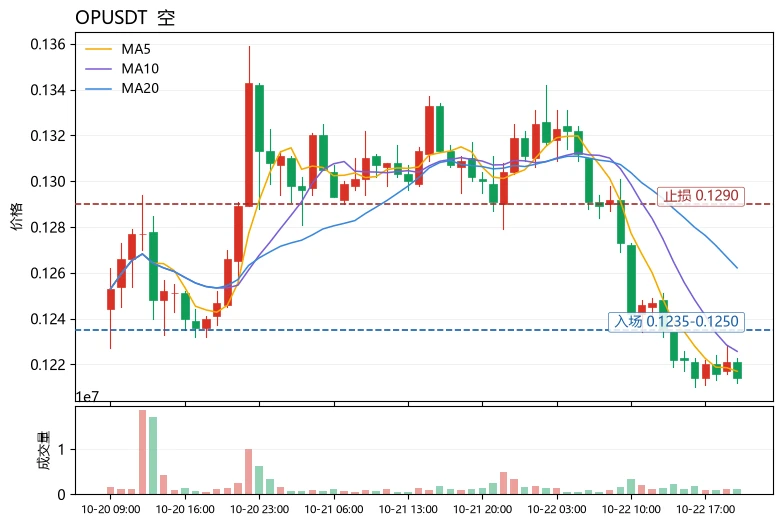
$OP Current price 0.1214, key resistance 0.1262 (MA20), key support 0.1179 (lower Bollinger Band). The bearish alignment is clear: MA5=0.1217 is below MA20=0.1262, the MACD histogram remains negative at -0.0004716, and the price is trading near the lower Bollinger Band at 0.117922. The range over 30 candles is about 10.87%, forming a weak, lower-range consolidation. Notably, RSI=29.8 has entered oversold territory, and with the funding rate at -0.0150%, the cost of holding short positions is relatively high. A technical bounce is possible in the short term, but until the price decisively recla
post-image
UNI-6.16%
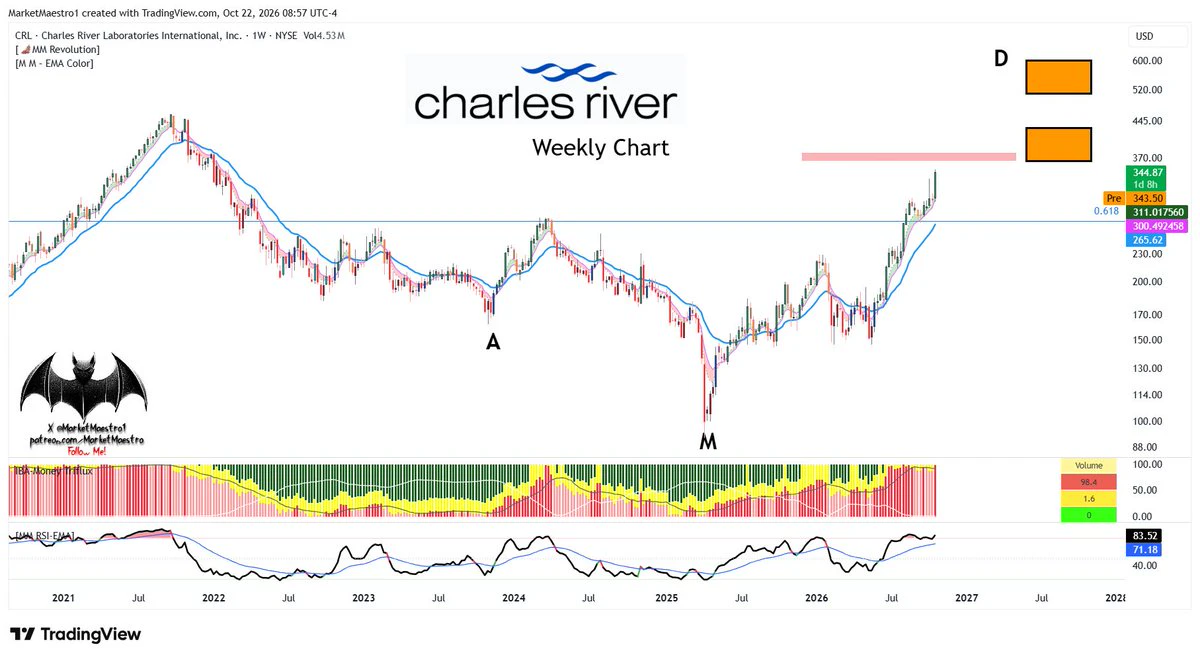
$CRL
There is a bullish AMD pattern, and it is in the D phase
post-image
CRL+9.26%
AMD+3.38%
The choices of traders and institutional capital are always the market’s most accurate barometer.
What caught my attention most in Gate’s 2026 Q3 report was this set of figures: September derivatives trading volume reached $396 billion, surging 38.2% month over month and securing a spot among the global top three.
To be honest, the derivatives market has always been one of the most fiercely competitive sectors, where “hard power” matters most. Marketing alone can hardly deliver sustained growth. There are two very practical reasons why capital is flowing in faster:
✅The positive feedback loop
post-image
RWA-1.02%
  • 3
  • 1
Listed some ready-made Muse accounts, 12R each
A small tip: it's best not to stockpile these accounts; warranty is for the first use
Portal:
post-image
MUSE+8.07%
Why might an original profit advantage disappear as more people use similar strategies?
Suppose you discover a trend-following strategy.
In the past, this strategy could enter early as a trend formed, exit before the market reversed, and generate solid returns.
But after some time, you notice:
The same signals lead to increasingly worse entry prices; stop-losses are triggered more easily; and trading opportunities that once covered costs leave less and less profit.
The strategy’s code hasn’t changed. So why have the results changed?
One possible reason is that market participants’ behavior has
post-image
  • 4
The people who continue to build in the bear market will win in the bull market!
post-image
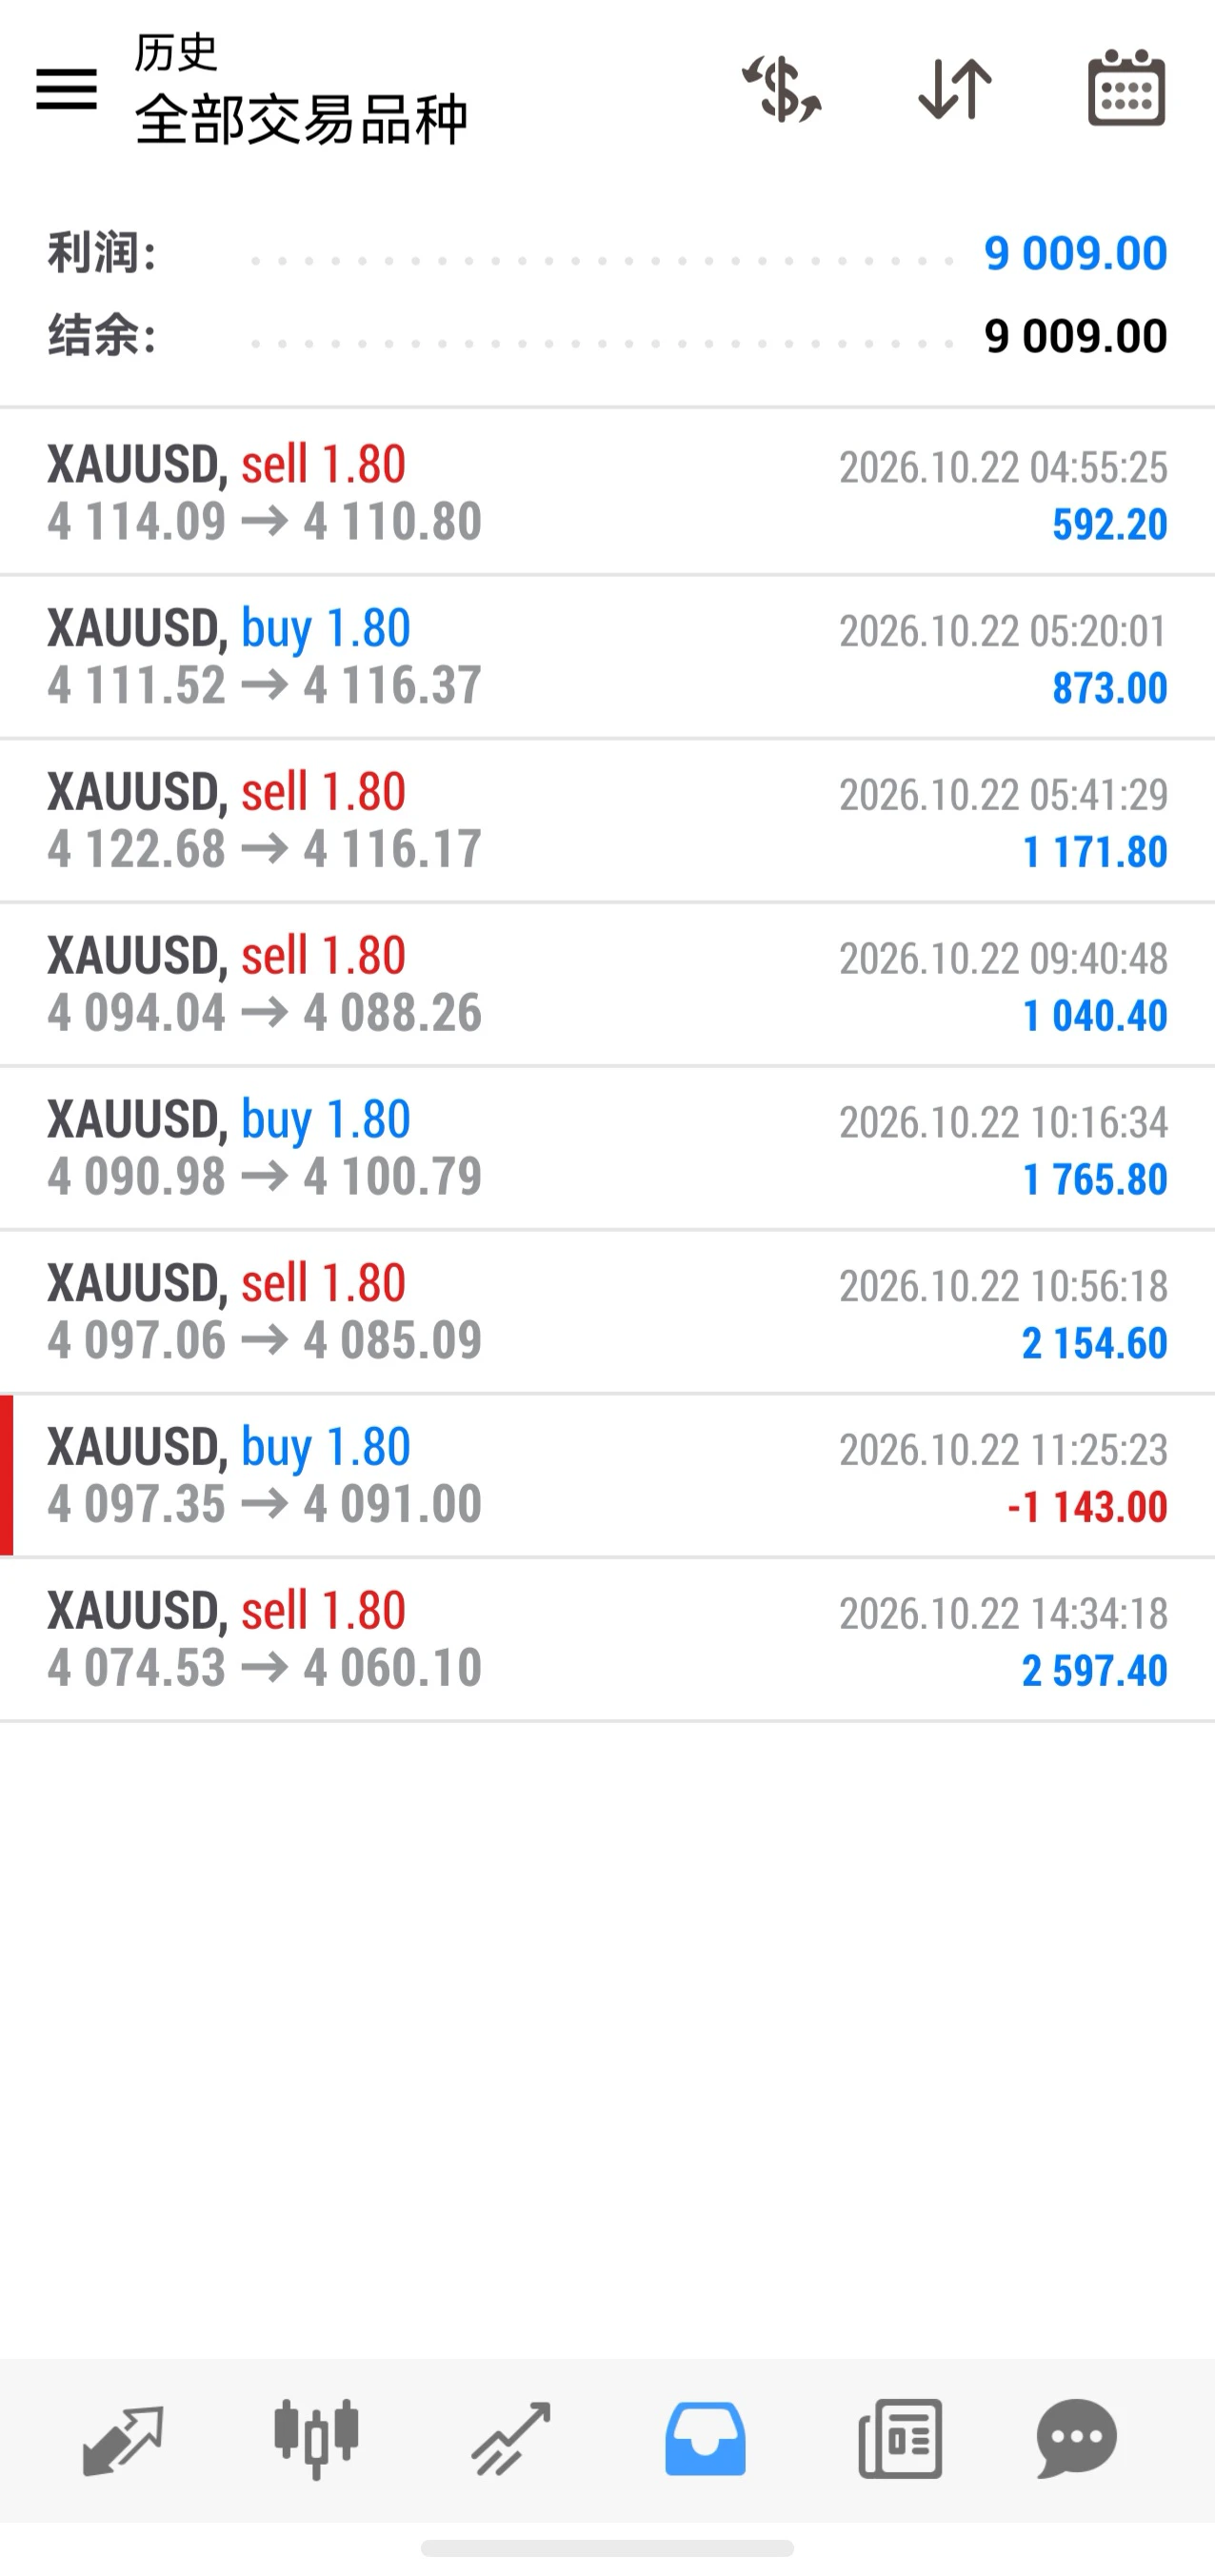
Intraday gold progress:
Trade 5️⃣✅, went long at 4090-4100, secured 10 points, $1765!
Trade 6️⃣✅, went short at 4097-4085, secured 12 points🍐, $2154!
Trade 7 was stopped out; went long at 4097-4091, -6 points, -$1143.
Trade 8️⃣✅, went short at 4074-4060, secured a 14-point move🍐, $2597!
#黄金 #美股AI和加密概念上涨 $BTC $ETH
post-image
BTC-2.56%
ETH-3.53%
$XAI #XAI
Testing crucial resistance of Falling Wedge on Weekly Chart.
Breakout could trigger 2-3x recovery move during ongoing quarter✍️
XAI-1.78%
Anthropic Generates $16.3 Billion in Just Six Months! With Future Computing Commitments Potentially
live-cover
LIVE3,271
Load More

Join 40 M users in our growing community

⚡️ Join 40 M users in the crypto craze discussion

💬 Engage with your favorite top creators

👍 See what interests you

Trending Topics

GateQ3ReportReleased

3.66k Views3.56k Discussing

Gate released its Q3 2026 report, with September derivatives trading volume reaching $396 billion, up 38.2% MoM, while spot trading volume reached $48.8 billion. The platform now covers more than 12,800 global stocks and ETFs. With trading and broader financial services expanding together, what could drive Gate’s next phase of growth? [👉 Full report](https://www.gate.com/announcements/article/102375)

MetaEarningsBeatExpectations

4.99k Views512 Discussing

USAIAndCryptoStocksRise

20.14k Views8.41k Discussing

View More