Square
Following
Hot
News
Notifications
Profile
Share your thoughts
placeholder
Article
#BitcoinDropsBelow$70K
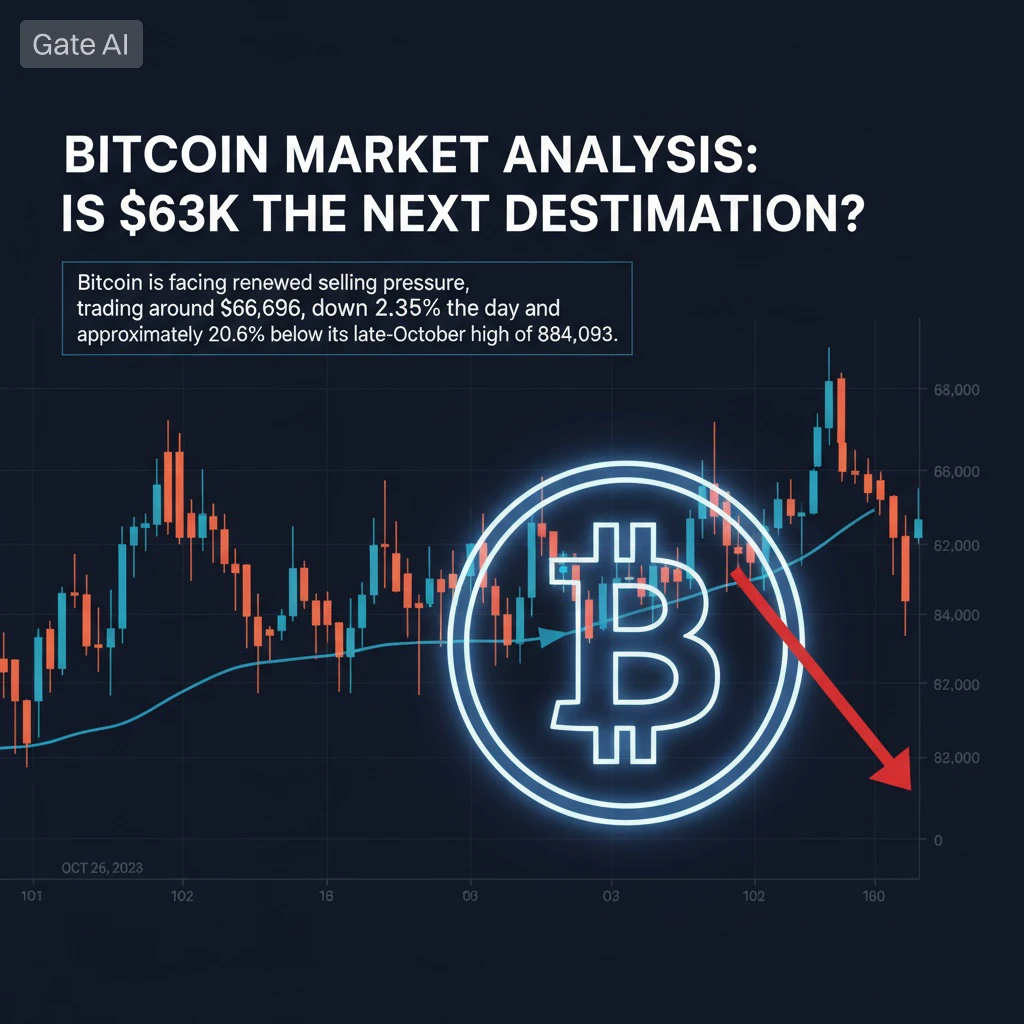
Bitcoin Market Analysis: Is $63K the Next Destination?

Bitcoin is facing renewed selling pressure, trading around $66,696, down 2.35% on the day and approximately 20.6% below its late-October high of $84,093.

This is no longer just a routine correction. BTC has broken a major technical support level, institutional flows have weakened, and macroeconomic uncertainty is putting additional pressure on risk assets.

What's Behind the Sell-Off?

Three major factors are driving the current weakness:

1. Institutional Outflows

US spot Bitcoin ETFs recorded approximately $1.2
post-image
BTC-0.67%
  • 9
  • 1
This is exactly what I want: the best life
I made a website to record every day of our lives
and every step of our future lives
Hehe
post-image
Trenches
mihao
m
bade
b
mihao
4Cxj...pump
Market Cap
$.
Change
.
24h Vol
$.
Holders
.
FOOD
F
bade
b
FOOD
FTu5...pump
Market Cap
$.
Change
.
24h Vol
$
Holders
.
IDOL
I
bade
b
IDOL
0x3b...ab07
Market Cap
$.
Change
.
24h Vol
$.
Holders
.
Sakura
S
bade
b
Sakura
9sFG...pump
Market Cap
$.
Change
.
24h Vol
$.
Holders
.
AGT
A
bade
b
AGT
0x5d...e274
Market Cap
$.
Change
.
24h Vol
$.
Holders
.
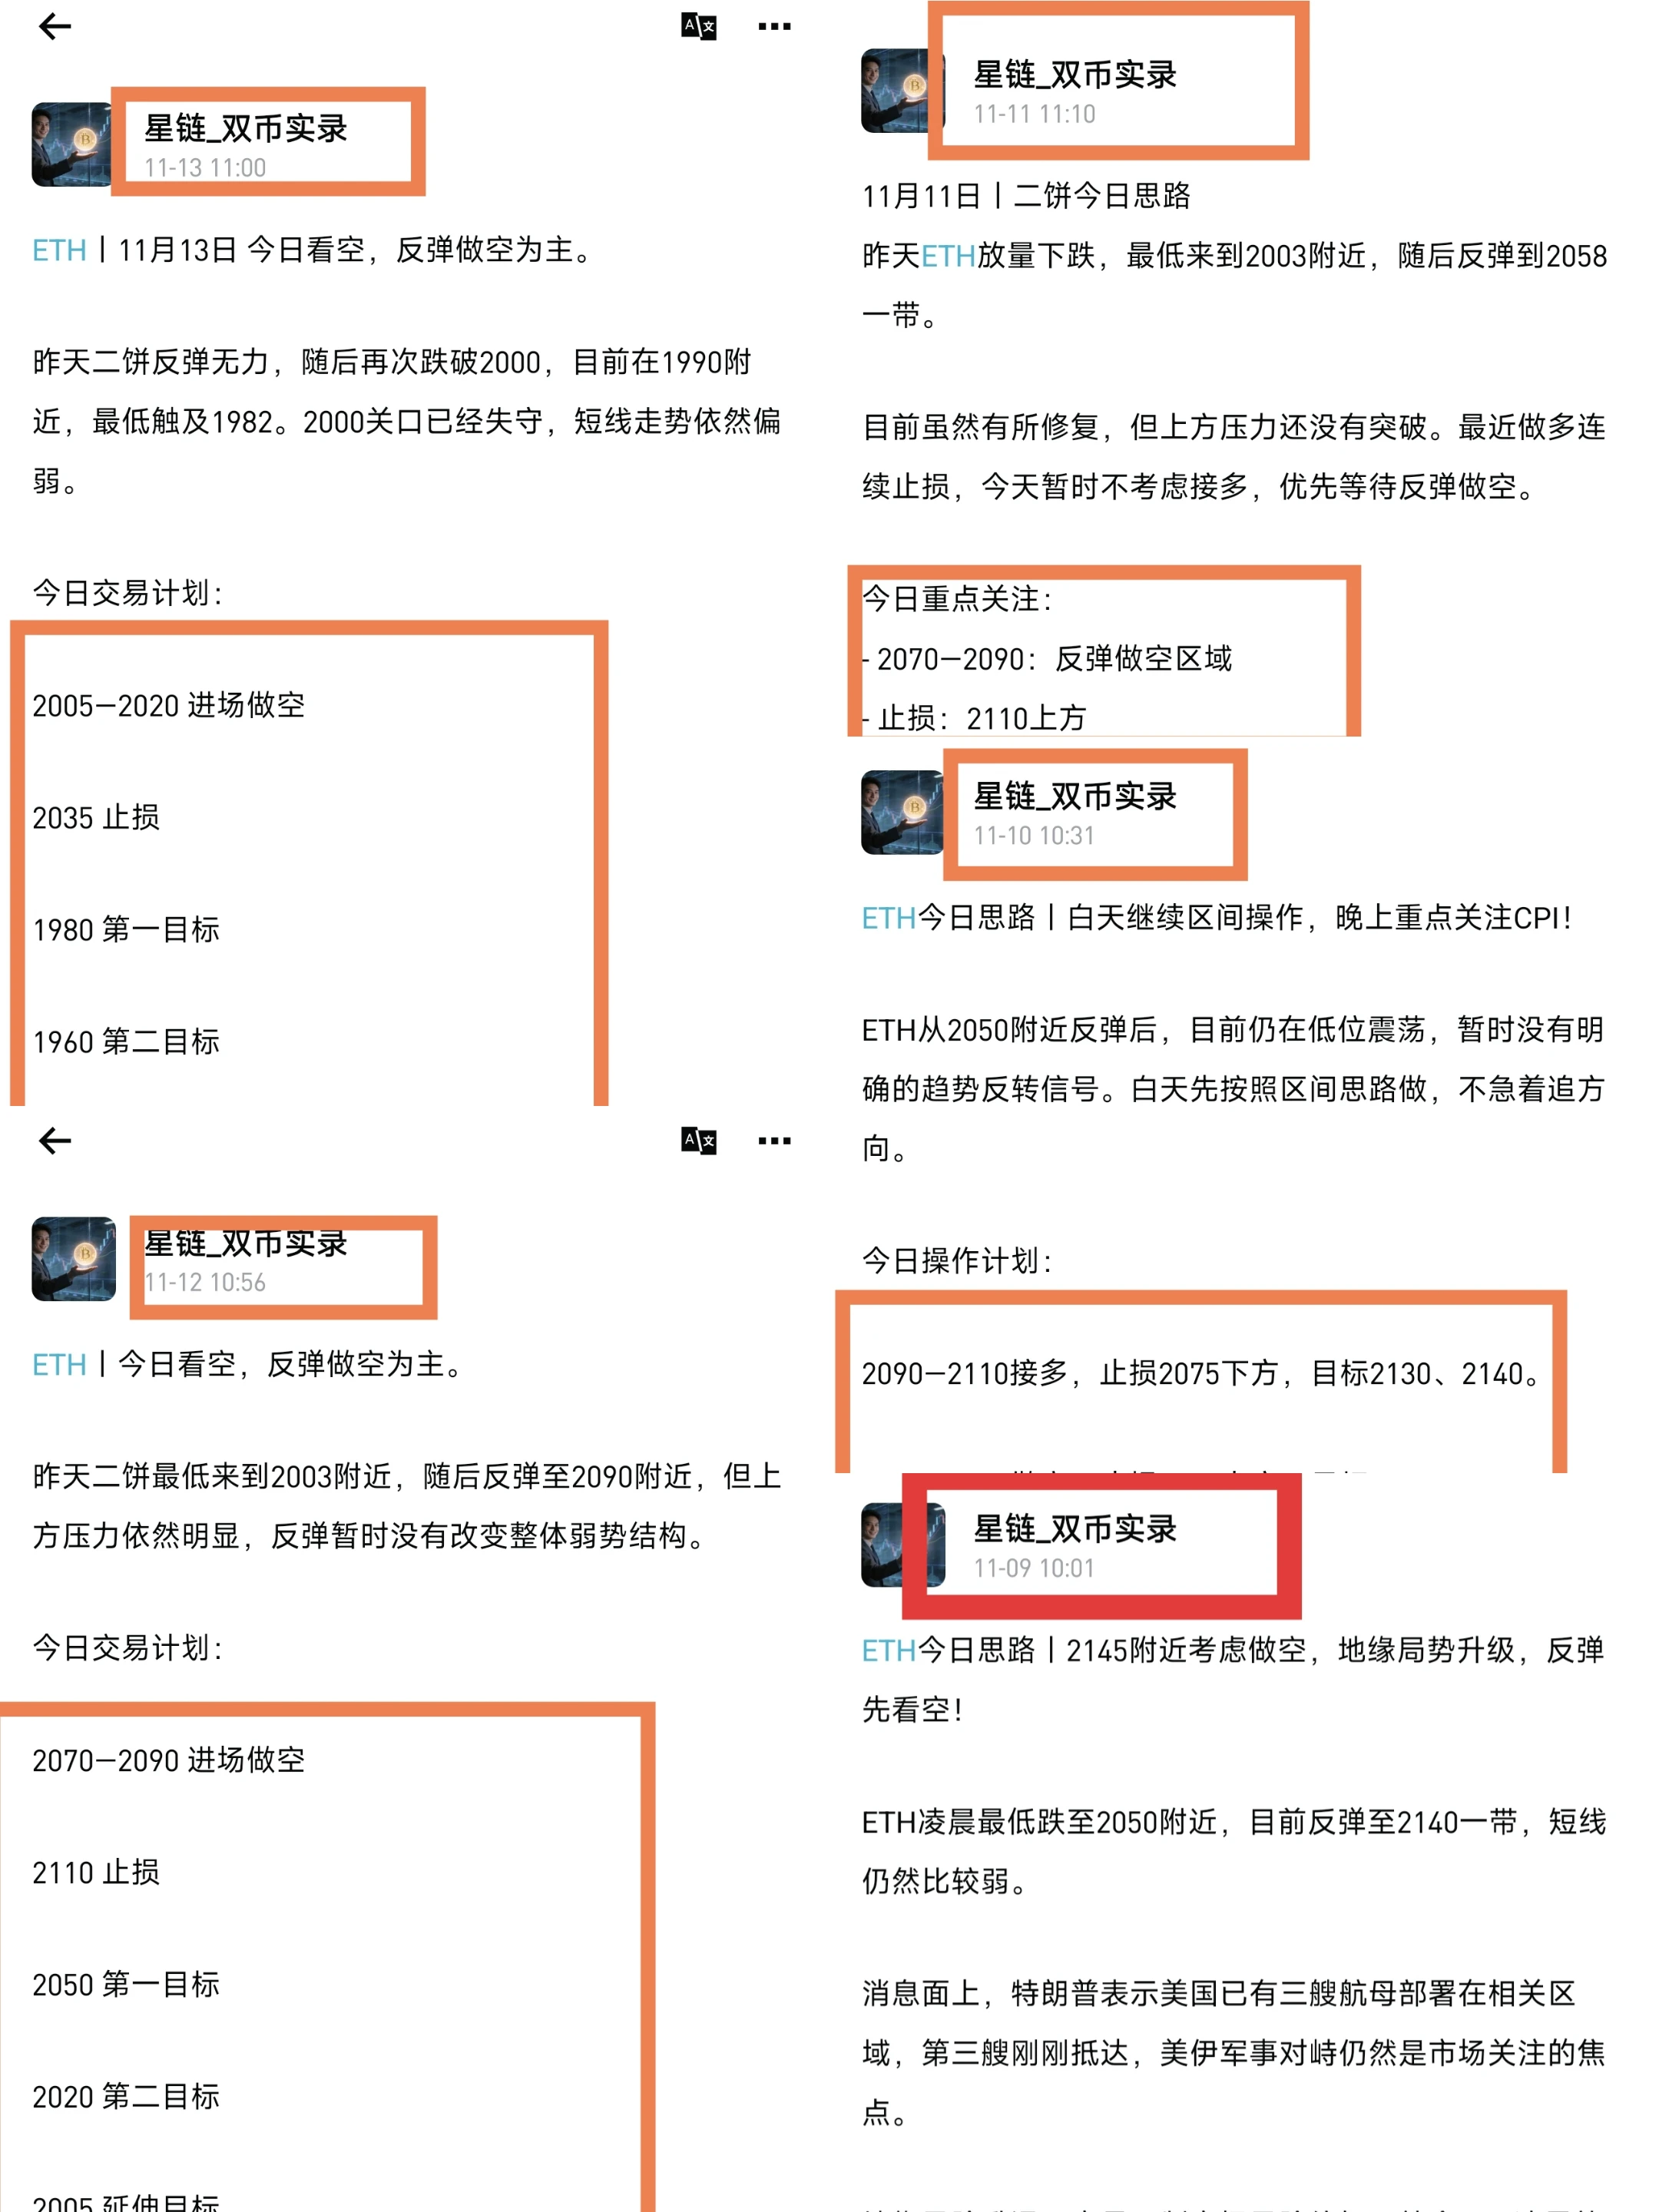
ETH | ETH continues to weaken; for now, the plan is still to short the bounces.

From around 2800 down to around 1900, ETH's price action during this stretch has been quite clear: bounces are getting weaker, and the price keeps making new lows. There is still no clear sign of a trend reversal.

After my earlier attempt to go long failed, I adjusted my approach promptly. Rather than repeatedly entering to buy the dip just because the price had fallen a lot, I focused on shorting the bounces.

I've always emphasized that buying the dip isn't about how far the price has fallen; you need to see a
post-image
BTC-0.65%
ETH-1.23%
Crypto Market update
live-cover
LIVE1,041
On the GROK web version, the former delete conversation window has been changed to an archive conversation window.
User data may be stored separately. Hey @grok, tell me, is this true.
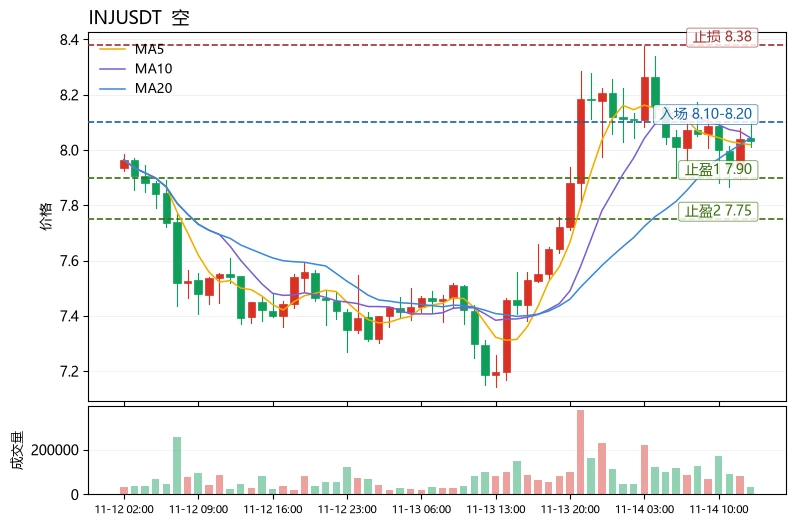
$INJ Current price 8.031, 24h +11.06%, trading volume 22.9M USDT, funding rate +0.0100%, Fear & Greed Index 13 (Extreme Fear). On the moving-average front, MA5=8.019 remains below MA20=8.043; the short-term average has just crossed above but not held, indicating a rebound recovery rather than a trend reversal. The MACD histogram at -0.02654 remains bearish, with momentum yet to turn positive. RSI 56.5 is neutral to bullish, leaving room to rise but not yet overbought. Bollinger Bands [7.74377, 8.34233]: price is trading just above the middle band, with the upper band at 8.34 as the first resi
post-image
INJ-1.67%
UNI+3.05%
HYPE+0.24%
Bitcoin long-term cycle update
For now, I think it's Figure 1: as long as 57,800 holds, the bottom is a range.
From now until early next year is a window to build spot positions.
(Assuming there is no financial crisis)
The other is the long-term cycle as seen by the bears, Figure 2.
BTC-0.67%
I came across footage of Ukrainian frontline soldiers shooting at each other across frozen ground and froze for a moment. The camera showed a gray-white sky, mud churned up by shelling, and figures huddled in trenches. The war hasn’t stopped at all; it’s just fallen off the trending topics. It seems the world has accepted one thing as a given: no traffic means it’s over.

But casualties at the front continue. The frozen ground makes no distinction between soldiers—it’s just as hard to dig through for Russian and Ukrainian troops alike, freezes their boots at night all the same, and carries mud
post-image
  • 2
  • 2
BTC has been moving sideways for three days, with the price fluctuating back and forth within a range. Many traders are starting to feel anxious: should they go long or short?

In fact, the easiest mistake to make in a sideways market is to predict the direction of a breakout in advance.

To assess a breakout, you can focus on three signals.

First, trading volume. When the price approaches the upper end of the range, a sustained increase in trading volume indicates that market participation is rising. But increased volume alone does not necessarily mean the price will rise; you also need to w
BTC-0.67%
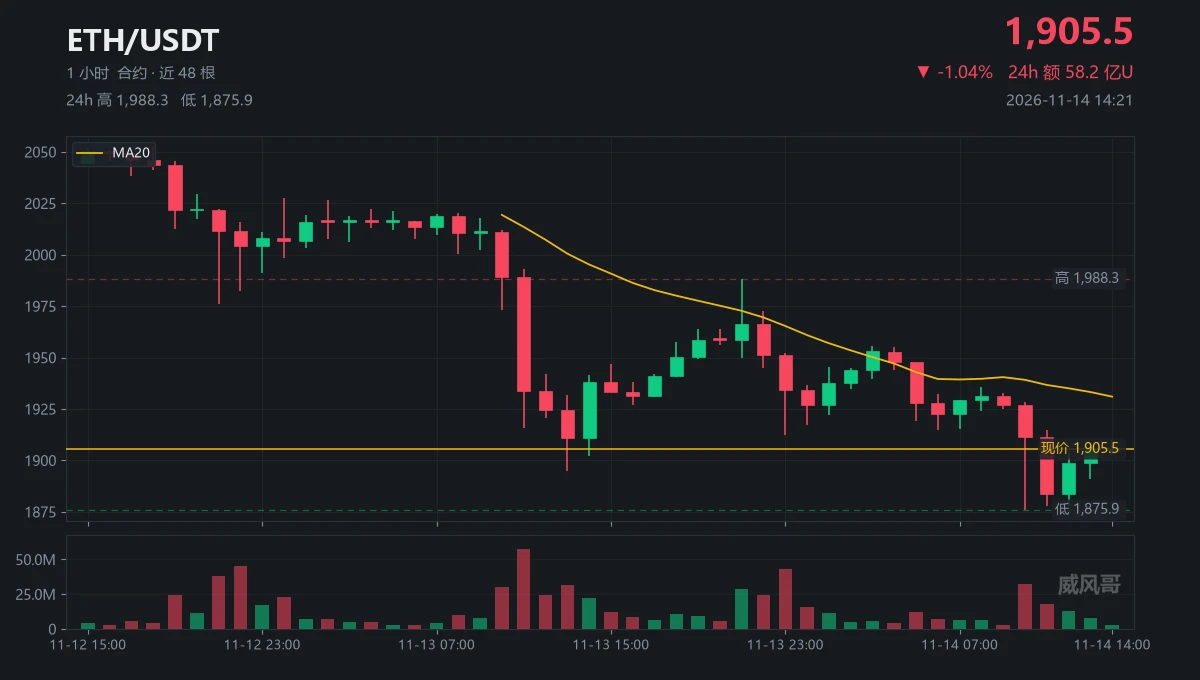
1875.94 / 1906.42 / 1931.00
These three numbers are the whole story today for $ETH
At 10:00, a single candle with 32.56 million contracts slammed price down to 1875.94
Volume was 2.4x the average, with price sliding all the way down from 1927.14
At 11:00, another 17.88 million contracts came in, but the new low was only 1878
Together, the two candles totaled 50.44 million contracts, for a 49-point drop
From 12:00 to 13:00, price climbed back with just 20.42 million contracts
A 28.7-point rebound; per-unit force was 40% higher than on the way down
At this level, I’ll ask just one thing: who’s
post-image
ETH-1.23%
  • 1
  • 1
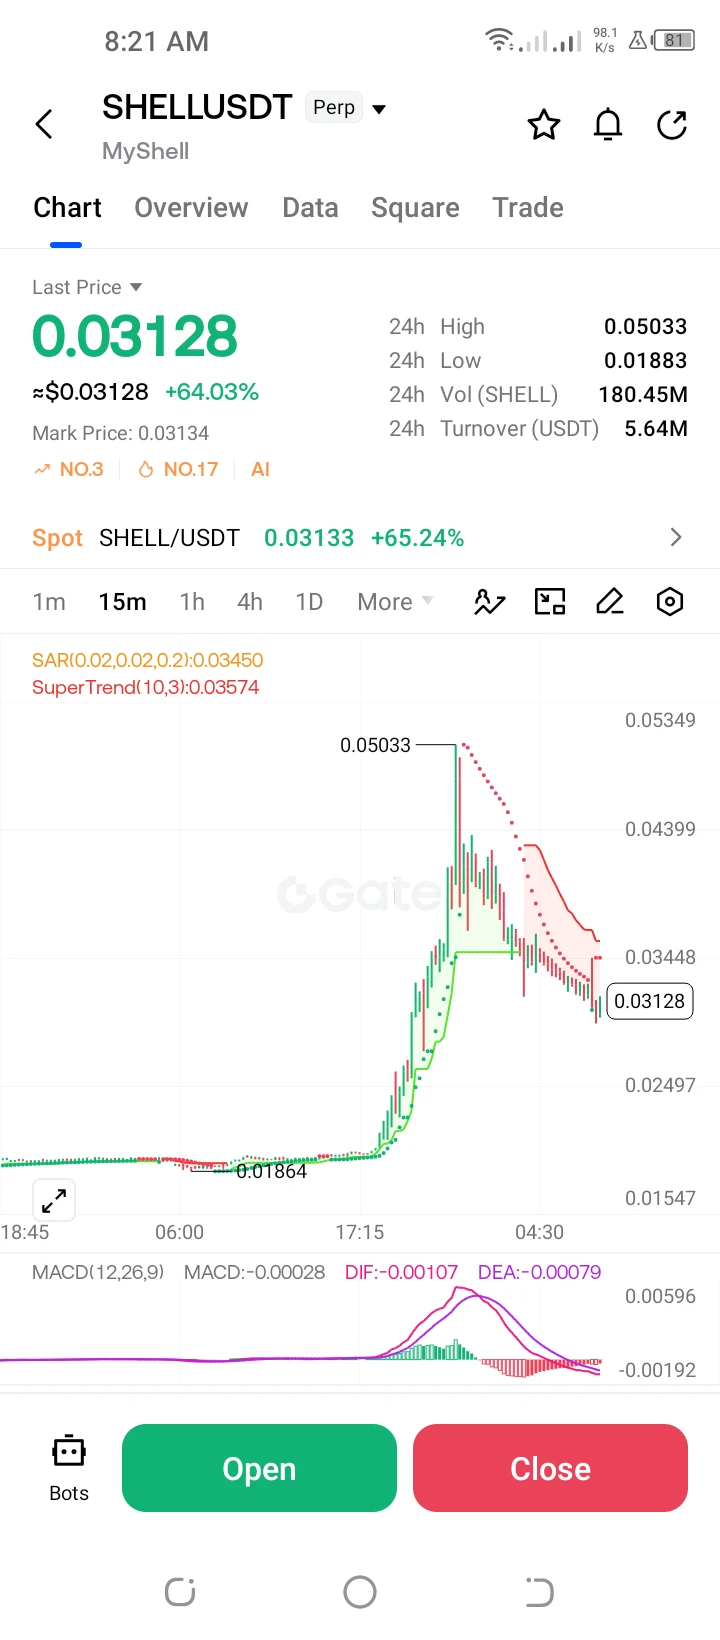
**$SHELL do/USDT Perp – "Extreme Volatility Pullback – Long"**
Trading Plan Long $SHELL
Entry: 0.03128
SL: 0.02497
TP1: 0.03448
TP2: 0.04399
SHELL is up +64.03% but has pulled back heavily from the 0.05033 high. MACD is resetting; looking for a bounce off current levels to target the 0.03448 EMA resistance. High risk.
post-image
SHELL-2.70%
BTC | ETH | Gold | Crude Oil
live-cover
LIVE2,372
Qinghuan’s live trading record—no overexplaining; judge by the record and trading ability
ETH-1.26%
  • 2
Santiment issues notable warning on Bitcoin, Ethereum, and XRP
Negative sentiment is dominating social media across Bitcoin, Ethereum, and XRP.
According to Santiment, investor sentiment for all three assets has deteriorated significantly on platforms including X, Reddit, and Telegram. Positive comments are now outnumbered by negative ones for each major asset.
⚠️ Personal market analysis only. NFA — manage risk and DYOR.
Educational content, not investment advice or a recommendation to buy, sell, deposit, or withdraw any asset. No paid promotion or referral/affiliate links.
post-image
BTC-0.67%
ETH-1.26%
XRP-1.15%
$AKE Round 5 officially kicks off. We’ve won 4 rounds, and now it’s Round 5! Gains have reached +395%, and the momentum hasn’t stopped. Yesterday, we crushed AKE in 4 consecutive rounds. We surged all the way from the bottom to the top, racking up huge profits. To everyone who kept saying, “Give us another new signal”: here it is—Round 5 has officially kicked off. Take a look at the chart. The current price is $0.0129, up an astonishing +395% today, with trading volume exceeding 1.31 billion USDT. Buyers are firmly in control, and the price is in pure vertical price discovery. Why Round 5 is
post-image
AKE+6.07%
  • 1
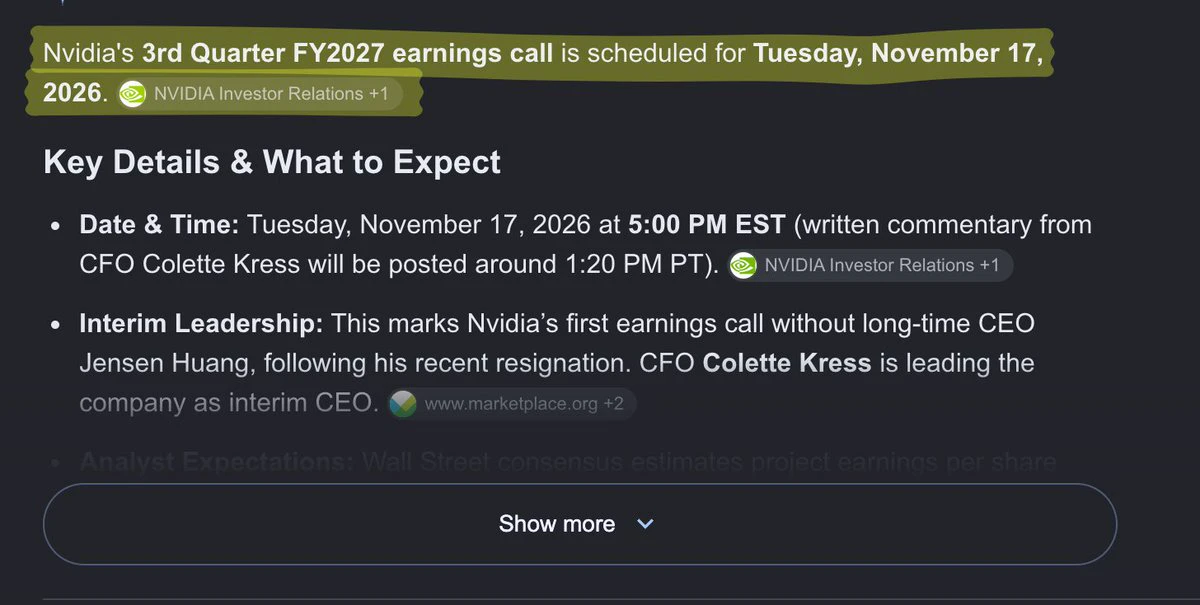
Nvidia earnings call just 2 days before GTA 6 🤞
post-image
NVDA-1.92%
#AnthropicIPO6xOversubscribed

Anthropic IPO Demand Signals Growing Investor Confidence in the Artificial Intelligence Industry

The reported sixfold oversubscription of Anthropic's anticipated initial public offering highlights the extraordinary level of investor interest surrounding the artificial intelligence industry. As one of the prominent companies developing advanced AI technologies, Anthropic has attracted attention from investors seeking exposure to the next generation of technological innovation. Strong demand for a potential public offering reflects expectations that artificial in
post-image
ANT
ANT蚂蚁
Gate.Fun
MC:$0.1Holders:0
0%
Don't touch $BMT under any circumstances. This 15.84% gain is bait, not a signal. The 24h trading volume of 36.9M looks lively, but with turnover this high, anyone chasing the rally is providing exit liquidity to addresses lying in wait overnight. The current price is 0.0237, with only 6% upside to the 24h high of 0.0253. Overhead, there are plenty of trapped holders; below, 0.0204 is today's line in the sand for the bulls—break below it, and the 15% gain could be wiped out within three days.
On-chain data makes it even more concerning: this rally has come with a surge in large transfers, not
BMT+5.93%
  • 2
  • 2
#ETHBrieflyFallsBelow2000 🚨 Ethereum (ETH) Briefly Falls Below $2,000 – Market Faces Strong Selling Pressure!

Ethereum (ETH), the second-largest cryptocurrency by market capitalization, has faced significant selling pressure after briefly dropping below the important psychological level of $2,000.

The decline reflects growing uncertainty across the cryptocurrency market, with investors becoming more cautious amid economic concerns, institutional outflows, and weakness in technology stocks.

📉 Why Is Ethereum Falling?

Several factors are contributing to Ethereum's recent weakness:

1. Mark
post-image
ETH-1.26%
BTC-0.67%
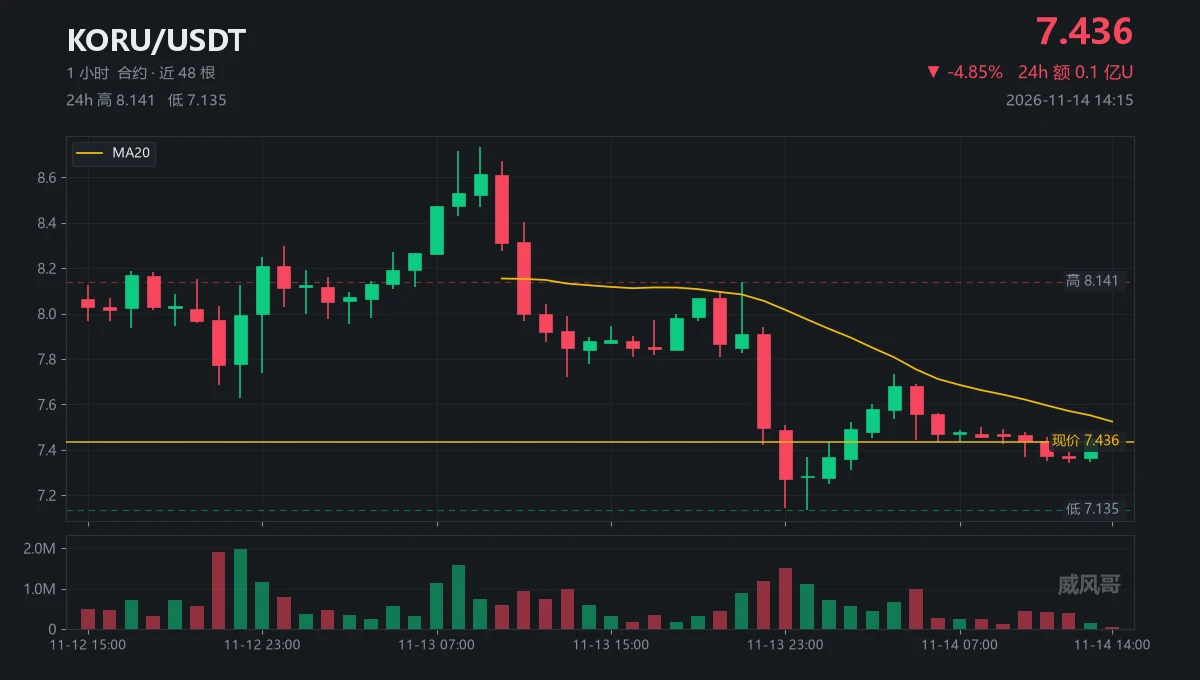
The 05:00 candle closed, and the price just lay down
$KORU 8.141 → 7.135 / happened in one night
Dumped from 21:00 to 23:00 / 2.7 million contracts
The second candle was 1.7x the first / price fell 12.3%
Bounced to 7.734 at 04:00 / on just 656k contracts
The 05:00 closing candle had 995k contracts / pushed it back down to 7.445
The next nine candles / high of 7.561 / never touched 7.6
Now 7.436 / MA20 7.524 / gap of 0.088
14:00 volume was 46k contracts / 8% of average volume
24-hour total was 9.23 million U / that's all the volume
Weekend / Seoul is closed / New York is closed too / nobody to
post-image
KORU-1.22%
  • 2
  • 1
Load More

Join 40 M users in our growing community

⚡️ Join 40 M users in the crypto craze discussion

💬 Engage with your favorite top creators

👍 See what interests you

Trending Topics

GateIPOAccessAnthropic

303.4K Views2.8K Discussing

Gate IPO Access Phase 3 features Anthropic (ANT), with USDT subscription interest starting from 100 USDT. Successful allocations will be delivered as real shares to Gate Stock Accounts. Indicative price: $70–$78/share Subscription: Nov 12–17 (UTC+8) Allocation is not guaranteed. Please manage risk accordingly.

Dr.HanOxfordUnionSpeech

147K Views575 Discussing

USOctoberPPIBelowExpectations

460.5K Views1.4K Discussing

View More