Square
Following
Hot
News
Notifications
Profile
Share your thoughts
placeholder
Article
$AIN ‌

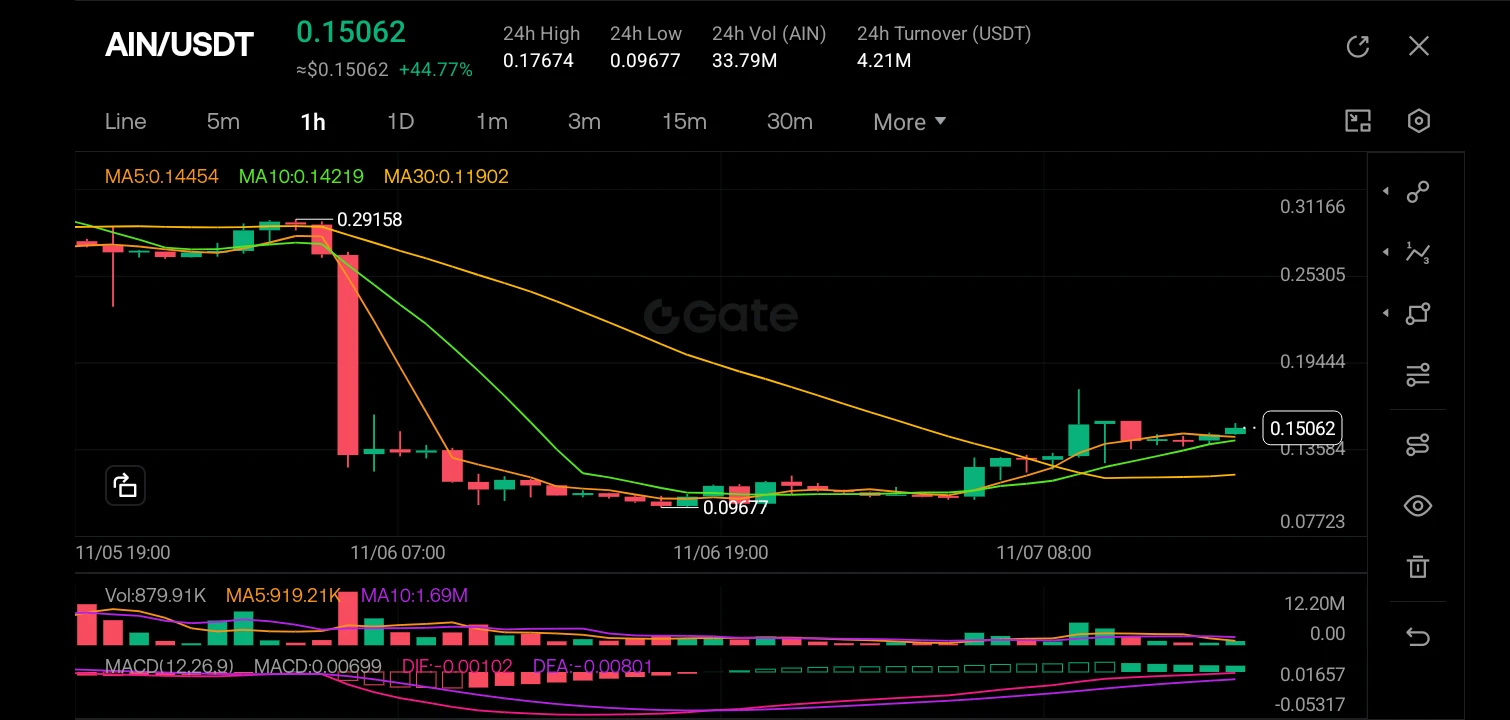
I see a chart for AIN/USDT on the 1-hour timeframe showing a massive volatility event. The price is currently trading at 0.15062, up a significant +44.77% for the day, but this comes after a brutal drop from the 0.29 highs.

The chart tells a story of a "pump and dump" or a massive liquidation event. We saw the price peak near 0.29158 before a violent, vertical red candle crashed the price all the way down to a low of 0.09677. Since that capitulation, the market has entered a consolidation phase, slowly grinding upward in a recovery attempt. The price is currently battling the MA5 (ye
post-image
AIN+3.85%
  • 2
【OpenSky · Daily Exploration Day 31】
OpenSky's exploration coordinates for today: “Keep pace, don't lose your place”
The most regrettable thing isn't missing the moment—it's when an opportunity comes along and you're no longer at the table.
The OpenSky 2.0 upgrade is accelerating, social app beta testing is speeding up, and the Safe4.0 ecosystem matrix is set to unleash its full force—the gears are beginning to mesh at high speed, and the foundation is being rolled out across the board. This isn't a breakthrough in just one area; it's the resonance of the entire network.
🔹 2.0 is a comprehens
post-image
Trenches
ZIG
Z
bade
b
ZIG
0x8c...1145
Market Cap
$.
Change
.
24h Vol
$.
Holders
.
BTC
B
bade
b
BTC
C5xp...pump
Market Cap
$.
Change
.
24h Vol
$.
Holders
.
Diamond
D
bade
b
Diamond
5VCE...pump
Market Cap
$.
Change
.
24h Vol
$.
Holders
.
DOGE
D
bade
b
DOGE
DoGE...fm7R
Market Cap
$.
Change
.
24h Vol
$.
Holders
.
STONK
S
bade
b
STONK
6GmA...UNgx
Market Cap
$.
Change
.
24h Vol
$.
Holders
.
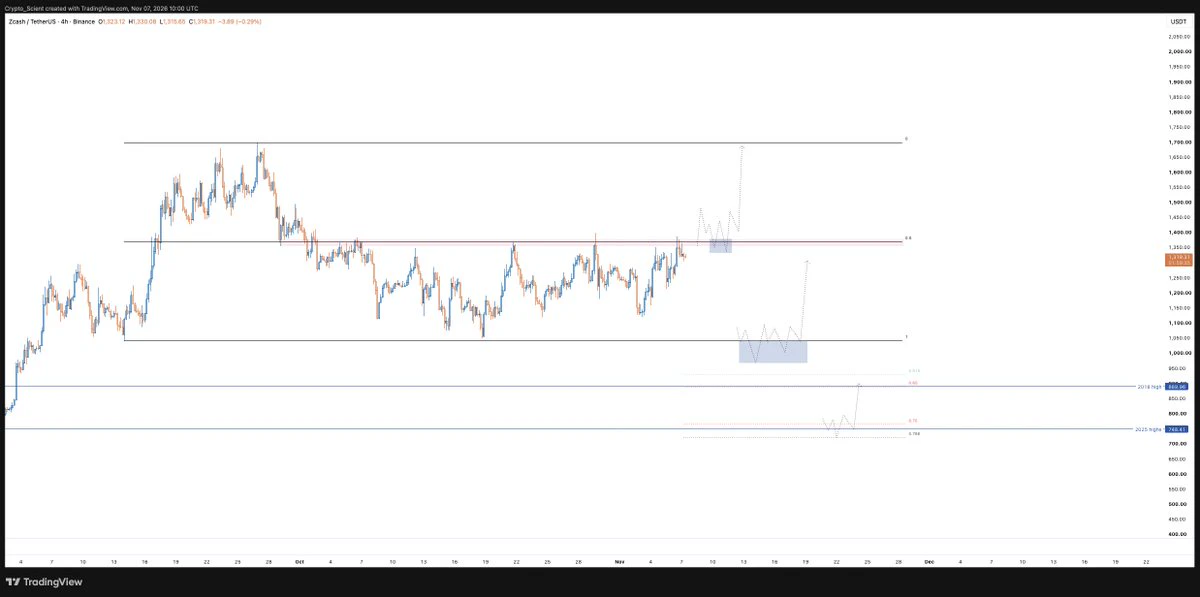
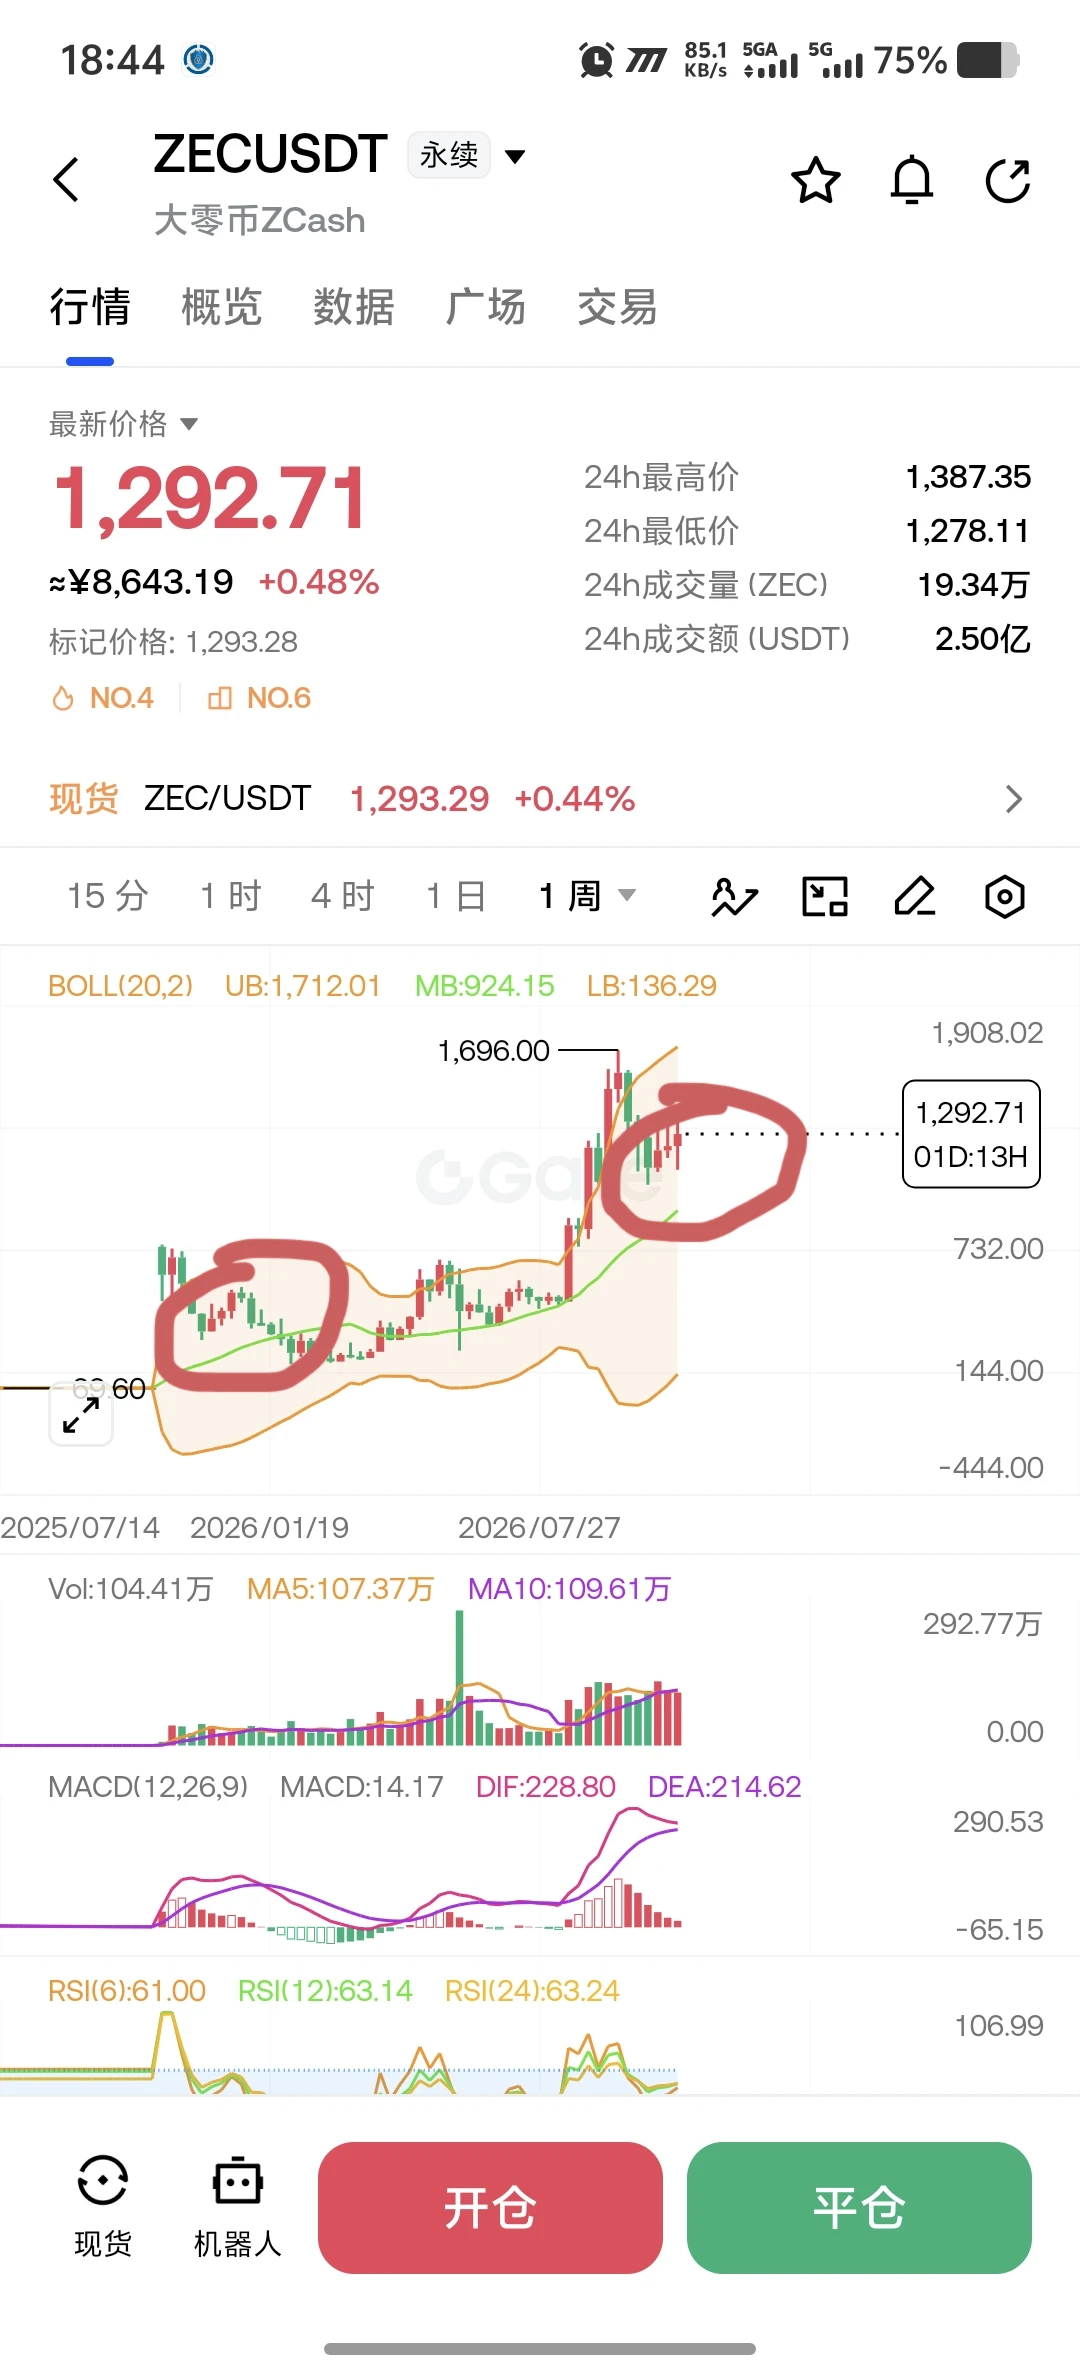
$ZEC , Right now price is in the middle of nowhere. Range is 1040 - 1710, price is sitting just under the mid at 1369 and the mid is also the current 4h resistance.
Three triggers for the long side:
1. Break and flip of 1369. Daily close above, retest holds, long from the retest.
2. Sweep of the range lows at 1040, reclaim, then consolidation on top of the RLs. Long from the consolidation, not the sweep.
3. Total flush into the OTE pocket. The block between $900 and $750 holds the 0.65 at the 2018 high ($890) and the 0.786 at the 2025 high ($748), and $750 is also key monthly S/R. If price gets
post-image
ZEC+1.16%
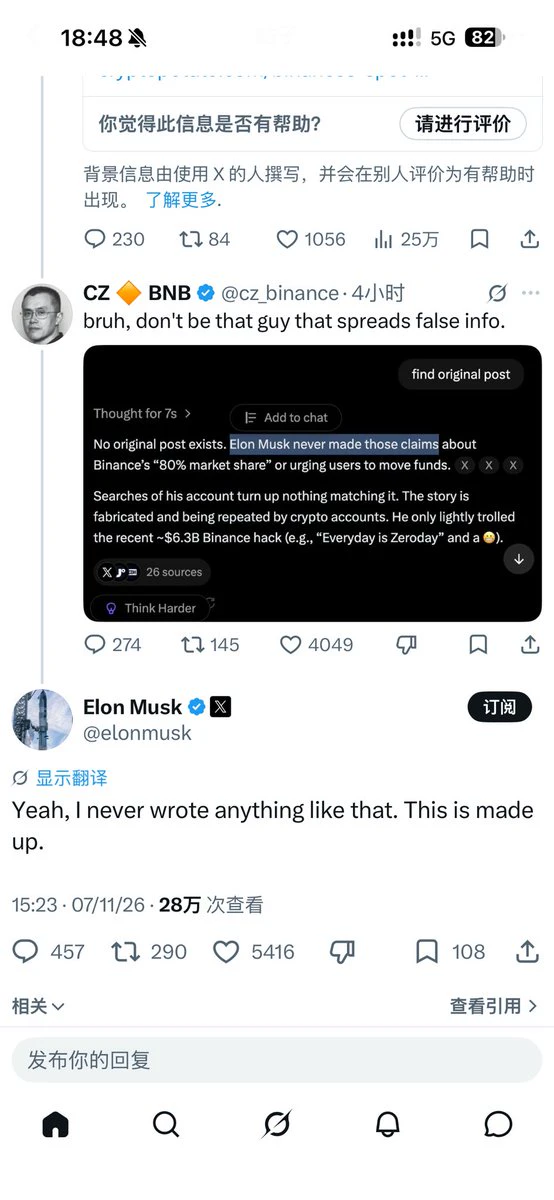
Looks like the two of them are still good friends?
post-image
Fans, gather round! Your favorite streamer could soon make their big debut in the spotlight!

Attention! Attention! Gate Social’s Annual Streamer and Creator Awards are here!
Fans, it’s time to show what you’re really made of!
Do you often do this? You come across a streamer you like and hit Like; see great content and save it right away; come across a mind-blowing take and want to share it with your friends that very night?
Now, every follow, like, and show of support could help them compete for annual honors!
Some are the life of the livestream, some are the go-to source for knowledge and in
MU+4.71%
$KORU The Korean index plunged 40% yesterday and rebounded 10% today. It should be done falling, right? If it falls any further, it'll go to zero. I'm trying to go long and buy the dip!
post-image
KORU-1.22%
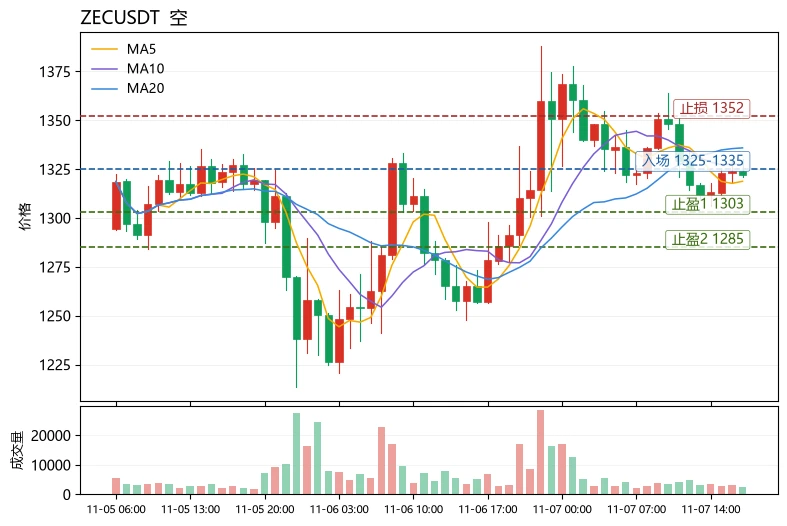
$ZEC Current price: 1321.85. Key short-term levels: resistance above at 1335.9 (MA20) and 1368.7 (Bollinger upper band); support below at 1303.11 (Bollinger lower band) and 1318.78 (MA5). Price is stuck between MA5 and MA20, with the moving averages in a bearish alignment. MA5 has failed to cross above MA20, and the structure is weak.
The MACD histogram at -3.667 remains in bearish territory, with no clear contraction and no recovery in momentum. RSI at 50.7 is neutral, with neither oversold rebound momentum nor overbought risk; direction depends on a breakout. The Bollinger Band width is lim
post-image
ZEC+1.16%
ACT-1.19%
After the Nonfarm Payrolls Report, the probability of a Fed rate hike in December
live-cover
LIVE1,479
Prominent market voices and macro analysts remain divided—with some high-profile figures like Arthur Hayes maintaining a long-term $10,000 target, while others point to competition from high-speed Layer 1 alternatives like $SOL drawing short-term developer and liquidity focus.
post-image
SOL-0.77%
$SYRUP : Maple now manages ~$4.7B in assets, up 18% in a year.
Its Robinhood Earn integration is already past $136M.
The monthly chart broke above the downtrend line from the 2025 top and is staying above it. 👀
SYRUP-1.89%
HOOD+3.16%
Compared with the dot-com bubble, the Nasdaq has only climbed 2.2x during this AI boom, versus 4.2x over the same period in 1999. This time around, things are much less frenzied, and the valuation gap is actually much smaller. So don’t force the bubble narrative—slower gains don’t mean there’s no upside. Can $BTC hit $120,000? We’ll know by the end of the month. If you’re watching, follow along.
post-image
NAS100-0.07%
BTC-0.67%
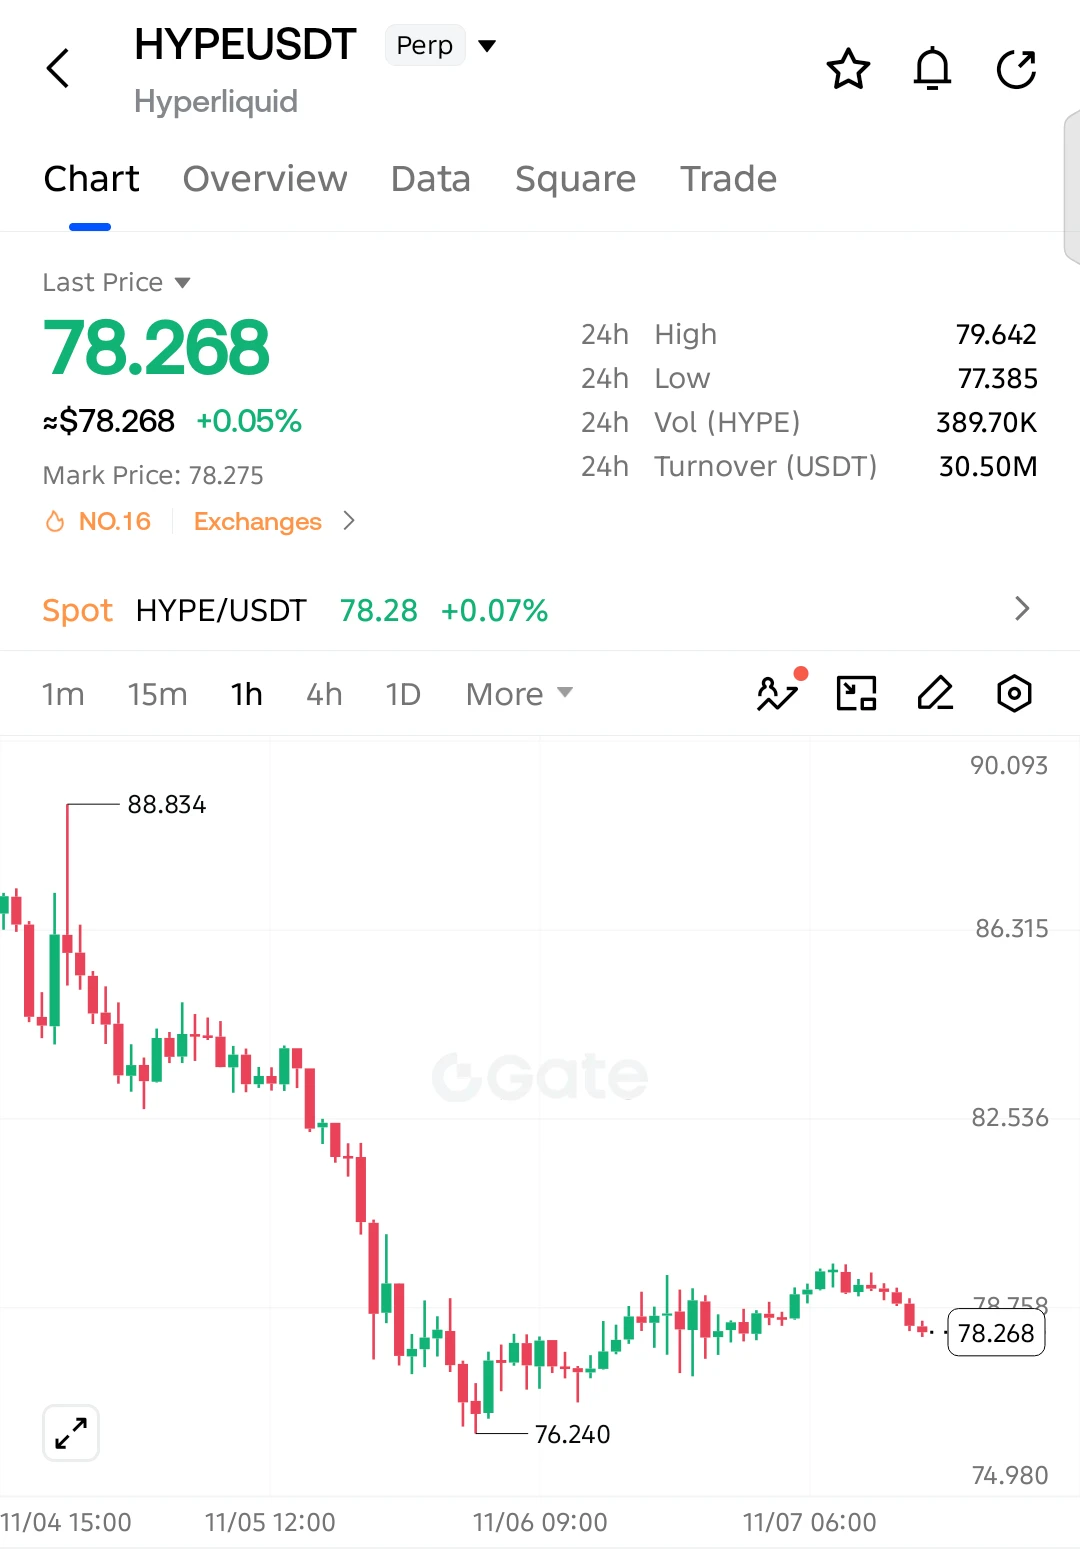
$HYPE SHORT SETUP — SELLERS TAKING CONTROL AGAIN!

$HYPE is struggling to recover after a sharp decline, with buyers losing momentum near resistance. Another bearish move could be developing!

Entry: 78.268
SL: 79.85

TP1: 77.385
TP2: 76.240
TP3: 75.50
Final Target: 74.98

The broader trend remains bearish, and the recent recovery has failed to break above 79.64. Sellers are pushing price lower again, while a breakdown below 77.385 could accelerate the decline toward 76.24 and lower.

Invalidation: A sustained recovery above 79.85 weakens the bearish setup.
post-image
HYPE+0.24%
$ONE Short, short, short, short—an unexplained rise is just the prelude to a crash.
It won't be long before the storm hits.
post-image
ONE-1.19%
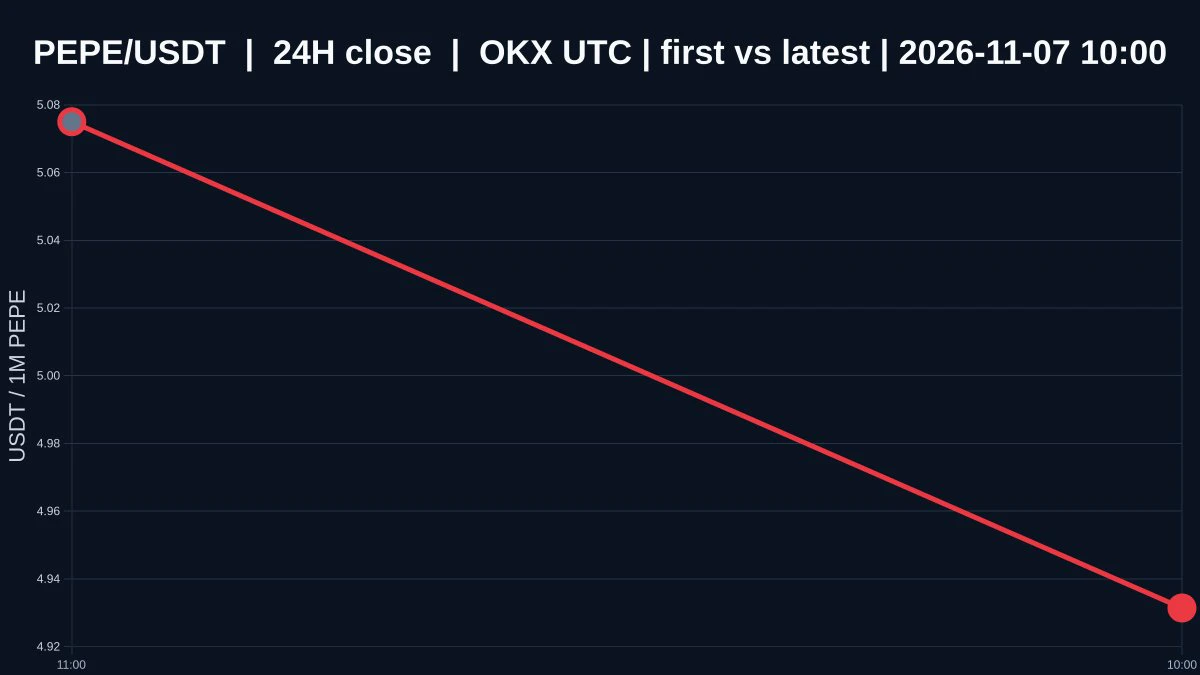
$PEPE Price Has Already Moved—Why Has Volume Yet to Respond?
$PEPE is currently priced at 0.00000494, down 2.8324154209284025% over 24 hours, with an intraday high of 0.0000052018 and a low of 0.0000048871. The 1-hour and 4-hour trends are both weak, and the selling-pressure structure has yet to show signs of a reversal. However, the volume ratio is 0.009966001470313861, indicating extremely low market participation. This means that relatively little capital can drive directional price moves, but that does not confirm the direction. A direction is taking shape for now, but low participation re
post-image
PEPE+0.97%
BTC market update
live-cover
LIVE2,678
ZEC is still in an oversold rebound, not a reversal; this is a normal pattern in a downtrend. If it breaks through and the structure is invalidated, it may reverse, but for now it remains in a downtrend
post-image
ZEC+1.16%
Red broth nine-grid hot pot is still so satisfying!
People from elsewhere think hot pot just needs to be numbing and spicy enough and tasty!
But that's not the case—hot pot places can differ a lot.
If the hot pot base is stir-fried well and the ingredients are fresh, it's delicious.
post-image
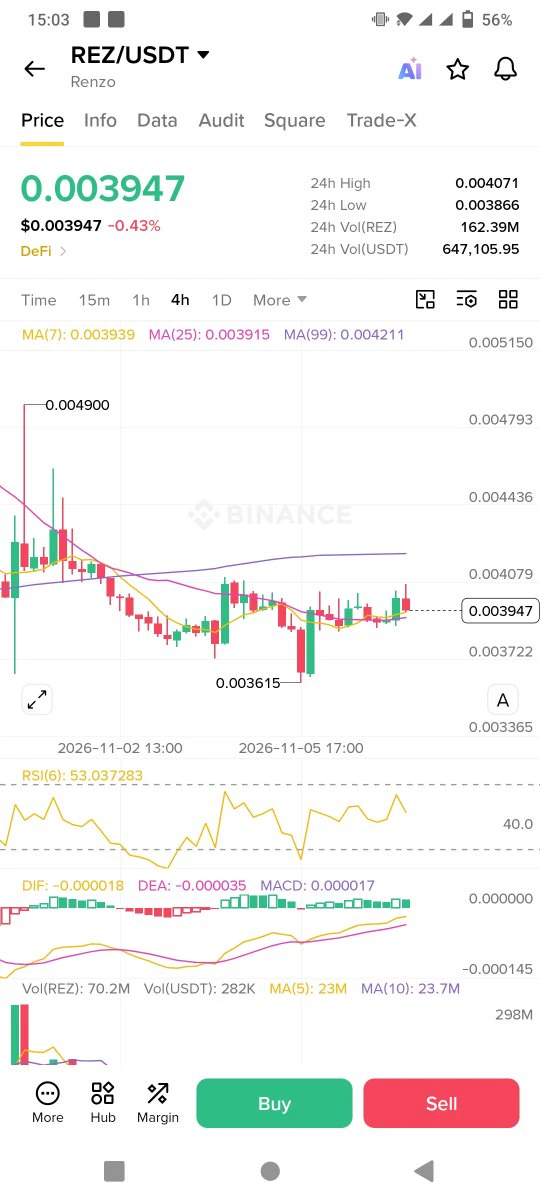
$rez 2nd leg pump coming 🚀🚀
Top gainer soon 🔥
post-image
REZ+8.16%
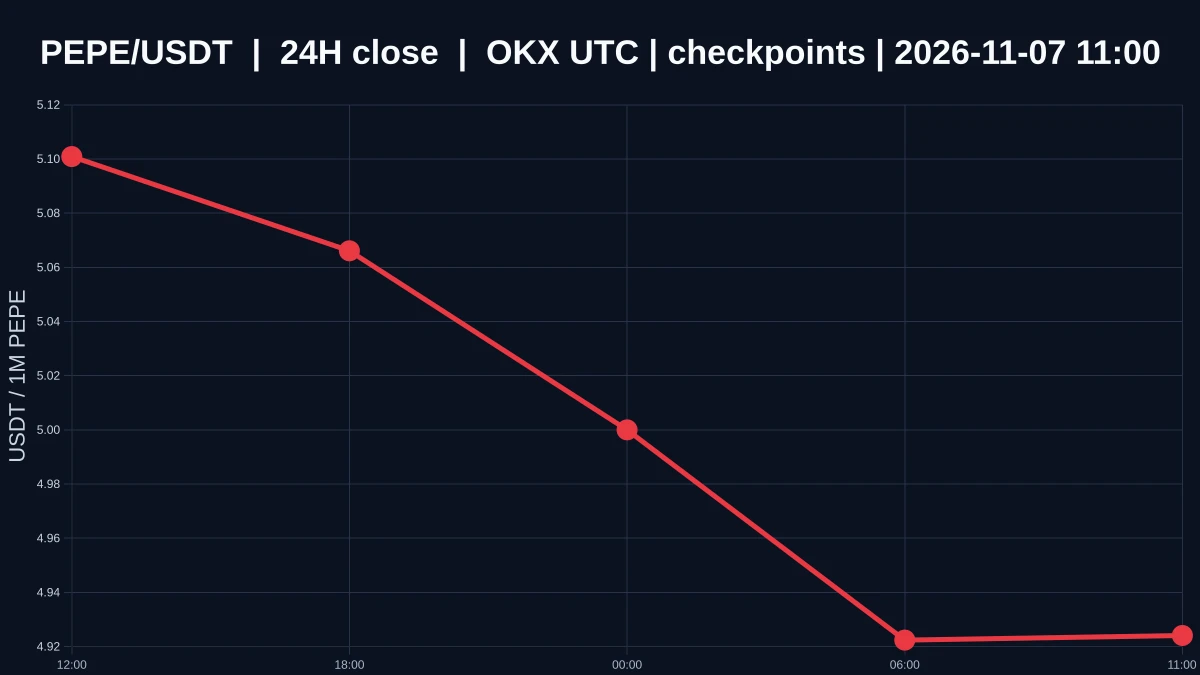
$PEPE ’s direction looks clear, but volume hasn’t weighed in
$PEPE is currently priced at 0.0000049219, down 2.2268573698847827% over 24 hours, with an intraday high of 0.0000052018 and a low of 0.0000048871. The 1-hour and 4-hour trends are both weak, and the selling-pressure structure has shown no signs of reversal. The volume ratio is 0.01655042356618388, indicating extremely low participation. The price can move directionally on just a small amount of capital, but that doesn’t confirm the direction. The direction is temporarily in place, but low participation undermines the credibility of t
post-image
PEPE+0.97%
Load More

Join 40 M users in our growing community

⚡️ Join 40 M users in the crypto craze discussion

💬 Engage with your favorite top creators

👍 See what interests you

Trending Topics

USAIStocksHitHard

17.89k Views3.65k Discussing

U.S. stocks sold off sharply on Thursday, November 5 (UTC). The Nasdaq closed down around 5.5%, entering correction territory, while the Philadelphia Semiconductor Index plunged roughly 12%, with chip stocks including $NVDA and $AMD posting steep losses. Beyond profit-taking, investors are growing concerned about the pace of AI data center construction, capital spending, and future returns on investment. The key question now is whether the AI sector’s lofty growth expectations need to be repriced. Where do you think the next opportunities will emerge: chip stocks, tech giants, or other sectors?

USNonfarmPayrolls

26.81k Views4.29k Discussing

StakeOnLaunchpoolToShare450KVLX

4.81k Views795 Discussing

View More