

Share your thoughts
placeholder
Article
Nobody is talking about this hidden bearish setup in $XAU /USDT right now.

$XAU /USDT - SHORT

Trade Plan:
Entry: 4356.16 – 4360.70
SL: 4380.20
TP1: 4342.10
TP2: 4331.21
TP3: 4314.88

Why this setup?
Why now? The daily trend is range-bound, which means price is coiling for a directional break and the 1h RSI at 53.2 shows neither overbought nor oversold exhaustion, leaving room for a sharp move. The 1h ATR of 9.07 tells us the average hourly swing is wide enough to hit both targets if momentum kicks in. The entry zone sits between 4356.16 and 4360.70, giving a precise trigger for a short po
XAU+0.20%
ETH/USD Daily Technical Analysis
ETH wicked into the purple band resistance at $2,650 following a sharp impulse wave and is currently trading around $2,532.
Bullish Scenario: If the $2,649 resistance is broken and a daily candle closes above it, the uptrend may gain momentum.
Correction Scenario: In a potential pullback, the first strong support is $2,379, followed by $2,212. The 1,942 - 1,847 range is a critical support zone for preserving the trend’s main structure.
The purple dashed lines on the chart define the main range boundaries #CoinDeskRevealsGateRWAPerpetualsTop3Globally
ETH+2.80%
Why did CASHCAT get so rich? Because it found a cash-nip patch — but now it's hiding from the taxman.
$CASHCAT
📉 Short
Entry: 0.188 – 0.194
TP1: 0.180 / TP2: 0.172 / TP3: 0.165
SL: 0.197
📈 Long
Entry: 0.165 – 0.170
TP1: 0.178 / TP2: 0.185 / TP3: 0.192
SL: 0.158
🔑 Key Levels
Resistance: 0.193 / 0.1946
Support: 0.165 / 0.155 / 0.1535
⚠️ Not financial advice. DYOR and manage your risk.
post-image
CASHCAT+11.01%
It rose too fast!
ZEC fell more than 13%, and many people's first reaction was: “Is the privacy sector dying?” Not necessarily. A more reasonable explanation is that after excessive gains in the previous period, the market has begun a sharp rebalancing of positions.
ZEC had previously broken through key price ranges in succession, rapidly heating up market sentiment and attracting large amounts of short-term capital. When prices enter a highly volatile phase, any piece of negative news can become a trigger for profit-taking. Thus, the familiar script unfolded: some believed it could rise furth
ZEC+4.69%
  • 2
Rate hike odds have been pushed to 70%, while the Greed Index is still sitting at 63
The market is fooling itself
ETH is still holding above 2500. It’s the only one still standing
Everyone says it’s strong. I don’t buy it
This strength is fake
In one week, rate hikes went from something nobody believed in to something nobody dares dismiss
After the PPI heat, core CPI also came in above expectations
Altcoins die first
Only ETH is still holding
Next week, the FOMC decision and dot plot will be released together
I’m betting the rate hike is real. The market hasn’t priced it in
post-image
ETH+2.80%
#AugustCoreCPIBeatsExpectations
August CPI Is Out — But the Bigger Story Is What Markets Do Next
The August U.S. CPI report has given markets another important piece of information, but I don't think traders should look at the headline number in isolation.
Headline CPI increased 0.4% month over month, while annual inflation remained at 3.4%. Core CPI rose 0.3% MoM and 2.4% YoY.
For me, the most important part is not simply whether CPI beat or missed expectations. The bigger question is whether inflation remains sticky enough to keep Treasury yields elevated and limit expectations for easier F
Everyone is calling SKYAI a buy right now, but the data says otherwise.

$SKYAI /USDT - SHORT

Trade Plan:
Entry: 0.05157 – 0.05187
SL: 0.05314
TP1: 0.05065
TP2: 0.04994
TP3: 0.04888

Why this setup?
Why now? The 1h price sits at 0.05172 inside a defined entry zone, and the 15m RSI at 56.68 shows room to drop before oversold. The 1h ATR of 0.000592 quantifies the volatility, confirming that a move from the entry zone toward TP1 at 0.05065 and TP2 at 0.04994 is statistically normal, not a panic. The daily trend is bearish, so this short bias aligns with the higher timeframe. The line in the
SKYAI+2.99%
GT/USDT MARKET UPDATE PREDICTION NEW
live-cover
LIVE417
With the same 1000U, entering $ORCL yesterday versus entering today leads to vastly different outcomes.
ORCL is currently at 146.31, down -10.14% in 24 hours. It hit a high of 166.22 before steadily sliding to a low of 146.20, with a trading volume of 111.6M. This isn’t a pullback—it’s rolling downhill along the moving averages. Market sentiment is crystal clear: the rebound lacks volume, selling pressure persists, and funds are retreating off-market.
Trading advice: If you’re not in a position, don’t catch a falling knife. Once the 146.2 low breaks, the next level to watch is around 140. Thos
ORCL-1.87%
  • 1
Back to square one again,
Standing blankly in front of the mirror.
Still the same familiar flavor and familiar formula,
aster-2:native just touched CZ’s cost basis and then leaked back to around $0.7.
The good news is that the trend isn’t too bad yet,
There’s still hope if it retests the previous support;
The bad news is, are we going to have another battle to defend $0.6?
Whatever, I’m done shilling it. Let it do whatever. 🤧
post-image
ASTER-0.52%
  • 1
The $LTC long trade early this morning was a pullback confirmation after an hourly-chart breakout. I entered at 50.48, with the stop-loss placed below the range. The market was grinding and frustrating; consecutive small bearish candles failed to break the key level, and volume contracted. I held the position without making changes, and two small wick dips failed to stop me out.
When it pushed up on increased volume, I took profit on 70% first and moved up the protection on the remaining position. I didn’t chase because the move was too fast and the stop-loss distance was difficult to set. I f
post-image
LTC+3.68%
LAB+13.34%
DOGE+1.85%
  • 1
#GateMeme Let’s make a zero carbo meme and have some fun. The global energy system is undergoing change.
Over the coming decades, energy, transportation, energy storage, AI, and computing infrastructure will become increasingly interconnected.
We believe a new combination will emerge in the digital world of the future: zero-carbon energy, electricity storage, AI infrastructure, AI, carbon inclusion, web3, and global community culture. ZCO hopes to become the community culture layer connecting these themes.
Not a replacement for real energy infrastructure.
Instead:
To help more people learn ab
BTC at $77,300, are you still waiting to short?
Look at the surface first: a barrage of bearish news, but the price isn't collapsing.
Over the past week, U.S. core CPI rose 0.3% month-on-month, above expectations; ETFs saw $460 million in net outflows for four consecutive days; and the probability of a September FOMC rate hike was priced at 70-80%. BTC pulled back from a high of $82,000 and is now stuck at $77,300, trading within a narrow intraday range.
Sounds scary? But look at the chart—the market hasn't collapsed.
First: ETFs are seeing outflows, but it's short-term traders who are running
post-image
ETH+2.80%
SOL+2.83%
BTC+0.44%
$FATCOIN Was this funding fee overpaid to the shorts?
post-image
FATCOIN-27.93%
#BonkGuyBullishOnUSELESS
$USELESS
Bonk Guy is bullish on $USELESS but the real question is whether that conviction can turn into sustained price and volume momentum. At the time of this post, USELESS is trading around $0.23, after a highly volatile week that shows exactly why this meme-coin thesis is attracting attention.
The recent price action has been anything but quiet. USELESS surged to a $0.335–$0.336 area on September 9, but then experienced a sharp reversal, closing around $0.225 after touching roughly $0.223. Historical data shows how quickly liquidity has been rotating: September
post-image
USELESS+3.64%
This entry point was not perfect; I went long at the second-bottoming area on the $STORJ hourly chart. The moving averages had not fully turned upward yet, so I could only use a small stop-loss to trade for profit potential later on.

After entry, the price action was very sluggish. Several rallies were pushed back, making it look as though the trend was weakening. But the key levels during each pullback never broke below the reference level from the time of entry, so I chose to reduce my trading frequency and let the position run on its own.

Only after the key level above was broken did th
post-image
STORJ+64.42%
LAB+13.34%
BNB+3.76%
JUST IN: founder says OpenAI and Anthropic AI-linked pools drew ~$1M deposits and surged to multi-million daily volumes pre-IPO, with eye-popping APRs and improving NAV sync. Could signal growing AI-focused liquidity demand on meme-eco rails. $LONG ?
post-image
OPENAI+0.48%
MEME+4.35%
LONG+0.09%
#AugustCoreCPIBeatsExpectations
August CPI Is Out — But the Bigger Story Is What Markets Do Next
The August U.S. CPI report has given markets another important piece of information, but I don't think traders should look at the headline number in isolation.
Headline CPI increased 0.4% month over month, while annual inflation remained at 3.4%. Core CPI rose 0.3% MoM and 2.4% YoY.
For me, the most important part is not simply whether CPI beat or missed expectations. The bigger question is whether inflation remains sticky enough to keep Treasury yields elevated and limit expectations for easier F
  • 2
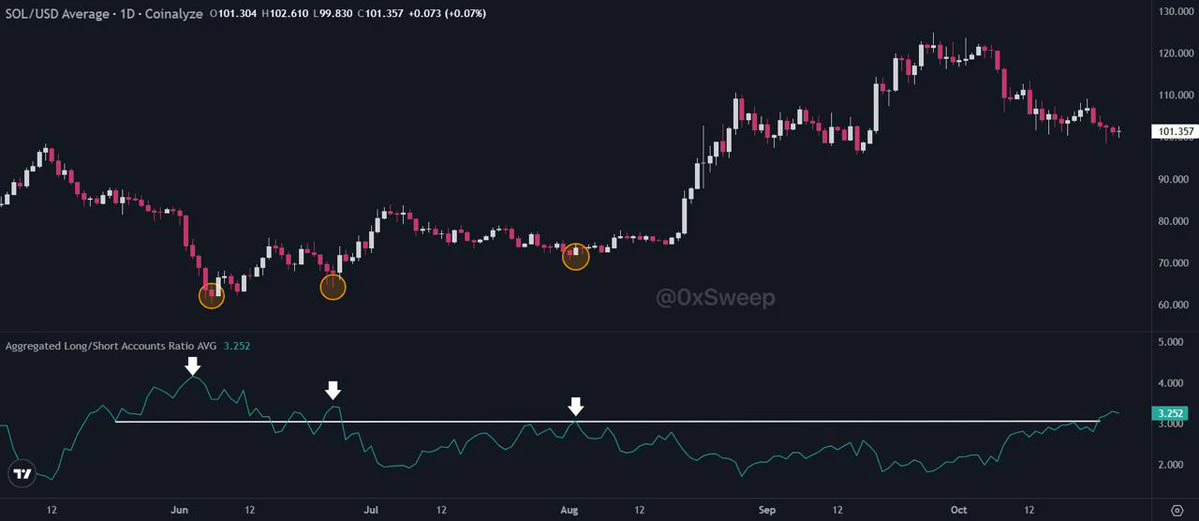
SOL active addresses take the top spot across the entire market, while the price only pulled back 0.19%: Bulls are waiting for September 15
LOL, the active address rankings from an hour ago are out: $SOL surged to No. 1 across the entire market, while the price only pulled back 0.19%—after the event, it moved from 101.63 to 101.82. Short-term bias is bearish; don't chase longs.

One-sentence summary of the event—the top three in active addresses over the past 7 days were SOL, BNB, and TRON, with ETH fourth and Base entering the top ten. More people using the chain is a slow-moving variable th
SOL+2.83%
new update 🥰🌹
live-cover
LIVE1,809
Load More

Join 40 M users in our growing community

⚡️ Join 40 M users in the crypto craze discussion

💬 Engage with your favorite top creators

👍 See what interests you