Square
Following
Hot
News
Notifications
Profile
Share your thoughts
placeholder
Article
$CVX The short position is fully set up, with the current sell price locked at $0.162.
Entry cost: $1.125
Continue adding to the short position $CVX 🔥
CVX -1.59%
Risk warning: The above is only a sharing of personal trading ideas and does not constitute investment advice. Leveraged contract trading carries extremely high risk; please manage your positions accordingly.
post-image
CVX-1.44%
The current ETH/USDT market presents a complex picture when combining on-chain metrics with technical price action.

According to Coinglass data, the order books show a stark asymmetry. There is a large bid concentration near 1650 dollars acting as local support, but significant sell orders are stacked at 1700, 1800, and 1900 dollars. This creates a major barrier for upward movement. Liquidation maps indicate that a move above 1841 dollars could trigger short liquidations, while a drop below 1668 dollars threatens long positions. The funding rate is negative, pointing to bearish sentiment, yet
ETH-1.26%
Trenches
IDOL
I
bade
b
IDOL
0x3b...ab07
Market Cap
$.
Change
.
24h Vol
$.
Holders
.
JAGENT
J
bade
b
JAGENT
0x8e...ae15
Market Cap
$.
Change
.
24h Vol
$.
Holders
.
PIEVERSE
P
bade
b
PIEVERSE
0x0e...25a9
Market Cap
$.
Change
.
24h Vol
$.
Holders
.
FIONA
F
bade
b
FIONA
B34n...pump
Market Cap
$.
Change
.
24h Vol
$.
Holders
.
CLAUDIA
C
bade
b
CLAUDIA
2j5S...W2ZM
Market Cap
$.
Change
.
24h Vol
$.
Holders
.
🐋 WHALE WATCH : BlackRocks $IBIT recorded its largest single day outflow ever $541M. Spot $BTC ETFs have shed $3.47B in November.
Thats institutional money moving not retail panic. Watch where it goes.
post-image
IBIT-5.97%
BTC-0.67%
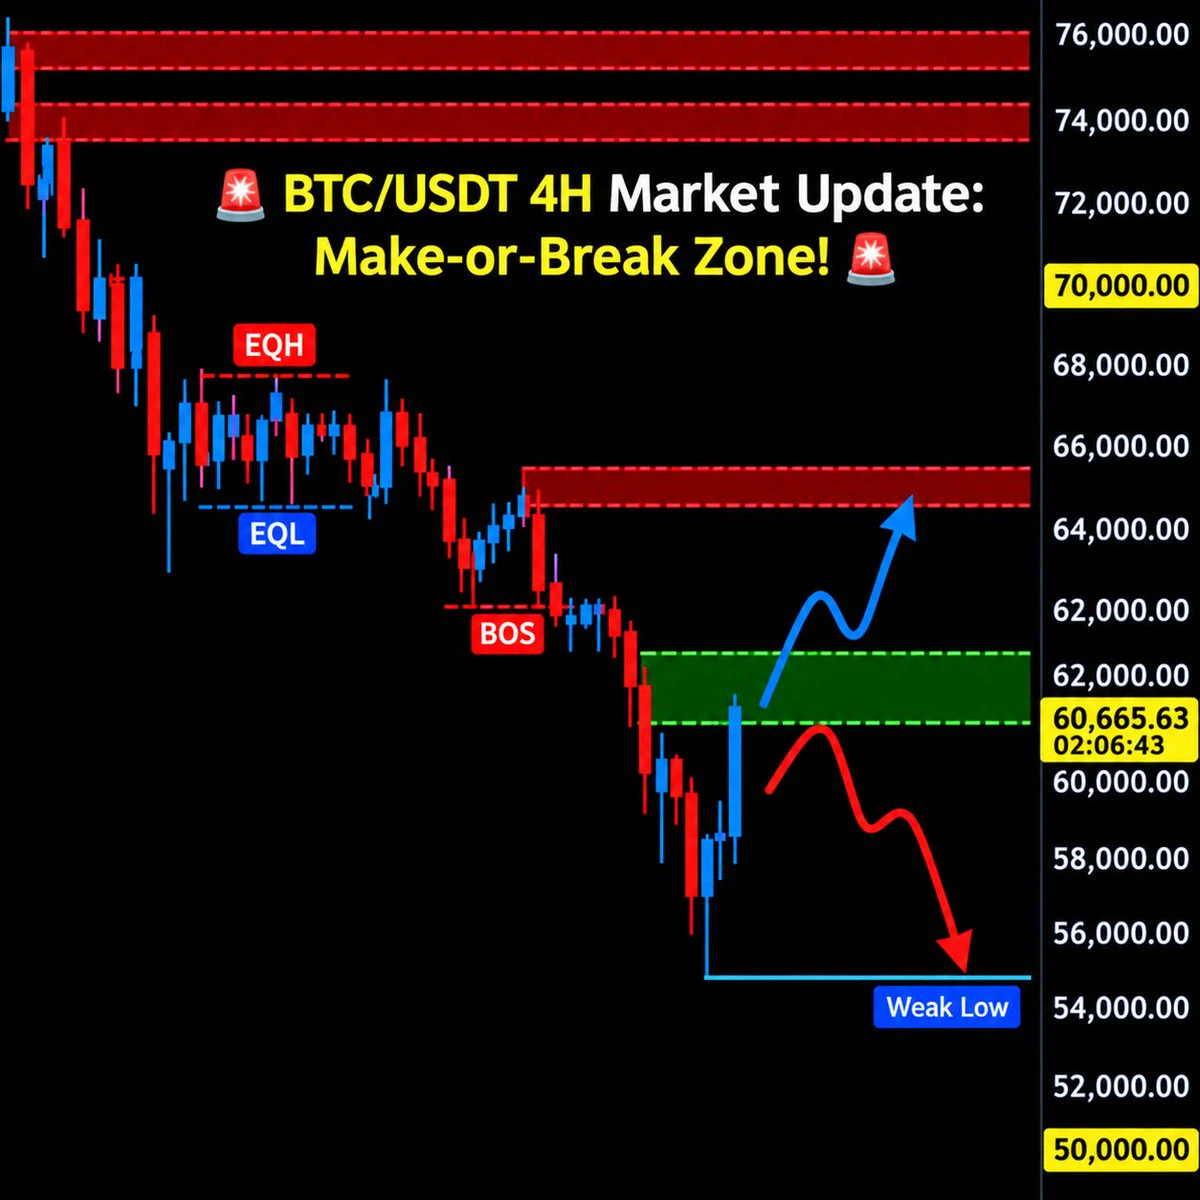
🚨 BTC/USDT 4H Market Update: Make-or-Break Zone! 🚨
Bitcoin is currently sitting at $60,665 right inside a critical decision zone ($59,800 – $61,500) after a sharp drop to $55,000.
With the overall trend still bearish and that $55,000 bottom acting as a "Weak Low," here are the two scenarios to watch next:
📉 Scenario 1: Rejection & Drop (Bearish)
If sellers defend this green zone and price gets rejected around $60,600, expect another leg down to sweep the $55,000 low.
📈 Scenario 2: Breakout & Bounce (Bullish)
If buyers push price cleanly above $61,500 and hold it as support, BTC could ra
post-image
BTC-0.67%
MARKIT UPDATE
live-cover
LIVE1,704
DOGE-0.22%
BTC-0.67%
ETH-1.26%
USDC+0.01%
SOL-0.77%
"Just one more dip before up only"
post-image
  • 1
The accountant isn’t worried when the books are off by two million, but immediately gets serious over a three-cent discrepancy.

If two million is missing, it’s “not going anywhere”—they’ll look into it after finishing other work. But if three cents are missing, they insist on finding it right away. Even if it’s a tiny amount, they say, you can’t just let it slide.

Every cent in the books has to reconcile. Even a one-cent discrepancy means something was misposted, and the books won’t close at year-end.
Question: What is the password?
post-image
Thank you to all my friends who supported me by voting for me in the Gate 2026 Annual Gala! You, too, can participate in the voting—doing so will earn you one entry into a lucky draw where you could win surprise prizes. https://www.gate.com/competition/Annual-Gala?ref_type=165&ch=Direct&ref=UFRFAQ0M
  • 6
Hawk, get in now and hold for five years at $1 each. Screenshot this. If it doesn’t reach $1, I’ll livestream myself eating shit
post-image
Only 6 strong signals this round: AKE, IDOL, MMT; 2 longs and 4 shorts. Watch volume and structure before acting. Queen: Last round was 3 wins and 3 losses, with a slight loss of 0.7%. The three ETHFI, ENSO, and JCT positions closed in the red. The current six-position average is +0.5%; observe for now and don't rush to judge the outcome. 🎯 Last round's returns: ETHFI entry at $0.4754 → exit at $0.4790, 5.0x leverage, gained +3.8%; ENSO entry at $0.4932 → exit at $0.4991, 5.0x leverage, gained +8.2%; JCT entry at $0.0017 → exit at $0.0017, 5x leverage, gained +3.0%━━━ Market Outlook ━━━BTC $5
post-image
AKE+6.07%
IDOL-6.71%
MMT-2.35%
ETHFI+1.52%
ENSO-2.90%
$BNB — Buyers are pushing to break through the price again 🚀BNB showed strong recovery momentum around $543. If buyers continue to control the situation and the price breaks through nearby resistance, we may see further gains toward the next resistance area. Trading strategy: long 📈Entry price: 541.50 – 544.00Take profit 1: 548.00Take profit 2: 551.00Take profit 3: 556.00Stop loss: 534.00
post-image
BNB-0.76%
Watching American TV shows has been called a low-cost form of personality correction.

That’s a pretty spot-on observation. The differences in storytelling conventions between American, Japanese, and Korean dramas are indeed quite significant.
[New Streamer] Market Prediction
live-cover
LIVE1,936
BTC-0.67%
Nvidia has lost $2.7 trillion in market cap in a month and a half—enough to wipe out an entire Amazon in one month! 😱 We’re witnessing history. A month ago, Nvidia was the god of global market cap. A month later, it can’t even crack the top three. 📉 🚨 Take a look at these terrifying numbers: • It fell from $5.77 trillion to $3.03 trillion, shedding $2.74 trillion. • What does that mean? It’s equivalent to the entire Amazon being wiped off the face of the Earth. • It plunged 14% in a single day and closed lower for seven straight weeks, its longest losing streak since the 2008 financial cris
post-image
NVDA-13.84%
AMZN-3.90%
ETH-1.26%
“From 55k to 60k in Just a Few Hours—Don’t Chase This V-Shaped Rebound”

Late Friday night, BTC wicked down to 55k, sending the Fear & Greed Index plunging to 11, nearly its all-time low, before rebounding above 60k overnight. Last night, shorts were squeezed for more than $200 million in just four hours—a classic cascade of long liquidations. Someone asked me if this was the bottom. I said: It looks like a bottom, but it isn’t one yet.

Why it looks like a bottom: Short-term holders moved 700k BTC to exchanges over the past month, and only 2.5% are still in profit. After that much selling, ne
BTC-0.67%
ETH-1.26%
AAVE-1.22%
  • 3
  • 2
#BTC跌破6万美元关口 It is still too early to confirm that the bottom is in. The price briefly fell below $60k and then recovered, which looks more like an oversold bounce than a sign that capital flows have turned positive. It needs to hold $60k first and then climb back above $63k before stabilization can be said to have begun.

Where things stand
· November 21: It briefly fell to $55,130, its lowest level since September 2024.
· Morning of November 22: It recovered to around $60,300, up about 2% over 24 hours.
· Nature of the rebound: This 9% rebound was driven mainly by short covering and liquidat
BTC-0.67%
Over the past 24 hours, data on the top ten most profitable whale addresses on-chain has surfaced, and the conclusion is clear: shorts are crushing longs, while the divide in capital flows is widening.

Let’s see what these top profitable addresses are betting on:
1️⃣ $HYPE Long position: position size of $83.2525 million, equivalent to 1.38 million HYPE 2️⃣ $BTC Long position: position size of $58.2131 million, equivalent to 979.11 BTC 3️⃣ $NVDA Short position: position size of $52.183 million, equivalent to 401,900 NVDA 4️⃣ $BTC Short position: position size of $51.6939 million, equivale
post-image
HYPE+0.24%
BTC-0.67%
NVDA-0.35%
$MMT The key daily support was directly breached by a high-volume long bearish candle. This breakdown was my signal to enter a short ✅ I steadily captured a 75% return on this sell-off 📉 and booked profits.
Today, keep a close eye on these two: $VVV and ETH.
$MMT Now it looks like a group of trapped bulls stubbornly defending their last line of support. I think support will eventually give way, completely shaking out the bulls who lack conviction. So I’m considering setting up short positions on $MMT .
Entry range: 0.2084 - 0.2130 Take-profit range: 0.1949 - 0.1823 Stop-loss: 0.2237
A remin
post-image
208
208208
Pump.Fun
MC:$3.98KHolders:1
0.71%
MMT-2.35%
VVV+0.37%
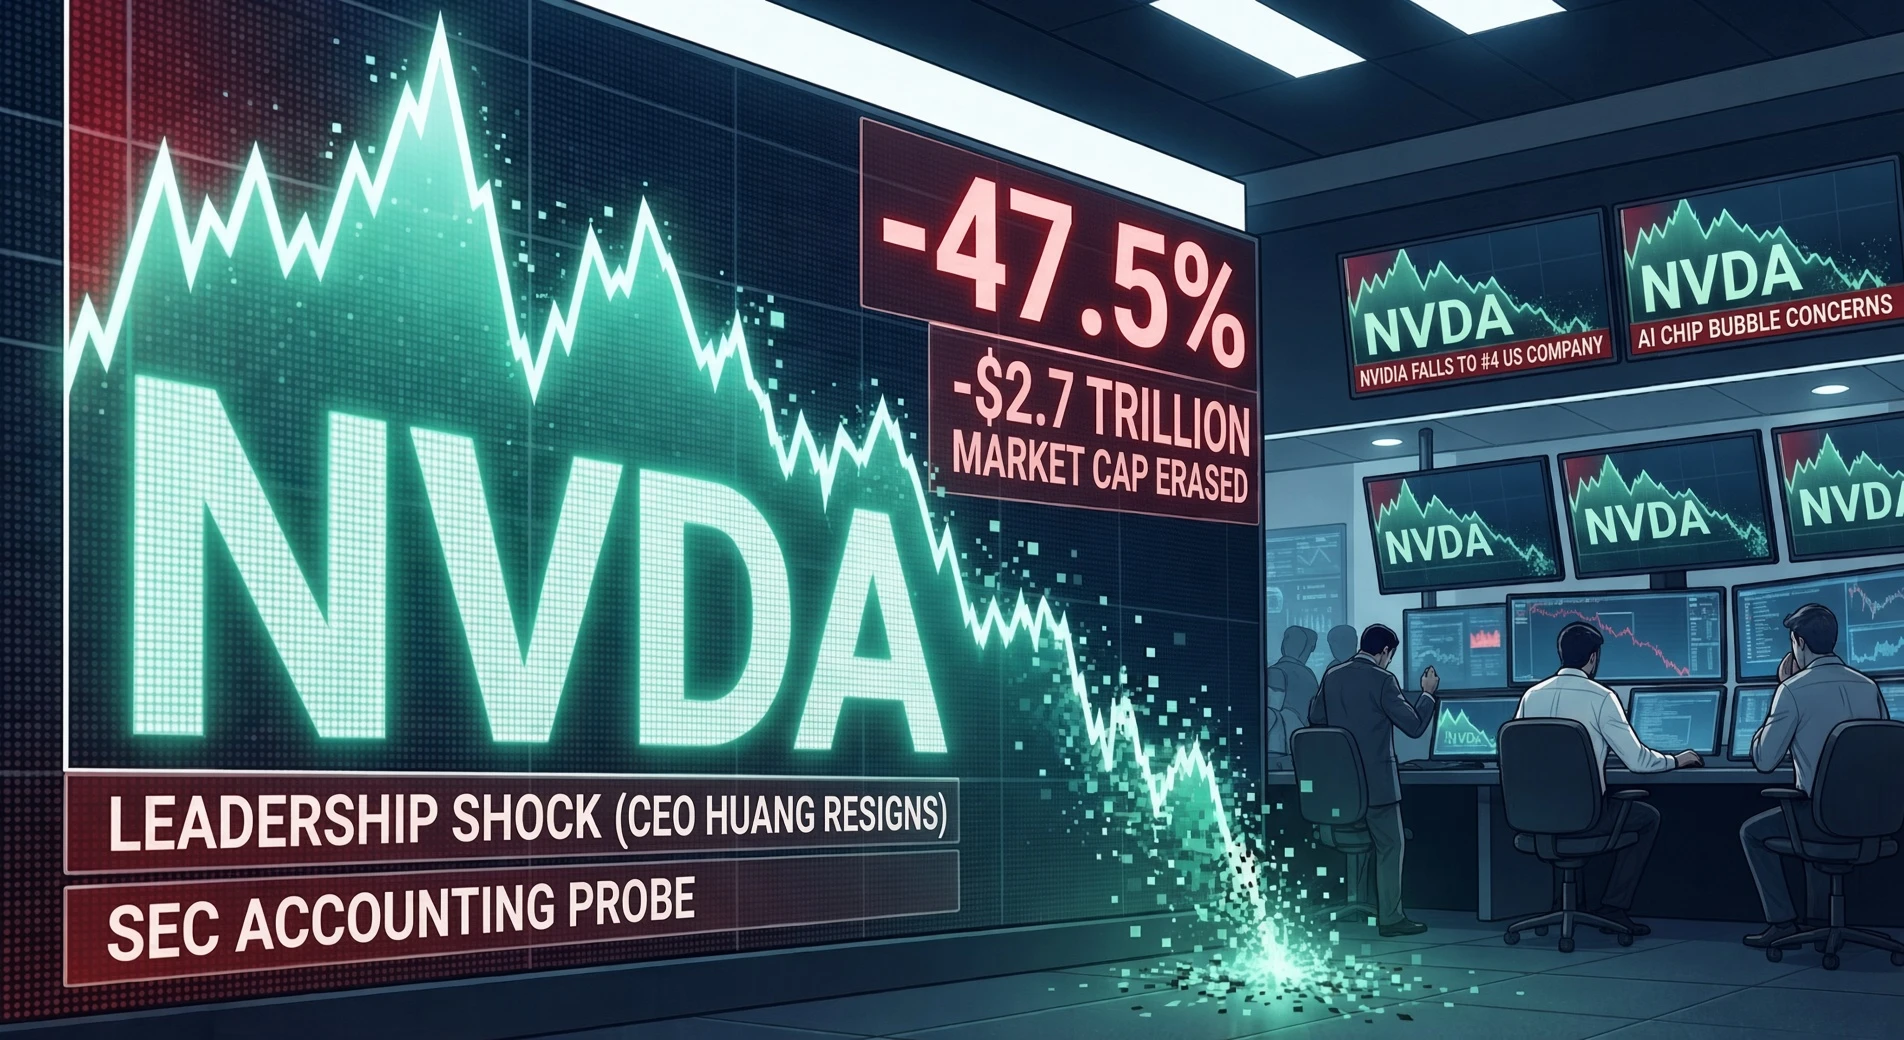
Historic Selloff: Nvidia Wipes Out $2.7 Trillion in 1.5 Months

Between its all-time high in early October 2026 and November 20, 2026, AI chip giant Nvidia (NVDA) lost roughly $2.7 trillion in market capitalization—erasing nearly 47% of its value (dropping from ~$5.77 trillion to ~$3.0 trillion) and marking its longest weekly losing streak since the 2008 financial crisis.

3 Key Drivers Behind the Rout:

- Leadership Shock: Co-founder and CEO Jensen Huang abruptly resigned in mid-November following personal scandals involving ties to a businesswoman suspected of intelligence links and U.S. exp
post-image
NVDAG-0.24%
Load More

Join 40 M users in our growing community

⚡️ Join 40 M users in the crypto craze discussion

💬 Engage with your favorite top creators

👍 See what interests you

Trending Topics

BTCReboundFaces60KTest

2.1M Views30.1K Discussing

BTC rebounded from around $55,300 on November 21, briefly reclaiming $60,000 before pulling back to around $59,300. The $60K level is back in focus as traders assess whether the recovery can last. Is this rebound a sign of stabilization or a short-lived recovery? Would reclaiming and holding $60K be enough, or do you need confirmation from trading volume and fund flows?

PCEAndGDPDataNextWeek

257.9K Views2.6K Discussing

GateDirectIPOPhase3ANTAllocates92100Shares

814.6K Views5K Discussing

View More