Share your thoughts
placeholder
Article
Why AVAX bears are hiding a trap most traders will miss.

$AVAX /USDT - SHORT

Trade Plan:
Entry: 9.664 – 9.764
SL: 10.343
TP1: 9.242
TP2: 8.927
TP3: 8.455

Why this setup?
Why now? The daily trend stays in a range, so short sellers need precision rather than conviction. The 15m RSI at 59.98 shows room to cool before a real slide begins. The 1h ATR of 0.201754 signals active swings, making the entry zone between 9.664 and 9.764 critical for clean execution. Targets at 9.242 and 8.927 offer a structured downside path, while 7.941 is the line that breaks the entire setup.

Debate:

⚠️ Perso
AVAX+17.85%
$XTZ The most unusual point today: up 30.46% in 24h, yet the funding rate is -0.0510%. With the price pushed this high, the futures market is still paying shorts, indicating this move is a spot-driven short squeeze rather than leverage-fueled false strength—this structure is the one most worth watching within the same sector.
For a cross-comparison: $HEI rose 16.34%, with a funding rate of +0.0050%, meaning longs are already paying, and RSI is 59.1; $DASH , by contrast, fell 3.07%, with MA5 breaking below MA20 and RSI at 41.6, clearly lagging. $XTZ has the largest gain, the lowest funding r
post-image
XTZ+29.35%
HEI+15.40%
DASH-3.55%
$ONE is holding the breakout area after a sharp rally; if another momentum push comes, this setup could advance toward higher targets...!!! It could also surge like $SUI
Entry: 0.00438 Stop-loss: 0.00380 Take-profit: 0.00520 → 0.00620 → 0.00780 Long $ONE ….‼️‼️BTCBreaks80K
post-image
SUI+6.54%
SBI brought Singapore-based Dtcpay’s Series A to $25 million—not to buy technology, but to secure stablecoin payment channels.
Dtcpay is a regulated payments company expanding its stablecoin merchant network and product lines to serve merchants handling real payments. SBI’s investment follows its previous round, further advancing its digital-asset strategy in Asia.
The stablecoin competition is shifting from who issues the coins to who settles the payments. The barrier to issuing coins is getting lower; the hard part is getting merchants to press that final payment button. Once the channels ar
post-image
I had already finished complaining to my friends about this week's market, but now I have to take it all back—kind of awkward.
A few nights ago, I checked $BR before bed. It was moving sideways at the bottom, buying pressure was strengthening, so I flagged a long entry. I didn't think too much at the time—just held according to plan. When it held the key level, I didn't rush to exit either.
Entered at 0.21096, now at 1.17136, +8968.52%. The wait wasn't in vain. It was truly sluggish at first, but the breakout feels great.
Don't lose patience grinding in a range, only to try to win back your di
post-image
BR+16.92%
ETH+0.20%
ZEC-1.04%
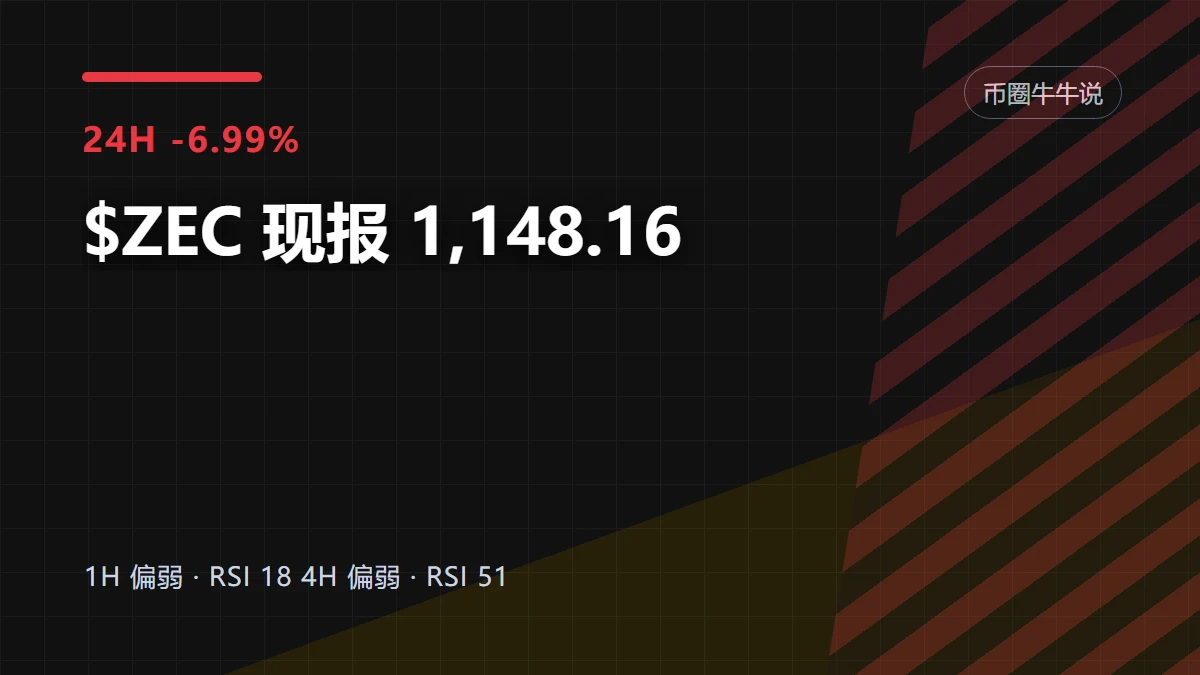
$ZEC /USDT is about to make the boldest move of the week.

$ZEC /USDT - LONG

Trade Plan:
Entry: 1468.91 – 1483.01
SL: 1408.25
TP1: 1526.74
TP2: 1560.60
TP3: 1611.39

Why this setup?
Why now? The daily trend is bullish, and the 1h price sits at 1475.96, which is the exact entry reference for this long setup. The 15m RSI at 28.6 shows the asset is deeply oversold, meaning sellers are exhausted and a bounce is likely. The 1h ATR of 28.21 tells us the real hourly volatility, so the entry zone between 1468.91 and 1483.01 is where smart money is accumulating. The first target is 1526.74, with a
ZEC-1.04%
BTC Trading Strategy
live-cover
LIVE33
TAO is range-bound daily but a hidden 4h setup suggests a short is forming.

$TAO /USDT - SHORT

Trade Plan:
Entry: 262.1 – 264.5
SL: 274.6
TP1: 254.8
TP2: 249.2
TP3: 240.7

Why this setup?
Why now? The 1h price is at 263.3, sitting inside the entry zone of 262.1 to 264.5, which aligns with the 15m RSI at 38.59 showing bearish momentum without being oversold yet. The 1h ATR of 4.712834 confirms the average move is large enough to reach TP1 at 254.8 and extend to TP2 at 249.2 if the daily range resolves downward. The invalidation level at 242.6 is the hard line that stops the thesis. This tr
post-image
TAO+5.47%
Buy the dip like it’s a crypto Black Friday sale! Planning to go long around $G . Trading plan: entry 0.00960 - 0.00982 target 0.01075 & 0.01158 stop loss 0.009120 Note: If local support fails to hold, it could trigger a deeper pullback toward the 1h MA25. Never go all-in, bro. Use a position size that suits your own account. Looking forward to that upward momentum. 👇👇👇Today I’m watching $XR and $EPIC .
post-image
XR-1.29%
EPIC+21.93%
$STRK Short-term key levels are 0.0397 support and 0.0464 resistance. The current price of 0.04226 is below the Bollinger middle band, with direction unclear but tilted bearish.
The Fear & Greed Index is 71, and the market remains in the greed zone. However, STRK fell 4.52% over 24h against the trend, significantly underperforming the broader market. The funding rate of +0.0050% shows that longs are still paying to hold positions, while the MACD histogram at -0.0005505 continues to signal bearish momentum, indicating a price-volume divergence. MA5=0.043042 and MA20=0.043037 are nearly converg
post-image
STRK-1.84%
BTC+0.04%
ARB-8.79%
$AKE basically can’t fall; if it does, it’ll be pulled back up. Just hold it—don’t sell until it reaches 100x. I’ve done this over several waves, and my cost basis has kept dropping.
AKE+58.55%
After a strong impulsive move, ONDO is testing MA25 support on the 15-minute chart and maintaining a bullish structure above 0.4100. RSI(6) is 37.35, and the asset is cooling off from overbought conditions, providing an opportunity to enter and continue moving higher toward the 0.4435 high with a higher probability. Go LONG now $OND !💪
Market entry: 0.42 - 0.43Main target: 0.4430Secondary target: 0.4574Stop-loss: 0.407Click here to trade 👇👇👇Market watch:$BT : Current price 81,402.4 - 24-hour change: +0.65%
$AK : Current price 0.064628 - 24-hour change: +70.33%
post-image
ONDO+5.46%
Up 31%—can it still be chased? Look at the data first: $G is currently at 0.00988, with MA5 crossing above MA20 and the MACD histogram still positive. The trend remains intact, but RSI 58.5 has retreated from its high, the 30-candle range is as high as 54%, the funding rate of +0.0304% indicates that longs are paying to hold positions, and the Fear and Greed Index at 71 is in the greed zone. With this combination, the risk-reward ratio of chasing higher is not favorable; a pullback is the opportunity.
My view remains bullish, but I will only accept an entry on a pullback. The reference entry
post-image
PEPE+8.94%
$PEPE PEPE: A Potential Trend Shift Ahead
P
PEPE/USDT
– Weekly Analysis
PEPE continues to trade within a descending channel, with price approaching the upper trendline and a key resistance area.
The breakout or rejection at this key zone will be important to watch.
post-image
PEPE+9.07%
Why is everyone still sleeping on HYPE while the 1h RSI whispers oversold?

$HYPE /USDT - LONG

Trade Plan:
Entry: 91.631 – 92.123
SL: 89.516
TP1: 93.648
TP2: 94.829
TP3: 96.599

Why this setup?
Why now? The daily trend is bullish and the 1h price is sitting at 91.877, which is also the entry reference, so the market is resting right at the sweet spot. The 15m RSI at 38.25 shows room to run before overbought, and the 1h ATR of 0.983846 tells us the next wave is about a dollar wide, giving the move real momentum. The entry zone between 91.631 and 92.123 frames the risk neatly, with TP1 at 93
HYPE-0.05%
Nobody is talking about the silver short forming right under your nose.

$XAG /USDT - SHORT

Trade Plan:
Entry: 66.52 – 66.60
SL: 66.90
TP1: 66.30
TP2: 66.13
TP3: 65.87

Why this setup?
Why now? The 1h price is sitting at 66.56, which is also the entry_ref, and the daily trend is range, meaning we are coiling for a directional move. The 15m RSI is 58.48, showing we are not yet overbought enough to trap shorts, while the 1h ATR of 0.142939 tells us the next candle could easily push the entry zone toward 66.60. If price sweeps that high, the invalidation level at 65.57 becomes the hard line i
XAG+0.39%
$XTZ ‌ is showing strong momentum on the 4H chart after a sharp breakout backed by rising volume.
Current price: ~$0.364
Entry zone: $0.355–$0.365
TP1: $0.380
TP2: $0.395
TP3: $0.405
SL: $0.338
The move is already extended, so I’d avoid chasing a sudden spike. Holding above the $0.34–$0.35 breakout area keeps the bullish structure intact, while a clean push through $0.38 could open another expansion leg.
Risk management first — wait for price confirmation.
#XYZ #JapanRealEstatePowerChipStocksRise #GateTopsStockPerpetualCoverage #GateSquareMidAutumnReunion
post-image
XTZ+29.35%
  • 9
  • 2
Everyone calling ADA a range-bound grind just ignores this setup

$ADA /USDT - SHORT

Trade Plan:
Entry: 0.2303 – 0.2319
SL: 0.2405
TP1: 0.2241
TP2: 0.2194
TP3: 0.2123

Why this setup?
Why now? The 1h price sits at 0.2311, which matches the exact entry_ref, while the daily trend is range, suggesting a breakout is overdue. The 15m RSI at 64.77 shows momentum is still leaning bullish, making a reversal into a short position timely. The 1h ATR of 0.003006 confirms enough volatility to push the invalidation level of 0.2405. Entering near 0.2311 gives a tight risk-to-reward, with TP1 at 0.2241 a
ADA+2.96%
Financial News, Crypto Market Updates, Real-World Strategies
live-cover
LIVE937
#每周来晒 #周末行情你看涨还是看跌 Rate hike delivered, short squeeze rally! BTC surged 6% in a single day, breaking above 81000—chase the rally or wait for a pullback?
Macro analysis: The dovish dot plot following the rate hike sent the short squeeze rally into overdrive
The biggest event this week was the Fed’s rate hike. Let’s break down the signals.
First, rates were raised by 25 basis points, but the dot plot was dovish.
The Fed raised interest rates by 25 basis points on Wednesday, its first rate hike since 2023. However, the accompanying dot plot forecasts a median policy rate of only 4.1% by the end o
post-image
BTC+0.16%
Load More

Join 40 M users in our growing community

⚡️ Join 40 M users in the crypto craze discussion

💬 Engage with your favorite top creators

👍 See what interests you

Trending Topics

JapanRealEstatePowerChipStocksRise

59.72k Views4.54k Discussing

Japan's Nikkei extended gains on Sept 18, with real estate, power, and semiconductor sectors leading. Gate covers over 12,800 global stocks and ETFs, offering one-stop USDT trading across US, HK, Korean, and Japanese markets. [👉 Read more](https://www.odaily.news/en/newsflash/518749)

USAIConceptStocksRally

34.43k Views1.01k Discussing

GateTopsStockPerpetualCoverage

38.69k Views2.6k Discussing

View More