Share your thoughts
placeholder
Article
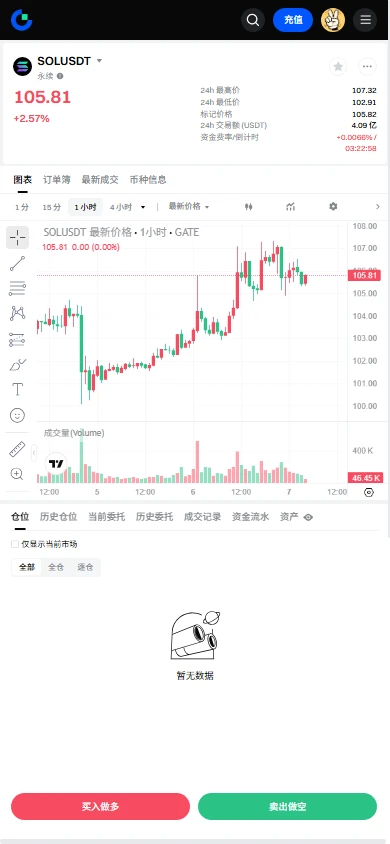
$SOL Signal】Go long, trading around the 105.3 support
$SOL 4H RSI surged to 60.7, the 1H MACD histogram turned green at -0.17, and the price is stuck at 105.6. The 4H Bollinger Bands narrowed to 100.6-106.9, while the 1H bands are opening downward. The order book bid ratio is 1.05, with dense buy walls at 105.28-105.60 below; the negative funding rate of -0.0016% shows no signs of overcrowding. Bulls and bears are battling around 105.3, with a turning point approaching. Buying the dip offers a slightly better risk/reward ratio than chasing shorts.
🎯Direction: Long
⚡Entry/Limit Order: 105.283
post-image
SOL+2.22%
BTC+0.09%
ETH+1.12%
#NewTechnology 😎
#Samsung #GalaxyZroll
Samsung’s Galaxy Z Roll:
Dual Motors and Rolling Glass...
The defining feature of the Galaxy Z Roll is its rollable OLED display, a technological advancement that eliminates the hinges and screen creases commonly associated with foldable phones. Instead of folding, the display extends outward in a smooth, controlled motion, offering a larger, uninterrupted screen.
This innovative design not only enhances the device’s aesthetic appeal but also provides a more immersive and functional user experience.
Key features of the rollable display include:
- A ful
post-image
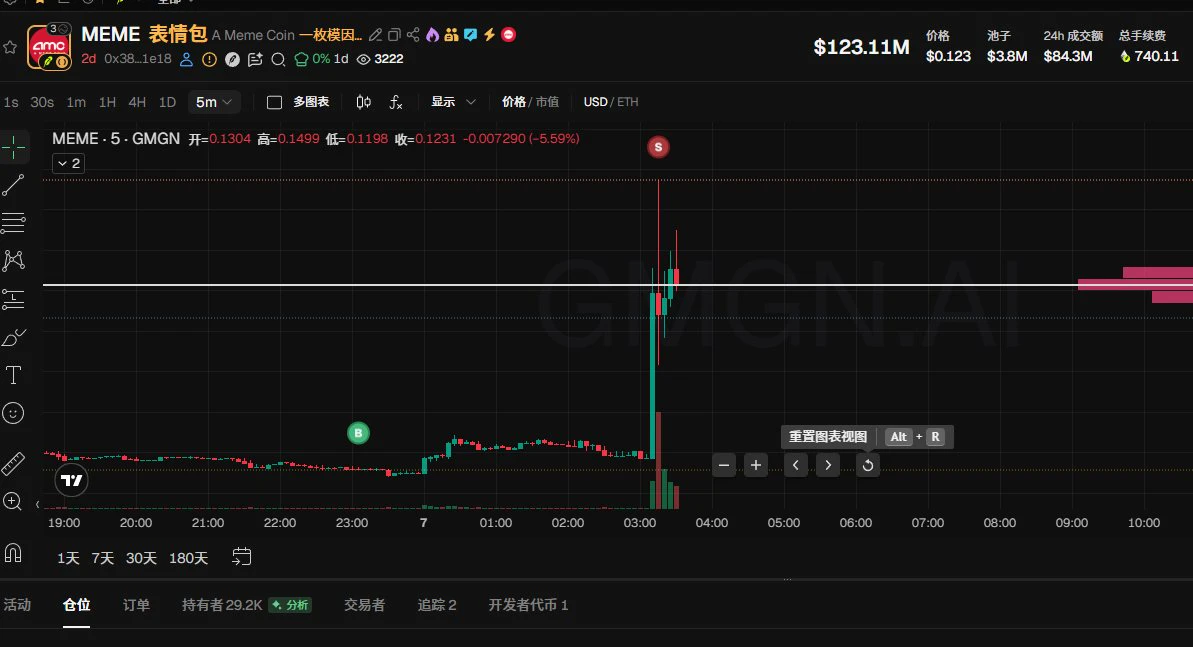
Back for one round and already eating? How could I accept this?
Is the momentum really this good now? #MEME
Get in quick, bros.
post-image
MEME-2.11%
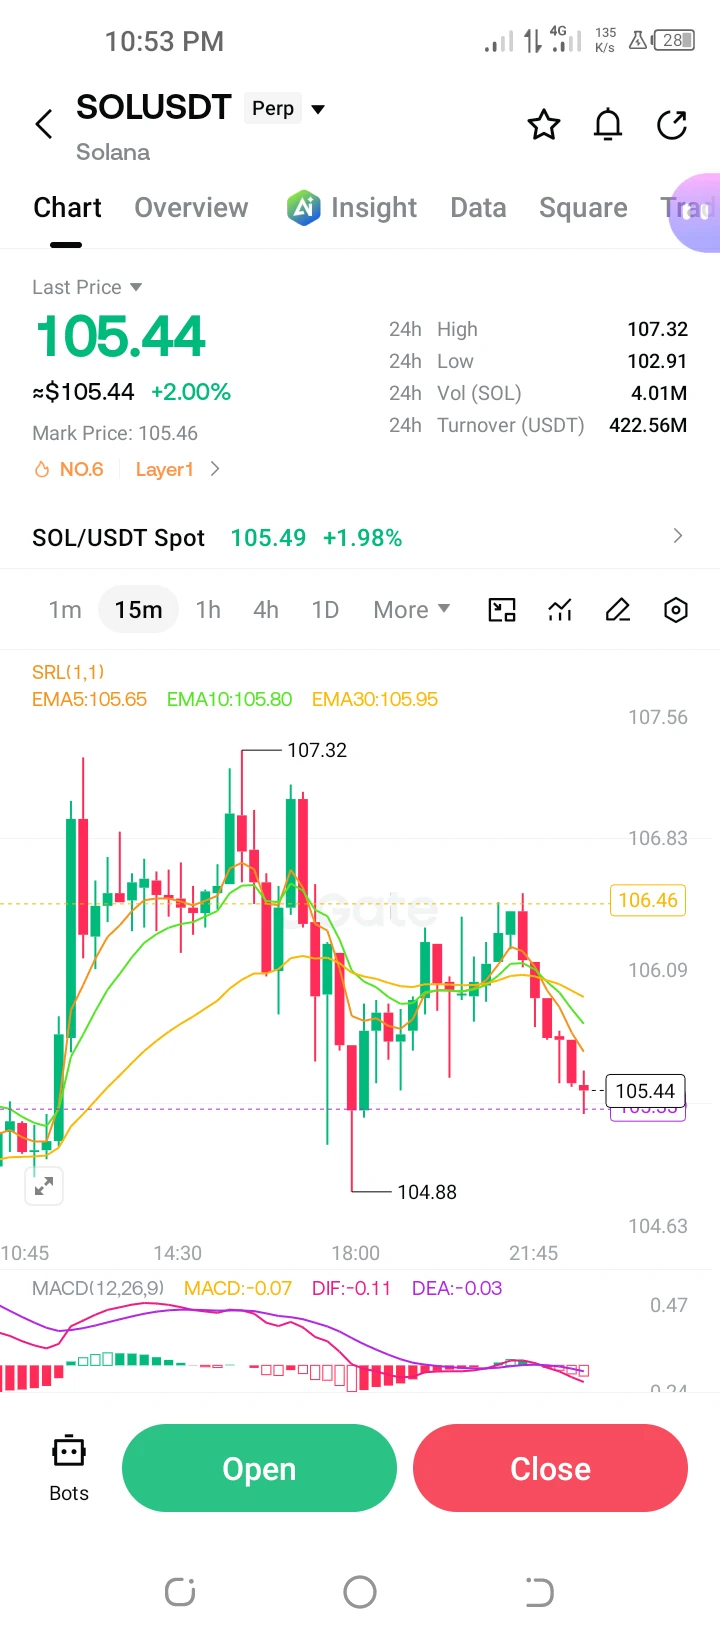
$SOL /USDT Perp – "Trend Breakdown – Short"**
**Trading Plan Short $SOL
Entry: 105.44
SL: 106.10
TP1: 104.88
TP2: 103.50
Explanation: Trading below the EMA cluster (105.95) with negative MACD, aiming for the 104.88 purple support and the 102.91 low.
post-image
SOL+2.22%
  • 3
Everyone’s long ZEC—but my 4h chart just whispered a secret that could ruin your Friday.

$ZEC /USDT - SHORT

Trade Plan:
Entry: 1206.8 – 1222.6
SL: 1313.6
TP1: 1140.5
TP2: 1091.0
TP3: 1016.8

Why this setup?
- RSI on the 15m is still hot at 61, while price stalls under 1214.7—momentum is fading, not flipping.
- With 84% confidence on a SHORT and TP1 at 1140.5, the risk/reward from 1222.6 to 1091 (TP2) is nearly 1:3.
- The bullish 1D trend is the trap: it’s pulling in late buyers right as the 4h structure rolls over.
- Why now? Because ATR (31.7) says volatility is expanding—and it’s
ZEC+21.33%
Everyone’s watching the 4H timeframe, but the real trap is hiding in the 15-minute RSI.

$BULLA /USDT - SHORT

Trade Plan:
Entry: 0.071460 – 0.074848
SL: 0.089419
TP1: 0.060955
TP2: 0.052823
TP3: 0.040624

Why this setup?
- BULLA flashes SHORT at 55.4% confidence, yet the 15m RSI sits at 47.2—not oversold, not exhausted.
- Price is pinned at 0.073154 inside a 1D range, with ATR (0.0067) hinting at a squeeze.
- Why now? The range low at 0.071460 is the last defense; a break there opens the slide to TP1 (0.060955) and beyond.
- If bulls reclaim 0.074848, the alt setup flips to long—this
BULLA-14.61%
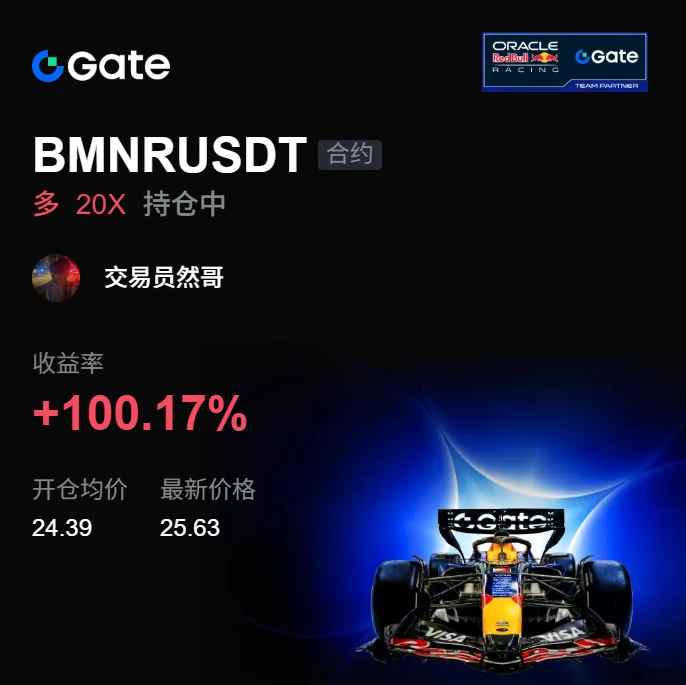
This kind of return makes me both thrilled and uneasy, worried the market will come to its senses tomorrow and blacklist me.

When I opened the chart this morning, $BMNR was repeatedly testing around 24.39. The most agonizing part is before the move starts, but as long as the bottom consolidation holds and funds quietly flow back in, I know the direction is most likely up. I entered in batches without chasing.

When I checked the chart after lunch, the price had already climbed to 25.62, taking my return straight to +100.17%. This level feels almost too good to be true, but looking back at
post-image
BMNR+1.98%
SNDK+1.08%
XRP+0.36%
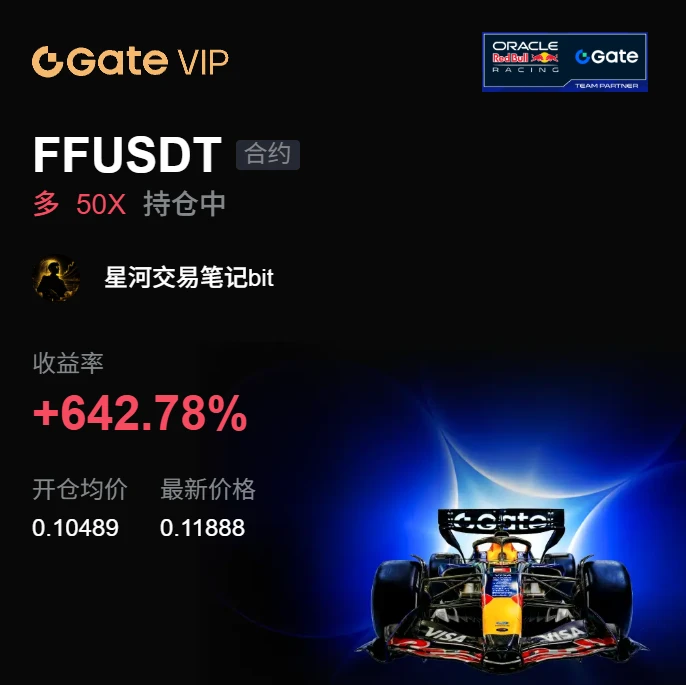
This $FF long trade early this morning was a pullback confirmation after a breakout on the hourly chart. I entered at 0.10489, with the stop-loss placed below the lower boundary of the range. The price action was grinding and testing my patience; consecutive small bearish candles failed to break the key level, while volume contracted. I held the position without moving, and two small wicks failed to take me out.
When it pushed up on increased volume, I first took profit on 70%, then moved up the protective stop on the remaining position. I did not chase because the move was too fast, making th
post-image
FF-0.36%
ADA+0.77%
LAB-4.97%
A few days ago, my hand trembled as I set the stop-loss; this morning I realized that was an unnecessary act of filial piety. Even when the screen was glowing green, I was still nervous, but this move never once looked back to give me a chance to get in or add to my position—instead, it let me hold all the way to now.
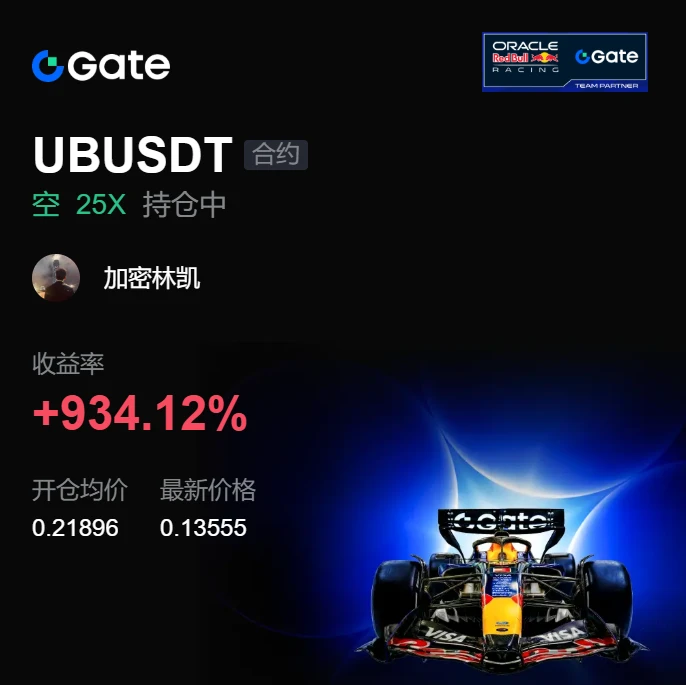
During the repeated intraday swings, I said that every time the price came back to test 0.21896, it simply could not break higher, and each rebound was for a better move downward. Now that my bullish view has been proven right, I won't pretend otherwise. From entry to the current
post-image
BTC+0.08%
LAB-4.97%
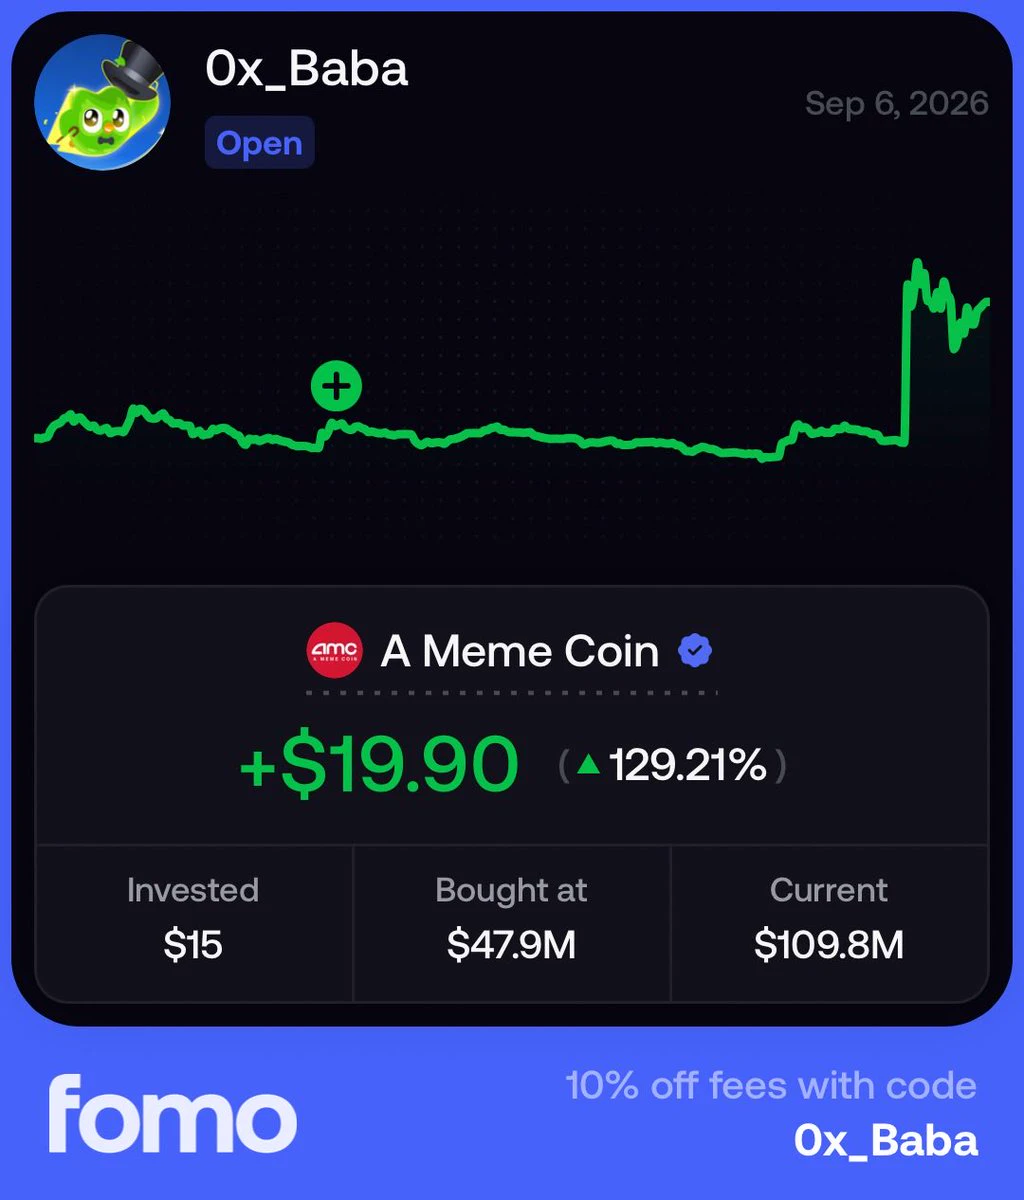
What can be the AMC top? I’m a bit conflicted.
post-image
AMC-1.11%
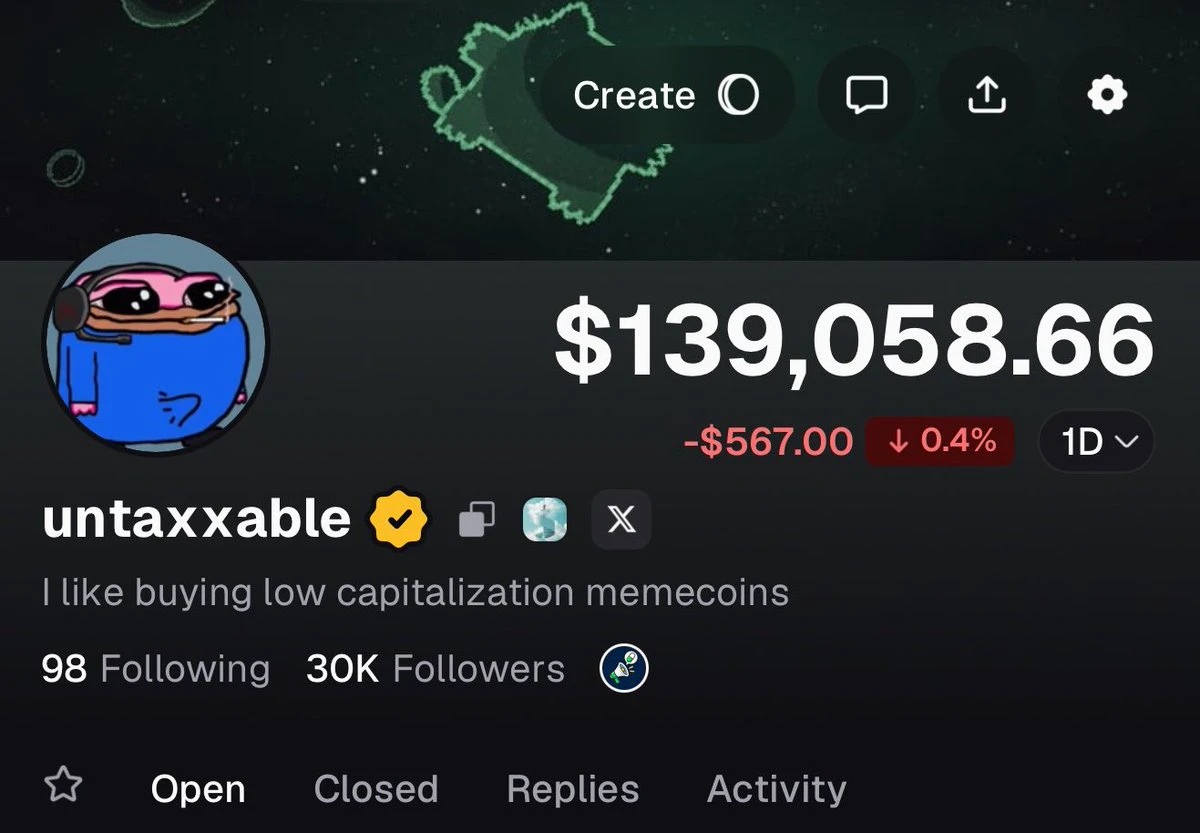
Thank you guys for 30,000 followers.
Truly amazing.
post-image
Everyone is focused on Bitcoin’s weekly close $BTC
, while I’m focused on taking profits in altcoins 💲🤑
The idea of all coins forming a new bottom has become a distant dream
You took the bait, my bear-market friend... you took the bait 😘
post-image
BTC+0.09%
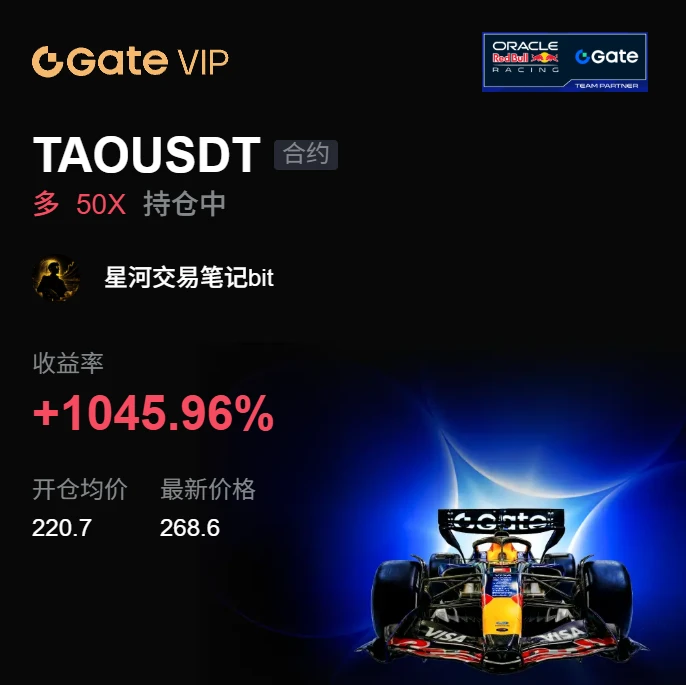
The early-session price pulled back to around 220.7 and stabilized, so I went long directly. The plan is simple: as long as the hourly candle body does not break down, the target above is the high-volume trading zone, with the stop-loss placed simultaneously.

After entering, it consolidated for a short while, with one wick in between, but I did not adjust the position. Once the hourly candle closed bullish again and pushed higher on increased volume, I took 70% off at the first target and moved the stop-loss on the remaining position directly above the breakeven line.

The subsequent rise w
post-image
SOL+2.22%
DOGE-0.86%
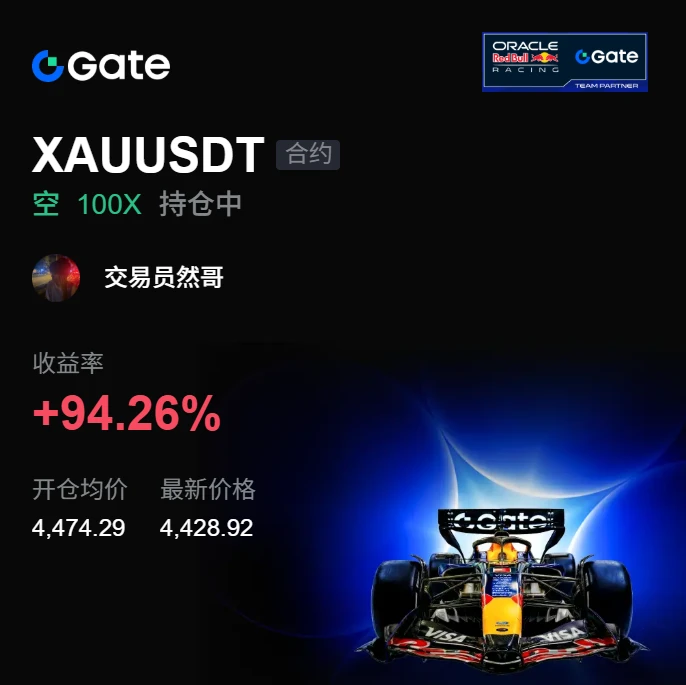
This return has me feeling both thrilled and apprehensive, afraid the market will come to its senses tomorrow and blacklist me.

A few days ago before bed, $XAU made another push upward. When it approached 4474.29, my heart skipped a beat: I couldn't chase the long; the rebound was weak and volume hadn't followed through. No matter how I looked at it, it seemed like a bull trap. At that point, I placed another short order, set the stop-loss above, and shut down my computer to sleep. When I opened my eyes this morning, the price had already slid to 4428.93, and the return had jumped straight
post-image
XAU-0.14%
SNDK+1.08%
LAB-4.97%
Bitcoin swing longs and swing shorts both pocketed 800 points🥩
Going long on the way up and short on the way down—feels great!!!
BTC+0.08%
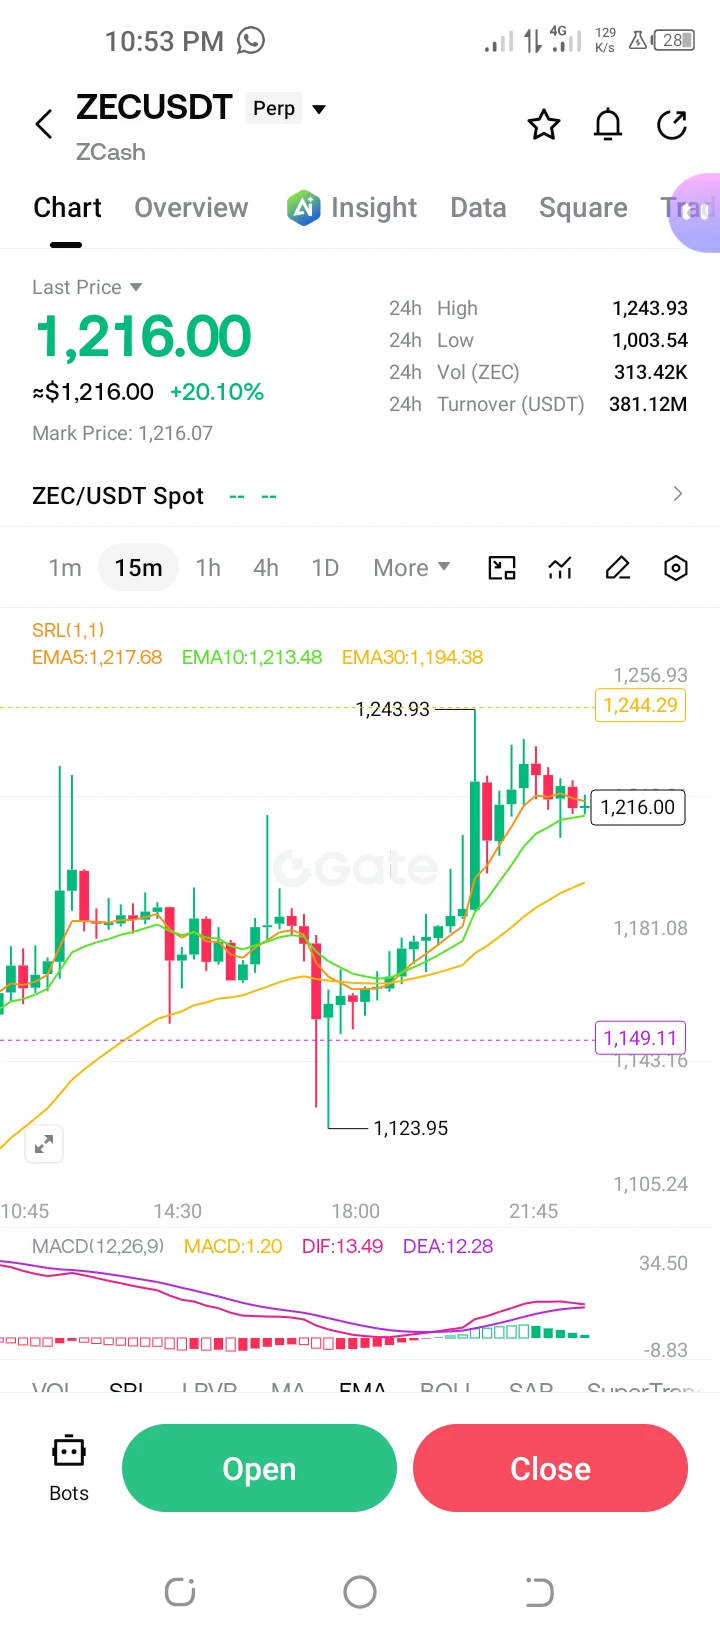
$ZEC /USDT Perp – "Strong Momentum – Long"**
**Trading Plan Long $ZEC
Entry: 1216.00
SL: 1200.00
TP1: 1225.00
TP2: 1243.93
Explanation: Massive bullish momentum with a highly positive MACD (1.20), targeting the 1244.29 yellow resistance and the 1243.93 high.
post-image
ZEC+21.33%
  • 4
  • 2
Beginner Trader - Real Account Live
live-cover
LIVE72
Everyone, are you satisfied with this yield and stability?
#Gate事件合约晒单挑战
Zcash has moved ahead of Dogecoin to become the tenth-largest cryptocurrency by market capitalization. Latest data from CoinMarketCap and market reports on September 6, 2026 show ZEC’s market value at approximately 19.64 billion dollars, placing it above DOGE.
ZEC has traded in a strong upward range in recent sessions, with prices moving through the 1,000 to 1,170 dollar zone on elevated volume. Circulating supply sits near 16.8 million coins against a maximum of 21 million. This relatively limited float has magnified the effect of recent capital inflows. Over the past thirty da
post-image
ZEC+21.37%
DOGE-0.81%
Load More

Join 40 M users in our growing community

⚡️ Join 40 M users in the crypto craze discussion

💬 Engage with your favorite top creators

👍 See what interests you

View More