Square
Following
Hot
News
Profile
Share your thoughts
placeholder
Article
Social experiment but after confirming villian monkey is behind the “Neymar” token.
I recant my post. I do not endorse this token or encourage anyone to buy after new evidence.
If you still buy, it’s at your own risk. Enjoy your day. 👍🏾
post-image
Oversold rebound does not alter the weak trend! 4110 support temporarily holds, while bears await an opportunity to probe lower again
Gold extended its bearish move overnight, falling on increased volume and touching the key support at 4111 before beginning a technical recovery. It oscillated higher during today’s Asian session, reaching a high near 4168 before encountering resistance, and is currently trading around 4157. Overall, it remains in a weak oscillating pattern of “accelerated decline and oversold recovery.” Bears still have the upper hand in the bull-bear battle. The 4110 area is a
post-image
GLDX+1.79%
PAXG+1.49%
XAU+1.72%
Retail investor: Oil’s back over $100 & they’re hitting tankers in Hormuz again. I’m thinking about going to cash till it calms down
Me: When does it calm down?
Retail investor: idk... when the war’s over?
Me: Brent oil hit around $118 back in March when the strait shut down. Everybody was saying exactly what you’re saying...
Retail investor: & what happened?
Me: Nasdaq made a new all time high a few weeks later and now up over 30% from that point.
Retail investor: with all this still going on??
Me: Yep. The market doesn’t wait for the all clear. It moves as soon as it figures out earnings are
post-image
BZ-0.34%
NDAQ+1.57%
2026-10-15 20:14 UTC. Following clean target completions on BTC and SOL in the previous session, WAL/USDT rejected off its upper boundary and pulled back -4.87% from its 0.05385 peak. Price now sits around ~0.05123 USDT, resting in the lower third of its range just below its central equilibrium. Upper resistance is mapped at the SHORT ZONE (0.0535882 - 0.0537676 USDT), while lower demand holds the LONG ZONE (0.0498204 - 0.0499998 USDT) around the primary TARGET ZONE at ~0.052276 USDT. AKE/USDT also holds a clean structure (SHORT: 0.0367231 - 0.0370425 | LONG: 0.0300153 - 0.0303347 | TARGET: ~0
post-image
BTC+0.60%
SOL+1.62%
WAL-17.25%
AKE+21.81%
SNXX-1.18%
#Gate衍生品份额增幅全球第一
Like the brightest star in the sky, Gate shines ever brighter among crypto exchanges with each passing month.
Gate Ranks Among the World's Top 3 Derivatives Exchanges!
According to the September exchange review, Gate continues to strengthen its position in the global derivatives market.
Growth Leader: Recorded the highest growth rate among leading global centralized exchanges.
$396.4 Billion Trading Volume
September derivatives trading volume rose by 38.2% compared to the previous month, allowing it to surpass other crypto exchanges and secure third place globally.
10.1% Mark
post-image
HYPERLIQUID $HYPE REJECTING MOVING AVERAGE RESISTANCE ARE BEARS TARGETING $78.06 NEXT?
Pair: $HYPE /USDT
Direction: SHORT
Entry Price: 81.62
Target Levels (Take Profit)
TP 1: 79.48 2.62%
TP 2: 78.06 4.36%
Stop Loss
SL: 84.47
Technical Breakdown
HYPE ($81.565) faced strong sell-side rejection following an impulsive upward push, printing a topping wick right at overhead structural resistance. This price action confirms persistent seller defense and sets up a clean continuation toward lower targets.
Price action tested areas above short-term moving averages before meeting heavy distribution
HYPE+0.32%
first day calling on @Pumpfun
bullish tek!
post-image
$ADA needs to close the day above the green line.
That wick looks really nice, hopefully it can pump a little more are close around $0.24
post-image
ADA+0.79%
Everyone, $XPL has provided another excellent buying opportunity.
Quickly open another long position now. Entry price: $0.08561 – $0.08610Target price: $0.08700 / $0.08850 / $0.09002Stop-loss: $0.08319
post-image
XPL+9.37%
BREAKING: Aster now lets traders deposit and withdraw BTC directly on the Bitcoin network. It adds to existing support for wrapped BTC on EVM chains, on an exchange holding $762.31M in deposits.
@Aster_DEX
ASTER+0.52%
BTC+0.60%
😭😭 Nah, this cat needs to be investigated immediately because WHAT WAS THE PLAN HERE??? 💀🍖
Bro walked into the kitchen like a professional thief, opened the pot, selected his favourite piece of meat, and was already opening his mouth for the first bite. 😂
Not even a little bit of fear. Not even one second of regret. Just pure confidence from a cat with ONE BRAIN CELL. 😭🐈
Then the owner appeared behind him…
AND THIS GUY’S ENTIRE SYSTEM SHUT DOWN. 💀💀
The meat stayed in his hand. His mouth stayed open. His eyes started asking questions his brain couldn’t answer. Even the loading circle o
Bitcoin Support and Resistance Levels
live-cover
LIVE607
$XPL #XPL
Rising towards resistance of symmetrical triangle.
Breakout could follow our projection for a solid bullish rally✍️
XPL+10.09%
  • 1
✨ US Data Update: What Today's Numbers Signal for Markets
🔹 A dense set of US economic data released today painted a picture of an economy that remains resilient, but with inflation pressures proving more persistent than expected. The combination of hot inflation, strong consumer spending, and a tight labor market is reshaping rate expectations.
📊 The data on the table:
🔹 PPI (Producer Price Index): September PPI rose 1.3% MoM and 6.3% YoY, far exceeding the 0.5% and 5.3% forecasts. This is the largest monthly increase since March 2022. Core PPI, excluding food and energy, rose 0.7% MoM and
post-image
User_any
#美国9月PPI大超预期 ✨ US PPI Inflation Surges to 6.3%, the Highest Since Late 2022
🔹 The US September Producer Price Index (PPI) rose 1.3% month-over-month and 6.3% year-over-year, significantly exceeding the consensus estimate of 5.3%. This marks the largest monthly increase since March 2022 and the highest annual reading since December 2022.
📊 The data behind the print:
🔹 Core PPI: Excluding food and energy, core PPI rose 0.7% MoM and 5.0% YoY, both above expectations.
▪️ Energy: Energy prices surged 10.8%, accounting for more than 80% of the broad-based increase in goods prices. Gasoline jumped 20.3%.
▪️ Context: The reading follows Wednesday's CPI report, which also came in above forecasts at 3.7% YoY headline and 2.6% core. Retail sales for September rose 0.8% MoM, beating the 0.3% estimate.
⚖️ Market impact:
🔹 Bitcoin: Briefly fell below $80,000 to $79,800 before rebounding to near $82,000. Market-wide liquidations reached approximately $930 million over 24 hours, with long positions accounting for $780 million. The $80,000–$81,500 zone remains a critical support area, overlapping with the estimated ETF cost basis.
▪️ US Equities:The S&P 500 and Nasdaq 100 traded mixed, with tech and semiconductor names under pressure. The Philadelphia Semiconductor Index fell over 4% in the prior session. Cyclical sectors and the Dow Jones outperformed as investors rotated toward defensive positioning.
▪️ Treasuries & Dollar: The 10-year Treasury yield dipped to approximately 5.04% from 5.10%, as safe-haven demand for bonds offset the inflation surprise. The dollar index retreated from its 18-month high toward 102.0.
▪️ Gold & Silver:Spot gold recovered above $4,150, up over 1%, while silver rebounded above $56.9 per ounce, gaining more than 2.4%. The recovery was driven by falling yields, a softer dollar, and renewed safe-haven demand.
⚖️ Structural perspective:
🔹 The PPI acceleration broadens the inflation narrative beyond consumer-level price pressures. With producer costs rising across energy, transportation, and services, the data reinforces the case for the Federal Reserve to maintain a restrictive stance. Markets now price roughly a 29% probability of a rate hike at the October 27-28 meeting, with December tightening expectations remaining elevated.
▪️ For risk assets like Bitcoin, the primary pressure channel is the rate outlook: higher-for-longer borrowing costs reduce the relative appeal of non-yielding assets. Gold and silver, however, face a more layered dynamic, balancing safe-haven demand against real-rate headwinds.
▪️ The key variable ahead is whether the Fed signals patience at the October meeting or adopts a firmer tone. Until that guidance arrives, markets are likely to remain in a recalibration phase, with capital rotating selectively between growth, defensive, and hard-asset exposure.
🔹 How are you assessing the market's response to two consecutive inflation surprises? 👇
#PPI #Inflation #Bitcoin #Gold
Not financial advice.
repost-content-media
BTC+0.60%
US500+0.30%
NAS100-0.07%
  • 1
ETH is currently around 2,450, maintaining an overall weak recovery. This rebound is merely a technical bounce after the decline, not a reversal, and the bearish structure remains intact.

On the 4-hour chart, the price is pressured by the moving averages, rebound volume is insufficient, the Bollinger Bands remain in a downward trend, and overhead resistance is dense. This rise is merely a corrective move within the downtrend, with limited upside and relatively high pullback risk.

On the 1-hour chart, short-term fluctuations are showing a mild recovery, but bullish momentum is lacking. This
post-image
ETH+0.84%
Does a bullish moving-average alignment always mean you should chase long positions?
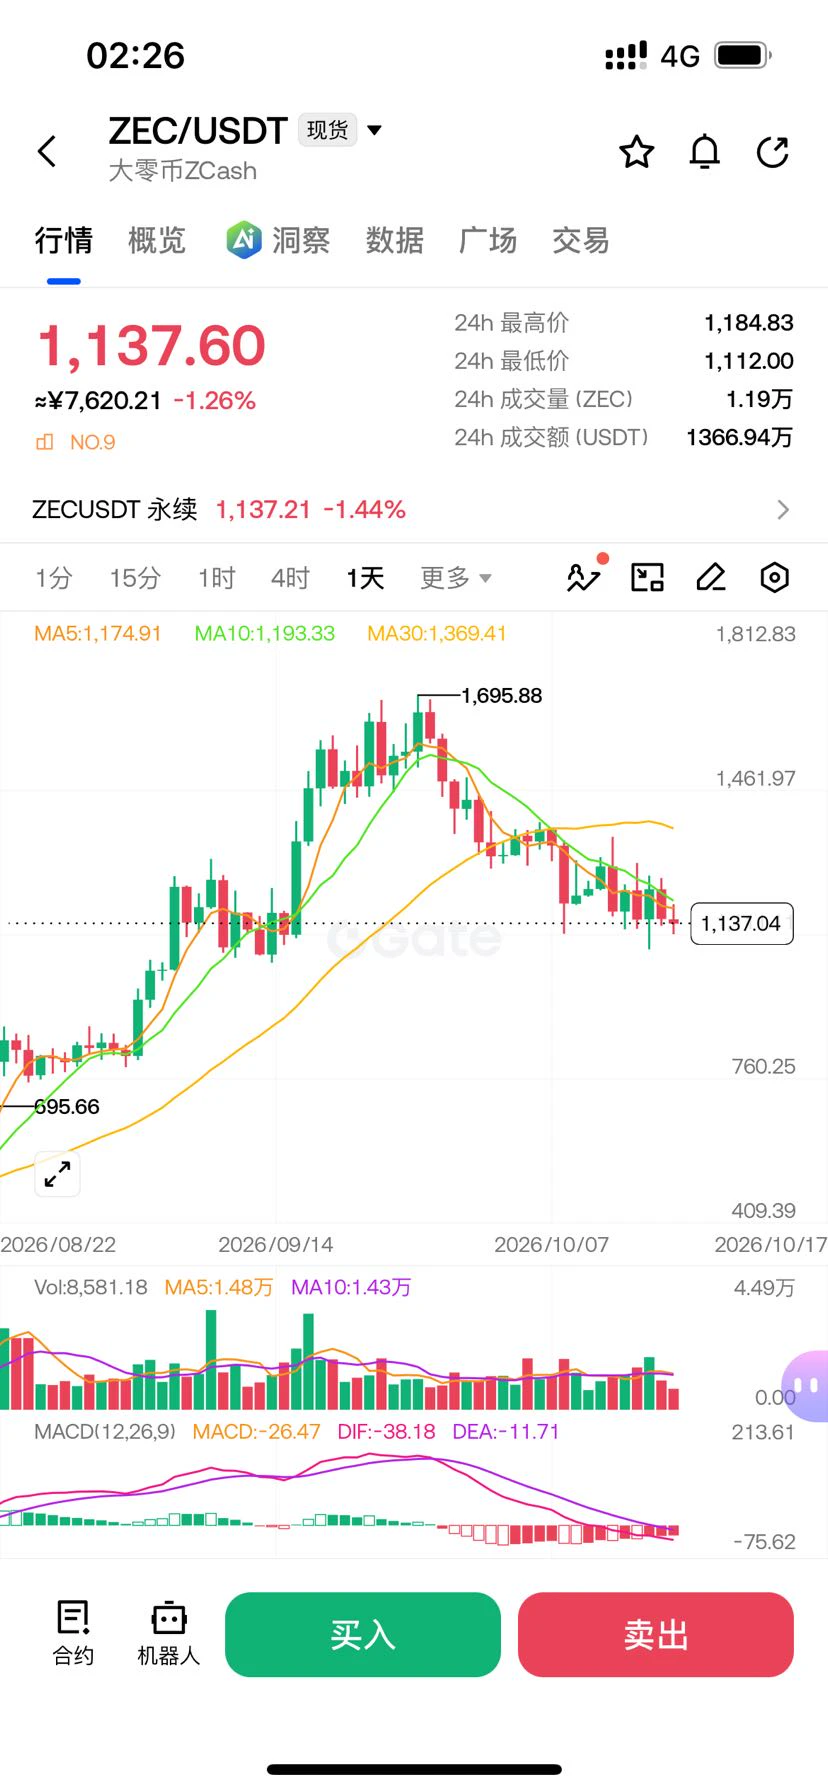
Not necessarily. The key is whether the price’s position relative to the moving averages is synchronized with momentum. Take $ZEC as an example: the current price is 1235.97, with MA5=1225.24 above MA20=1138.62, forming a standard bullish alignment and indicating a healthy trend direction; however, RSI has reached 70.2, nearing overbought territory, while the price is hugging the Bollinger upper band at 1248.36, making the risk-reward of chasing short-term highs unattractive. A reusable approach is: use movin
post-image
ZEC+6.15%
XPL+10.09%
INJ+9.18%
Northern Expedition? Many people are waiting for Bitcoin at 60K? Sorry, Bitcoin is up again, just reaching a high of 82636 🎉up 3.62%, completing TP1.
Gold is the same, reaching a high of 4175 tonight. Up 2.3%, completing TP1.
Both of these two trades were publicly called out during last night's livestream! Recently, all five livestream calls have paid off! If you have questions, watch the replays at your own pace!
Last night I also told everyone about silver, which has hit TP1 as well. During the day yesterday, I also told everyone about Korean stocks, which also paid off.
So much happiness.
BTC+0.61%
  • 1
$IREN
Not looking good for IREN, as the bulls are almost losing the demand zone at $30.19-$32.74 per share.
I am looking at two levels
1. The $25.01/share level
and
2. Bullish OB of $15.86-$18.91 per share, where I will be loading all my ammo should we approach this
#NFA
post-image
IREN-0.55%
We are doing something really special On AlphaX! *
(We'll I had some really nice days on KCEX too)*
Make sure you join me on AlphaX.
Copy Trading Is Coming 👀
MY Official Link! ✅️
post-image
Load More

Join 40 M users in our growing community

⚡️ Join 40 M users in the crypto craze discussion

💬 Engage with your favorite top creators

👍 See what interests you

Trending Topics

USSeptemberPPIBeatsExpectations

91.35k Views1.87k Discussing

US September PPI came in at 6.3% YoY, well above the 5.3% market expectation, pointing to renewed producer-side inflation pressure. Weekly jobless claims were 199K, broadly in line with forecasts. Could hotter inflation further reduce room for rate cuts, and what does it mean for $BTC, US stocks, and gold?

DrLinHanSpeaksAtOxfordUnion

135.63k Views1.86k Discussing

JapanAndKoreaStocksPlunge

47.27k Views1.76k Discussing

View More