Share your thoughts
placeholder
Article
$MET Signal】Long | Buy the 1H pullback, target the 4H upper band
$MET 4H Bollinger upper band resistance at 0.2738, 1H RSI 65.20, order book depth imbalance -8.32%.
Current price 0.2687 is near-term support, 4H MACD red bars narrowing, 1H MACD also contracting. Bid/Ask 0.85, with sell orders slightly heavier. The risk/reward for this pending order is acceptable, but there is limited room to chase at the current price.
🎯Direction: Long
⚡Entry/Pending order: 0.267894 - 0.268700
🛑Stop-loss: 0.266013
🚀Target 1: 0.272730
🚀Target 2: 0.274746
🛡️Trade management:
- Execution strategy: After reac
post-image
MET+26.59%
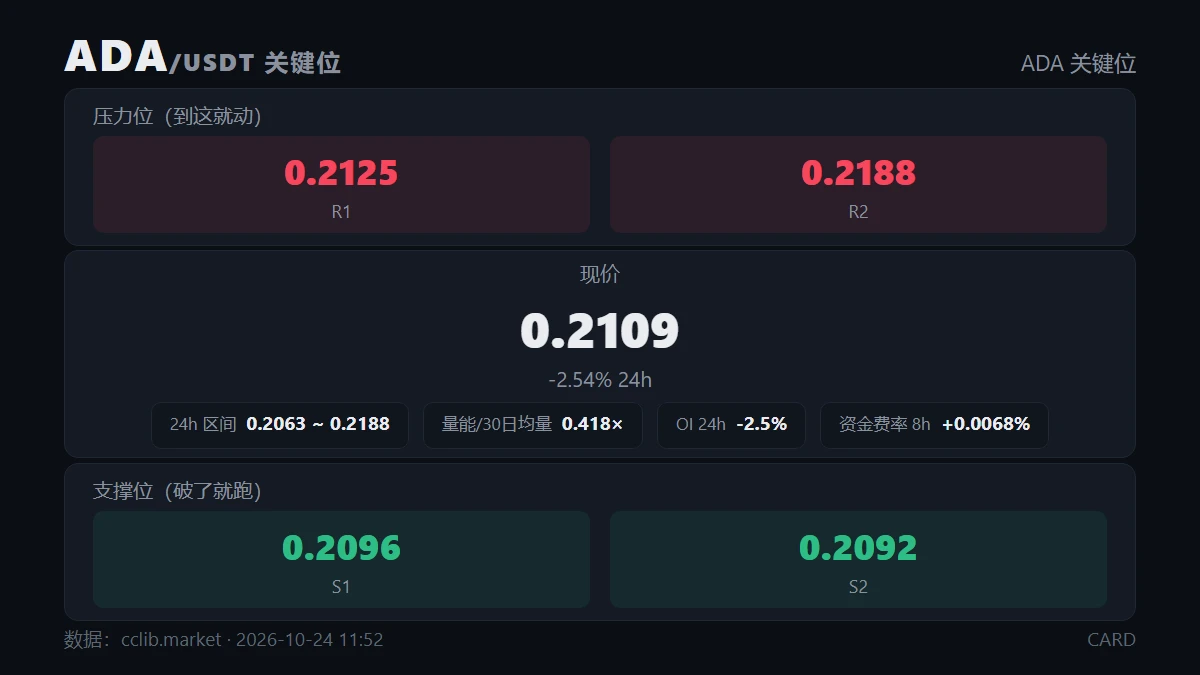
Why is everyone suddenly looking to sell $ADA /USDT right now?

$ADA /USDT - SHORT

Trade Plan:
Entry: 0.2057 – 0.2075
SL: 0.2156
TP1: 0.1998
TP2: 0.1953
TP3: 0.1885

Why this setup?
Why now? The 4h trend is range-bound and the 1h RSI sits at 45.83, suggesting the bounce is fading just as the 1h ATR of 0.003765 shows volatility compressing. The entry zone between 0.2057 and 0.2075 aligns with the current 1h price of 0.2066, giving a clean short setup with defined targets at 0.1998 and 0.1953. The 1D range means the move is not yet confirmed as a breakdown, so the invalidation level of 0.215
ADA-0.91%
A few days ago, I was still calculating whether I had enough money for instant noodles this month; this morning, I was already wondering whether to add sausage. When $HOME plunged intraday, the rebound was weak and smelled strongly of a bull trap. No one was willing to take it higher, so I directly called for shorting at the highs.

From 0.00677 to 0.00549, the unrealized profit on the short position reached +187.52%. The return has me feeling rather uneasy—I’m worried the market will catch on tomorrow and blacklist me. The timing was spot-on.

Close 80% of the position first, and protect th
post-image
HOME+1.66%
ZEC+5.01%
BNB+1.73%
[$Lobster Signal] Long + 4H high-level turnover on volume expansion
$Lobster high-level turnover, depth ratio 1.37, current price 0.050507. Sideways movement after a 4H huge-volume long bullish candle, with thick buy orders. The 4H MACD histogram turned positive, with a bullish cross below the zero line; RSI 48.92, momentum not overheated. EMA20 at 0.0488 provides support, while EMA50 at 0.0571 creates resistance. Funding rate 0.0394%, OI stable. Enter long in the current price range, risk-reward ratio 1.5, stop-loss distance relatively wide, reduce position size.
🎯Direction: Long
⚡Entry/limi
post-image
龙虾+70.35%
BTC+0.20%
ETH+3.21%
SOL+2.86%
#ShareWeekly
ETH/USDT Weekend Outlook and Macro Recap
Current Price: $2,540.65 (+3.13%)
We are heading into the weekend, and the market has just digested critical macro data. Here is the updated landscape and how to approach it.
What Just Happened
The recent PPI print came in hotter than expected on the headline number, while Core PPI was slightly cooler. CPI was mostly in line, though core inflation remains sticky. Because of this mixed but generally firm inflation data, the market is now pricing in roughly an 88% chance of a Fed rate hike at the upcoming September 15-16 meeting.
The immedia
ETH+3.21%
  • 4
Which #Memecoin Will Dominat in 2026 🤔💯
$PENGU

$WKC
$DOG
$PONKE
$BARSIK
$TROLL
What I'm Missing ?
post-image
MEME+1.82%
PENGU-2.55%
WKC-6.06%
PONKE+6.83%
BARSIK+2.40%
Everyone watching the daily trend bullish, but SYMBOL is screaming something else right now.

$BTC /USDT - LONG

Trade Plan:
Entry: 77143.14 – 77474.72
SL: 75717.33
TP1: 78502.63
TP2: 79298.43
TP3: 80492.13

Why this setup?
Why now? The daily trend is firmly bullish, yet the 1h ATR of 663.165879 shows explosive volatility that can swallow a weak long instantly. The 15m RSI sitting at 46.89 means SYMBOL is neutral-to-slightly-bearish on the micro timeframe, creating a pullback entry zone around 77308.93. This is not a random dip; it is a calculated retracement within a 95% confidence LONG se
BTC+0.22%
Nobody is talking about this hidden XRP weakness yet.

$XRP /USDT - SHORT

Trade Plan:
Entry: 1.3605 – 1.3701
SL: 1.4117
TP1: 1.3305
TP2: 1.3074
TP3: 1.2726

Why this setup?
Why now? The 1h price is pinned at 1.3653 inside a tight range, the 15m RSI sits at 50.3 showing no momentum, and the 1h ATR of 0.019313 confirms compression before a move. This sets up a SHORT entry between 1.3605 and 1.3701 with TP1 at 1.3305 and TP2 at 1.3074, while the daily range bias keeps sellers in control. The invalidation level of 1.4029 is the hard line that would wipe the trade out.

Debate:
Are we hitting
XRP+0.78%
Treasury Yields Approach Key Levels, Could Higher Borrowing Costs Affect Crypto Recovery?
live-cover
LIVE668
Wait to you realize you don’t need to call something every day
Bring back quality > quantity
I promise you can build something , bagwork , and still make good
Gonna pick a winner from pump followers let’s go
post-image
PUMP-6.09%
$BTW surged during the day, but I didn’t chase it because a long-term trendline was positioned directly overhead, making it difficult to place a stop-loss after entering. I waited for it to pull back and regain stability before entering a long position in line with the lower-timeframe structure.
After entering, it consolidated for a short while. I didn’t rush to trade back and forth. Once the price moved a certain distance away from my entry, I first closed 80% to lock in profits on the core position, leaving the remaining 20% to follow the trend.
After the breakout candle appeared, I first to
post-image
BTW+0.85%
DOGE+0.57%
ETH+3.23%
today live markets informations
live-cover
LIVE378
$IOST dropped from 0.0011 to 0.0009, and the little profit in my account evaporated by 40% in three days. Honestly, this feeling is all too familiar—the same “it won’t fall much further” illusion buried me last year.
But today I’m not talking about emotions, only the data. A 24h trading volume of 159.9M is unusual for an old coin whose market cap ranking has fallen outside the top 200. A normal gradual decline wouldn’t bring such heavy turnover, which means someone is buying—and buying aggressively. The 0.0009 level happens to be the neckline of the rally that started last November. Breaking
IOST-13.05%
Odds of rate hikes sit at 86%
September 16 is the most important day of the month.
The Fed is likely to make the first interest rate hike in the last 3 years.
Expect a volatile week ahead
post-image
The old meme coin that crashed into penny-stock territory came back to life overnight: DOGS surges 18.09% on heavy volume
Well, the old meme coin that crashed into penny-stock territory has come back to life—$DOGS is now at 0.00005365, down 96.71% from its all-time high, and up 18.09% over 24h. I’m bullish but won’t chase; I’ll buy the dip.

Let volume speak first—24h trading volume is 4.15M USDT, with a volume ratio of 3.72; a 15m candle at 01:30 tested 0.00005505.

Derivatives—OI is up 9.11% versus last night’s snapshot, the long-short ratio is 1.586 (61.33% long), and the -0.00064571 fund
DOGS+13.37%
Everyone's hunting upside on SYMBOL but the smart money is fading this level.

$SAMSUNG /USDT - SHORT

Trade Plan:
Entry: 194.74 – 195.68
SL: 199.68
TP1: 191.86
TP2: 189.62
TP3: 186.27

Why this setup?


Debate:
Are we getting a clean slide to TP2 or will bulls defend this zone?

⚠️ Personal market analysis only. NFA — manage risk and DYOR.
Educational content, not investment advice or a recommendation to buy, sell, deposit, or withdraw any asset. No paid promotion or referral/affiliate links.
SAMSUNG+2.97%
Everyone is sleeping on this 95% short signal for XAUT while the daily trend screams bearish.

$XAUT /USDT - SHORT

Trade Plan:
Entry: 4346.1 – 4356.1
SL: 4399.2
TP1: 4315.0
TP2: 4290.9
TP3: 4254.9

Why this setup?


Debate:
Are we hitting TP2 at 4290.9 or getting trapped above 4411.5?

⚠️ Personal market analysis only. NFA — manage risk and DYOR.
Educational content, not investment advice or a recommendation to buy, sell, deposit, or withdraw any asset. No paid promotion or referral/affiliate links.
XAUT+0.49%
$ETH SHORT TRY
TP:1982,74
SL: 27676,19
post-image
ETH+3.23%
I switched to the background to reply to a message, and when I came back, it had already finished the job.
A few days ago that afternoon, when $JCT was pushed upward, the volume couldn’t keep up and the resistance above was extremely heavy. I put it directly: don’t chase it—there’s no one to take it higher.
From 0.002429 all the way down to 0.001495, floating profit reached +943.92%. Those who were on board should have woken up laughing.
Take 80% off first, protect the remaining 20% at cost, and let profits run as it continues downward. If it rebounds, don’t give the profits back.
Panic comes
post-image
JCT+5.66%
ETH+3.23%
SOL+2.89%
I just hit refresh, and it suddenly plunged, as if I had scared it.

When I checked the chart after lunch, $CYS ’s rebound was clearly weak, and the volume never followed through. Despite being bullish, I went short with the trend at 1.3889. It’s now at 0.1295, with +1785.25% secured. The timing was right, so take profits when it’s time—close 80% first, and protect the remaining 20% at breakeven.

Even if you only make one point, as long as you can take it with you, it’s yours; however much unrealized profit there is belongs to the market.

Don’t lose your patience grinding through a range,
post-image
CYS-5.31%
BTC+0.22%
XRP+0.78%
Load More

Join 40 M users in our growing community

⚡️ Join 40 M users in the crypto craze discussion

💬 Engage with your favorite top creators

👍 See what interests you

View More