Share your thoughts
placeholder
Article
What a stressful day it has been for me.
Just spent over 24 hours on traffic. Started my travel by 6pm last night and I'm just getting to my destination 😭💔
post-image
Liquidation at its peak 🥺😂
post-image
This $ENA long position has really tested my patience. After entering around 0.15082, it kept grinding sideways. Several pullbacks in between swept the stop-losses of quite a few people, but I knew that as long as the bull-bear dividing level held, the consolidation was within the normal range. The price just surged to 0.16741, with unrealized profit reaching around +529.79%. I reduced the position by 70% as planned, and moved the protection level directly higher on the remaining 30%, so even a pullback from here won't affect my principal.

The most important thing in holding this position wa
post-image
ENA+4.80%
LAB+2.03%
DOGE+6.96%
Everyone’s staring at LTC’s range—but the 77% short signal says the exit door is already open.

LTC/USDT - SHORT

Trade Plan:
Entry: 53.89 – 54.17
SL: 55.80
TP1: 52.70
TP2: 51.82
TP3: 50.49

Why this setup?
- Price is pinned at 54.03 while 4h momentum rolls over; RSI 15m at 47 shows no buying spark.
- ATR 1h (0.57) is tight—this coil snaps fast, and TP1 at 52.70 is only 2.5% away.
- 1D trend is *range*, not bull—so this isn’t a dip-buy, it’s a mean-reversion gift.
- Why now? Entry zone 53.89–54.17 is the last polite area before the slide to 51.82.

Debate:
If LTC breaks 53.80, do you
LTC+7.74%
Everyone’s watching 54.17 on $LTC /USDT—but the real trap is what happens below 52.79.

$LTC /USDT - SHORT

Trade Plan:
Entry: 54.02 – 54.32
SL: 56.01
TP1: 52.79
TP2: 51.87
TP3: 50.49

Why this setup?
- 1D trend is *range*, yet 4h momentum is screaming SHORT with 77% confidence.
- RSI on 15m sits at 50.5—no bounce fuel left; price is stalling right under resistance.
- ATR (0.59) shows low volatility—perfect setup for a slow bleed to TP1 (52.79) before a quick flush to TP2 (51.87).
- Why now? Entry zone 54.02–54.32 is a magnet for late longs, but invalidation at 51.03 is far—room to ru
LTC+7.69%
How much capital does it take to push a coin to $1 billion? Today’s top whale tells us that it only takes less than $9 million
And if a certain player wanted to cash out $1 million now, the market cap would instantly drop to $800 million,
For many top holders, one person’s holdings alone could crash the entire market to zero at the current coin price
Why do people say crypto is a casino? Because in the end, only a very small number of people are often able to walk away from the table with money
post-image
I wasn’t even expecting to break even, but it took me straight into profit. This service really delivered. $TAO While everyone was still watching from the sidelines, I kept my eye on that range of repeated intraday fluctuations, and the more it consolidated, the more I felt something was brewing.
Buying pressure was quietly strengthening, with buyers stepping in every time it dipped. With this kind of bottom structure, I had to give it a shot. I opened a long at 225.0. The position wasn’t smooth sailing, but I held on as long as the trend remained intact.
Now 233.2 has been reached, and the +1
post-image
TAO+5.56%
ADA+3.98%
ETH+1.23%
BTC MARKET UPDATES
live-cover
LIVE81
Everyone’s staring at BNB’s 771.6—but the real trap is 788.7, not the floor.

$BNB /USDT - SHORT

Trade Plan:
Entry: 769.8 – 773.4
SL: 788.7
TP1: 758.8
TP2: 750.3
TP3: 737.5

Why this setup?
- 4h bias is SHORT with 55.4 confidence, yet 1D trend is *range*—so this isn’t a breakout, it’s a fade.
- RSI 15m at 49.58 = zero momentum; price is coiling inside a 769.8–773.4 pocket.
- Why now? ATR 1h (7.1) is shrinking—volatility compression precedes a 2–3% expansion. Targets 758.8 (TP1) then 750.3 (TP2) are the path of least resistance if 771.6 breaks down.
- Invalidation is clean: 714.6. Ris
BNB+7.26%
( new streamer) market overview
live-cover
LIVE338
【$BULL Signal】Long|1H middle-band convergence, high funding-rate pressure
$BULL 1H is converging along the middle band, with RSI at 71.54 on 4H and 69.02 on 1H; MACD histogram bars are shortening on both timeframes. Volume plunged from 1.5B to 0.07B, showing a break in buying momentum. The funding rate is 0.1175%, indicating high leverage costs. Order book depth imbalance is -0.51%, with bids and asks nearly balanced.
🎯Direction: Long
⚡Entry/limit order: 0.08422457 - 0.08447800
🛑Stop-loss: 0.08363322
🚀Target 1: 0.08574517
🚀Target 2: 0.08637876
🛡️Trade management:
- Execution strategy: Aft
post-image
BTC+0.17%
ETH+1.23%
SOL+1.68%
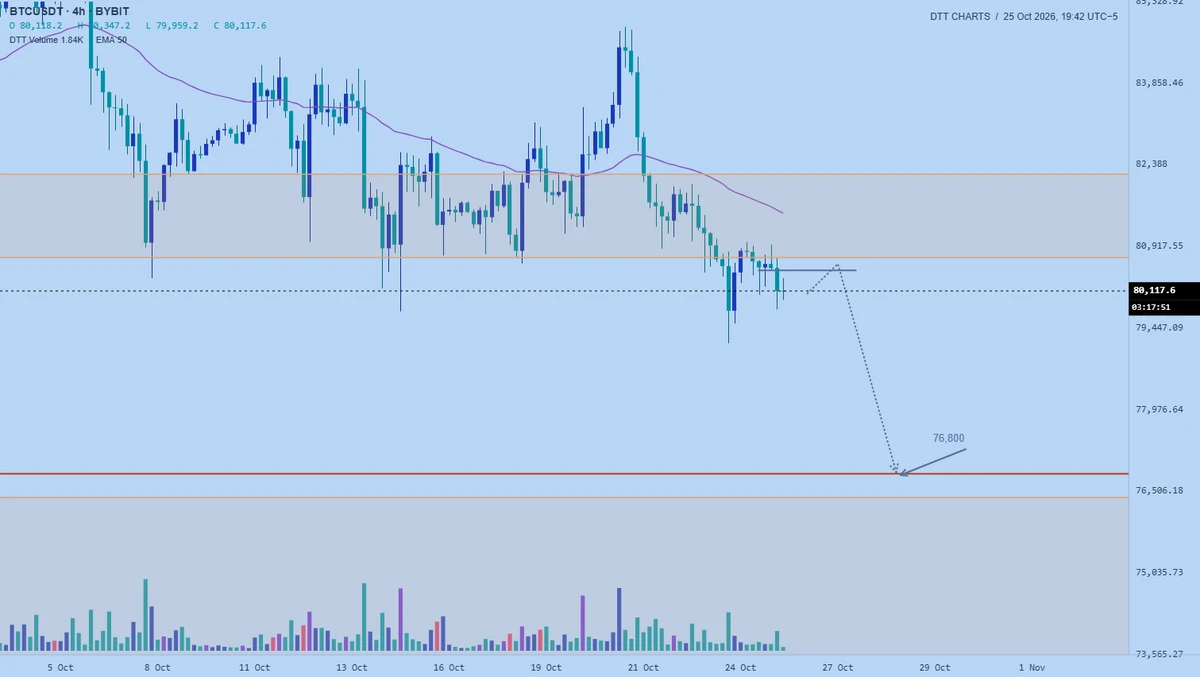
$BTC Signal】1H volume contraction and pullback, funds defending the mid-band, buy-the-dip positioning
$BTC 1H volume on a single candle was 360.083 BTC, down approximately 94% from the previous round's 5951.489. The Bollinger Bands narrowed to 79347.938-79992.082, with the price fluctuating within the range. The 4H MACD histogram at -73.851 continued to decline, while the price held the 4H mid-band at 79576.620, indicating that buyers below have not retreated. The 1H MACD histogram was positive at 38.082, but not strong enough to drive a breakout. The order book Bid/Ask Ratio was 1.00, and th
post-image
BTC+0.17%
#RedBullTradingTourSeason6
Red Bull Trading Tour Season 6 is currently gaining attention among crypto traders as Gate’s latest trading campaign combines cryptocurrency competition with the speed and excitement of Formula 1. The Season 6 competition is scheduled to run from August 31 to September 28, 2026, giving participants several weeks to compete for rewards.
The campaign features a dynamic prize pool that can reach 60,000 GT, depending on overall trading volume. Traders can participate through several products, including futures, spot trading, options, leveraged ETF tokens and Convert. Mu
GT+10.96%
ORCL+3.07%
I don’t chase after a volume-backed surge; that’s a rule I set for myself. When $ETH surged to 2485.57, volume did indeed pick up, but such a sudden expansion often means short-term divergence is intensifying, and chasing in makes it easy to get stuck at the top.

I entered my long position earlier, when the price repeatedly tested the key level around 2394.32. The key level held each time, and the rebounds after each pullback kept getting faster. I got the feeling that someone was accumulating at lower levels, so I followed and went long.

After the move played out, I still took profit on
post-image
ETH+1.23%
ZEC-0.66%
ADA+3.98%
$TUT Signal】Long + negative funding rate short-squeeze buying dominates
$TUT Depth ratio 1.22, bid depth exceeds ask depth by 20%, and the 4H MACD histogram at 0.0010 remains above the zero line. The funding rate is -0.0172%, with shorts continuing to pay. The 1H RSI is 58.92 and the 4H RSI is 53.93, not yet in an extreme zone. The current price of 0.02808 is near the upper bound of the entry range, while the stop loss at 0.0277992 is about 1% away below, and intraday volatility is sufficient to trigger an exit.
🎯Direction: Long
⚡Entry/orders: 0.0279958 - 0.0280800
🛑Stop loss: 0.0277992
🚀T
post-image
TUT+25.17%
BTC+0.17%
ETH+1.23%
SOL+1.68%
Everyone’s staring at gold, but $XAG /USDT just flashed a quiet 4h sell signal that nobody’s tweeting about.

$XAG /USDT - SHORT

Trade Plan:
Entry: 66.29 – 66.35
SL: 66.60
TP1: 66.11
TP2: 65.97
TP3: 65.77

Why this setup?
Why now? The 1D trend is sideways, but the 4h timeframe is whispering SHORT with 55% conviction—not a scream, just a nudge.
- Entry sits at 66.32, with immediate downside targets at 66.11 and 65.97.
- RSI on the 15m is cooling at 59.17, losing bullish steam.
- ATR (1h) at 0.115 shows the squeeze is tight—breakouts here are fast, not lazy.
The range-bound daily act
XAG-0.08%
【$1000CAT Signal】Go long on pullback support
$1000CAT Pullback support, buying volume near 0.00255 is 1.58 times selling volume. 4H MACD bullish momentum is contracting, the 1H histogram has returned to zero, and 1H RSI is 61.84. The current quote is 0.002558, right within the recommended range.
🎯Direction: Go long
⚡Entry/Limit order: 0.00255033 - 0.00255800
🛑Stop-loss: 0.00253242
🚀Target 1: 0.00259637
🚀Target 2: 0.00261555
🛡️Trade management:
- Execution strategy: After reaching Target 1, reduce the position by 50% and move the stop-loss up to the breakeven level. If the price falls back
post-image
BTC+0.17%
ETH+1.23%
SOL+1.68%
This move in $SKHYNIX has been steadier than I expected. When the overnight session pulled back to around 1165.42, it did not break through the key level I was watching, so I chose to open a long position, with a stop-loss that was not set too tight. In futures, the biggest fear is that the direction has not changed but you get stopped out first, so I was fairly patient with that trade.

After it rallied into the 1277.62 range, I first closed 70% of the position and locked in the floating profit; for the remaining 30%, I moved the protection level higher—exit if it breaks down, and keep watch
post-image
SKHYNIX+0.23%
SNDK+1.73%
DOGE+6.96%
This was purely the market being in a good mood and casually scattering some gold coins, with one happening to land right on my head. During the repeated intraday swings, $XRP fell just short every time it pushed higher. The candlesticks looked limp, but when I looked at the trading volume, buying pressure had actually been quietly strengthening all along. When everyone was afraid to move, I instead felt it was time to act.

The long position signaled at 1.3845 is now at 1.4149, +204.92%. Feeling good, brothers. This kind of bottoming structure tests your patience the most, but as long as you
post-image
XRP+1.27%
BTC+0.17%
ZEC-0.66%
$AKE Hold forever; 1,000x is the goal.
AKE+42.64%
Load More

Join 40 M users in our growing community

⚡️ Join 40 M users in the crypto craze discussion

💬 Engage with your favorite top creators

👍 See what interests you

View More