Share your thoughts
placeholder
Article
This long position was not opened by forcefully chasing the breakout at the moment it occurred; instead, I waited for the price to pull back to the upper boundary of the previous range and entered only after confirming the strength of the support. As the price approached the upper target zone, I began taking profits in batches as planned, closing out 70% of the position first, while raising the protective stop for the remaining 30% to above the entry price, so that even an intraday wick would not turn a profitable trade into a losing one. The moving averages continue to fan upward, key levels
post-image
BULLA-9.43%
ETH+1.38%
SNDK+0.77%
My hand trembled slightly when I set the stop-loss a few days ago, only to find this morning that it was unnecessary filial piety. The last thing I saw before bed was $HYPE stabilizing around 83.949 after a pullback, with buying pressure clearly strengthening. I immediately told everyone this level had potential. Looking again today, 87.898 has already played out, delivering a +333.59% return. Those who got on board must have woken up smiling, right? The sleepless nights weren’t in vain—we got the rhythm right. Don’t hesitate to lock in profits: take 80% off first, move the protection level fo
post-image
HYPE+2.82%
BNB-1.87%
SOL+3.18%
$ETH Signal】Long sniper entry + 1H pullback limit order
$ETH Order book buy/sell ratio 1.93, with buyers dominant; substantial orders are placed at 2495-2498. 1H RSI is 57.6, the MACD histogram is contracting, and the price remains above EMA20. The 4H Bollinger Band middle line is at 2480, with EMA20/50 arranged upward.
🎯Direction: Long
⚡Entry/Limit order: 2490.3166 - 2497.8100
🛑Stop-loss: 2458.3718
🚀Target 1: 2556.9672
🚀Target 2: 2586.5458
🛡️Trade management:
- After reaching Target 1, reduce the position by 50% and move the stop-loss up to the breakeven level. If the price falls back t
post-image
ETH+1.38%
BTC+0.68%
SOL+3.20%
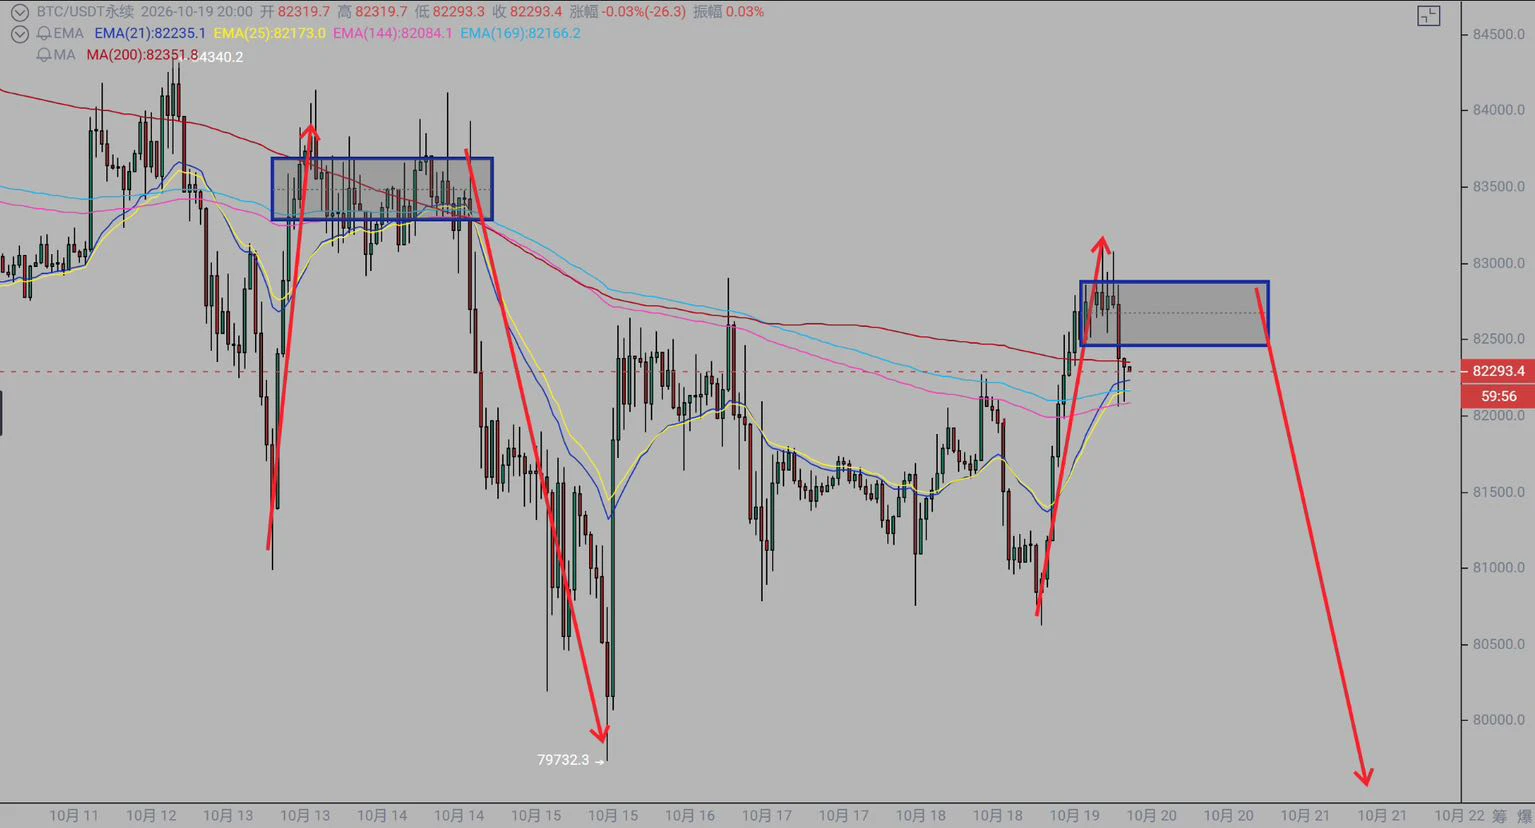
The week is coming to an end. The market first moved down and then up, pulled back again on Friday due to fundamental factors, and then slowly climbed higher. Overall, it remained in a wide-ranging consolidation. A total of 13,140 points were captured this week, marking another consecutive account doubling. Although the movement this weekend was much slower than on previous weekends and the volatility was also relatively low, range trading, shorting the highs, and longing the lows still brought in some gains. Now we will see how the new week unfolds. Going for another 30-win streak.
From the
post-image
BTC+0.68%
ETH+1.36%
The direction was right; the only question left was whether I could hold on. The $BNB rally I caught took roughly two or three false breakouts from structural confirmation to a decisive breakout on volume before it truly held above the level. The floating profit retraced for a while after entry, but once that bullish candle appeared, I knew the buyers had the upper hand.

Technically, I prioritize the coordination between price and volume. The breakout candle had sufficient volume, and the pullback did not erase the gains, which is a relatively healthy sign. The price repeatedly tested the 75
post-image
BNB-1.87%
XRP+0.64%
ZEC+19.75%
✨A 5-year fishing ban on the Yangtze River reveals a simple truth:
When fewer people fish, more fish are naturally born!
The Yangtze River's 10-year fishing ban has only been in place for five years. Schools of fish now appear across the river, Yangtze finless porpoises are frequently spotted, and there are more fish than anyone can count.
There is no complicated magic. Humans are simply taking and fishing less, giving nature room to rest and recover. All living things have their own power to reproduce.
Many things cannot be rushed. By easing excessive demands, reducing the exhaustion of the r
Everyone’s staring at $ETH /USDT’s range—but the 4h clock just started ticking for the quiet exit.

$ETH /USDT - SHORT

Trade Plan:
Entry: 2492.99 – 2499.19
SL: 2525.89
TP1: 2473.74
TP2: 2458.85
TP3: 2436.50

Why this setup?
Why now? The 1D says “range,” but the 4h frame is whispering SHORT with 55% conviction. Price is parked at 2496, right on the entry ref. ATR (12.41) is thin—volatility is coiled. RSI 15m at 51.7 shows zero momentum, meaning longs aren’t committed. The path of least resistance is down to TP1 (2473) then TP2 (2458), unless we invalidate above 2470.67—wait, that’s the inva
ETH+1.38%
Financial News, Crypto Updates, Real-World Strategies
live-cover
LIVE1,442
Most traders think ARB is dead—that’s exactly why this range is about to break.

$ARB /USDT - SHORT

Trade Plan:
Entry: 0.18821 – 0.19175
SL: 0.20696
TP1: 0.17725
TP2: 0.16876
TP3: 0.15603

Why this setup?
The 4h chart says SHORT with 55% confidence, but the 1D trend is flat—meaning no one’s paying attention. RSI on 15m is 57.6 (not overheated), and ATR is tight at 0.007. That’s a coiled spring. The entry zone (0.188–0.192) sits right under resistance. Why now? Because low volatility after a range always precedes a violent move—and the data points to downside targets at 0.177, then 0.168.
ARB+6.65%
It’s Monday!
We have to keep pushing every day, my blue-check friends
Stay committed to mutual help and trust
Teachers, let’s get moving
#蓝V互关 # to connect with blue-check friends
post-image
How to identify hundredfold- and thousandfold-return assets in a bull market
1. Choose the right track, with a high enough ceiling, great potential, and ample room for growth;
2. This year’s hot spots are the BTC ecosystem, ETH ecosystem, and SOL ecosystem;
3. Hundredfold-, thousandfold-, and ten-thousandfold-return assets have emerged in the BTC ecosystem, with clear profit-making opportunities;
4. The ETH and BSC ecosystems have performed fairly average, with no dark horses emerging for now and no clear profit-making opportunities so far;
5. Many coins in the SOL ecosystem have surged this y
post-image
BTC+0.68%
ETH+1.36%
SOL+3.20%
CORE+0.70%
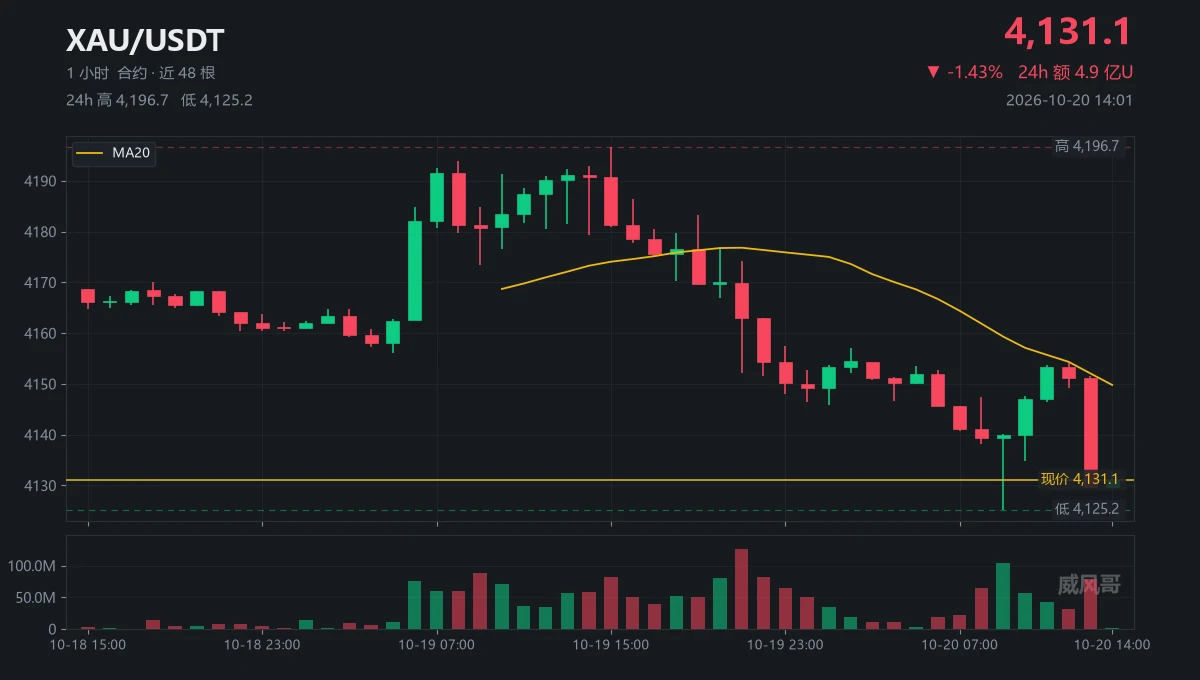
9.7 Monday Gold Outlook
On Monday, there is basically unlikely to be a one-sided major move in the short term; overall, the market is expected to focus mainly on range-bound correction.
4-hour chart:
After the pullback, price has returned to trade near the middle Bollinger Band, while the Bollinger Bands have narrowed somewhat; the EMA7 and EMA30 moving averages are intertwined and converging, with no clear one-sided direction, as bulls and bears enter a tug-of-war.
The SKDJ indicator is moving upward after a low-level golden cross and is currently in the neutral zone, with no clear overbought
post-image
XAU-0.21%
$PEPE Attempting Breakout! 👀
post-image
PEPE+1.07%
I didn’t chase $LIT when it surged during the day, as a long-term trendline was directly overhead and it would have been difficult to place a stop-loss after entering. I waited for it to pull back and regain stability before entering a long position based on the lower-timeframe structure.

After entering, it consolidated for a while. I didn’t rush to trade in and out; once the price moved a certain distance away from my entry zone, I first closed 80% to lock in the profit on the core position, leaving the remaining 20% to follow the trend.

After the breakout candlestick appeared, I first to
post-image
LIT-5.26%
SNDK+0.77%
BNB-1.87%
$$COLLECT 24-hour drop of 29%, with trading volume surging to 38.8 million—this script is almost a carbon copy of the big bearish candle on May 19, 2021. The historical pattern is clear: the 6th–8th month after the halving is always a brutal shakeout. October 2020 was like this, and August 2016 was too. Each time, the main uptrend only began 30–60 days after the crash.
The current 0.0405 level happens to be the 0.618 golden retracement level of the previous rally. Yesterday’s sell-off occurred on exceptionally low volume, but trading value continued to expand, indicating that funds were buying
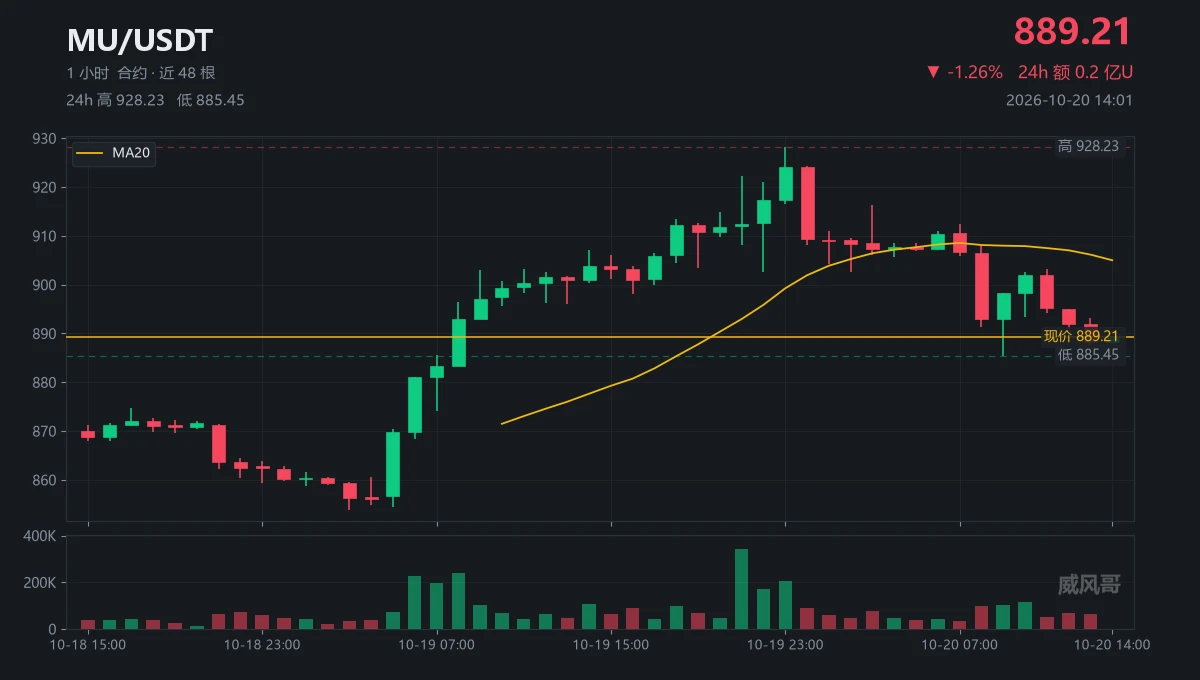
I did nothing—just went to the restroom, and when I came back, the candlestick chart had already done the work for me. A few days ago, I glanced at $SKHYNIX before bed. The price was right around 1202.67; the key level held, the pullback stabilized, and funds were quietly flowing in—not being advertised to you with one huge bullish candle. While everyone else was running, I instead felt it had an opportunity. When I opened the chart today, it had clearly moved above 1283.25, and +476.57% had simply landed in my account. This profit feels great—staying up late was worth it. Take 80% off the tab
post-image
SKHYNIX+0.54%
ZEC+19.75%
SNDK+0.77%
Everyone’s long ZEC while the 4h chart screams distribution—who’s right?

$ZEC /USDT - SHORT

Trade Plan:
Entry: 1215.39 – 1231.17
SL: 1321.75
TP1: 1149.43
TP2: 1100.20
TP3: 1026.35

Why this setup?
- 1D trend is bullish, but the 4h setup says otherwise: SHORT bias at 84 confidence.
- Price is pinned at 1223.28 with RSI(15m) at 52—no momentum, just chop before the drop.
- ATR(1h) of 31.5 means we’re primed for a 2.5%+ move; targets sit at 1149 (TP1) and 1100 (TP2).
- Why now? The “waiting” status means the trap is set—either we sweep 1231 or dump.

Debate:
Are you fading this bullish
ZEC+19.75%
How to screen for hundredfold- and thousandfold-return assets in a bull market
1. Choose the right sector, with a high enough ceiling, great potential, and ample room for growth;
2. This year's hot sectors are the BTC ecosystem, ETH ecosystem, and SOL ecosystem;
3. The BTC ecosystem has produced hundredfold, thousandfold, and even ten-thousandfold assets, with an obvious wealth effect;
4. The ETH and BSC ecosystems have performed averagely, with no dark horses emerging for now and no wealth effect visible at present;
5. The SOL ecosystem has produced many sharply rising coins this year, creati
post-image
BTC+0.68%
ETH+1.36%
SOL+3.20%
CORE+0.70%
Load More

Join 40 M users in our growing community

⚡️ Join 40 M users in the crypto craze discussion

💬 Engage with your favorite top creators

👍 See what interests you

View More