Square
Following
Hot
News
Profile
Share your thoughts
placeholder
Article
Bro, you know what’s the saddest part?
We can’t even see who we’re trading against,
yet we’re willingly giving them 15% of the profits.
post-image
Janus Henderson, a $480 billion asset manager, took a position in Ethena's ENA in June and plans to use staked USDe for cash management. Ethena is integrating Janus Henderson's AAA CLO strategy, JAAA, into USDe's reserves.
@ethena
ENA+5.36%
USDE+0.00%
Trenches
Kimchi
K
bade
b
Kimchi
CSoc...pump
Market Cap
$.
Change
.
24h Vol
$.
Holders
.
Pokémon
P
bade
b
Pokémon
D42T...Xvb1
Market Cap
$.
Change
.
24h Vol
$.
Holders
AGT
A
bade
b
AGT
0x5d...e274
Market Cap
$.
Change
.
24h Vol
$.
Holders
.
Dacity
D
bade
b
Dacity
nxPq...pump
Market Cap
$.
Change
.
24h Vol
$.
Holders
.
STONK
S
bade
b
STONK
6GmA...UNgx
Market Cap
$.
Change
.
24h Vol
$.
Holders
.
$PYTH Look, the analysis from four hours ago hit the third target exactly and dropped from there. 👌
post-image
PYTH+11.14%
Accenture, with $74.18 billion in fiscal 2026 revenue and about 814,000 people, joined the Hedera Council in April. It will help govern the public network and run one of its consensus nodes.
@hedera
HBAR+1.69%
$ETH #btc 4x in seven days, keep it up, keep it up
post-image
ETH+2.47%
🔹U.S. AI Stocks Stage a Strong Comeback! APLD and WDC both surge over 6. Are memory and computing p
live-cover
LIVE1,096
  • 1
SanDisk (SNDK) Long Watch
Direction: Short-term bullish, but don't chase.
SNDK rebounded about 5.53% yesterday, closing at $1,371.12; today it has traded in a range of $1,330–$1,389, most recently around $1,365.
Bullish rationale
● AI inference is driving NAND/SSD demand, and the storage market remains strong.
● A higher share of long-term contracts is improving earnings visibility.
● The stock is recovering from oversold levels in the short term, with sentiment rebounding.
Key levels
● Support: $1,359 / $1,330
● Resistance: $1,389 / $1,404
● A sustained mov
SNDK-0.36%
Today called for a bit of Asian food 😋
post-image
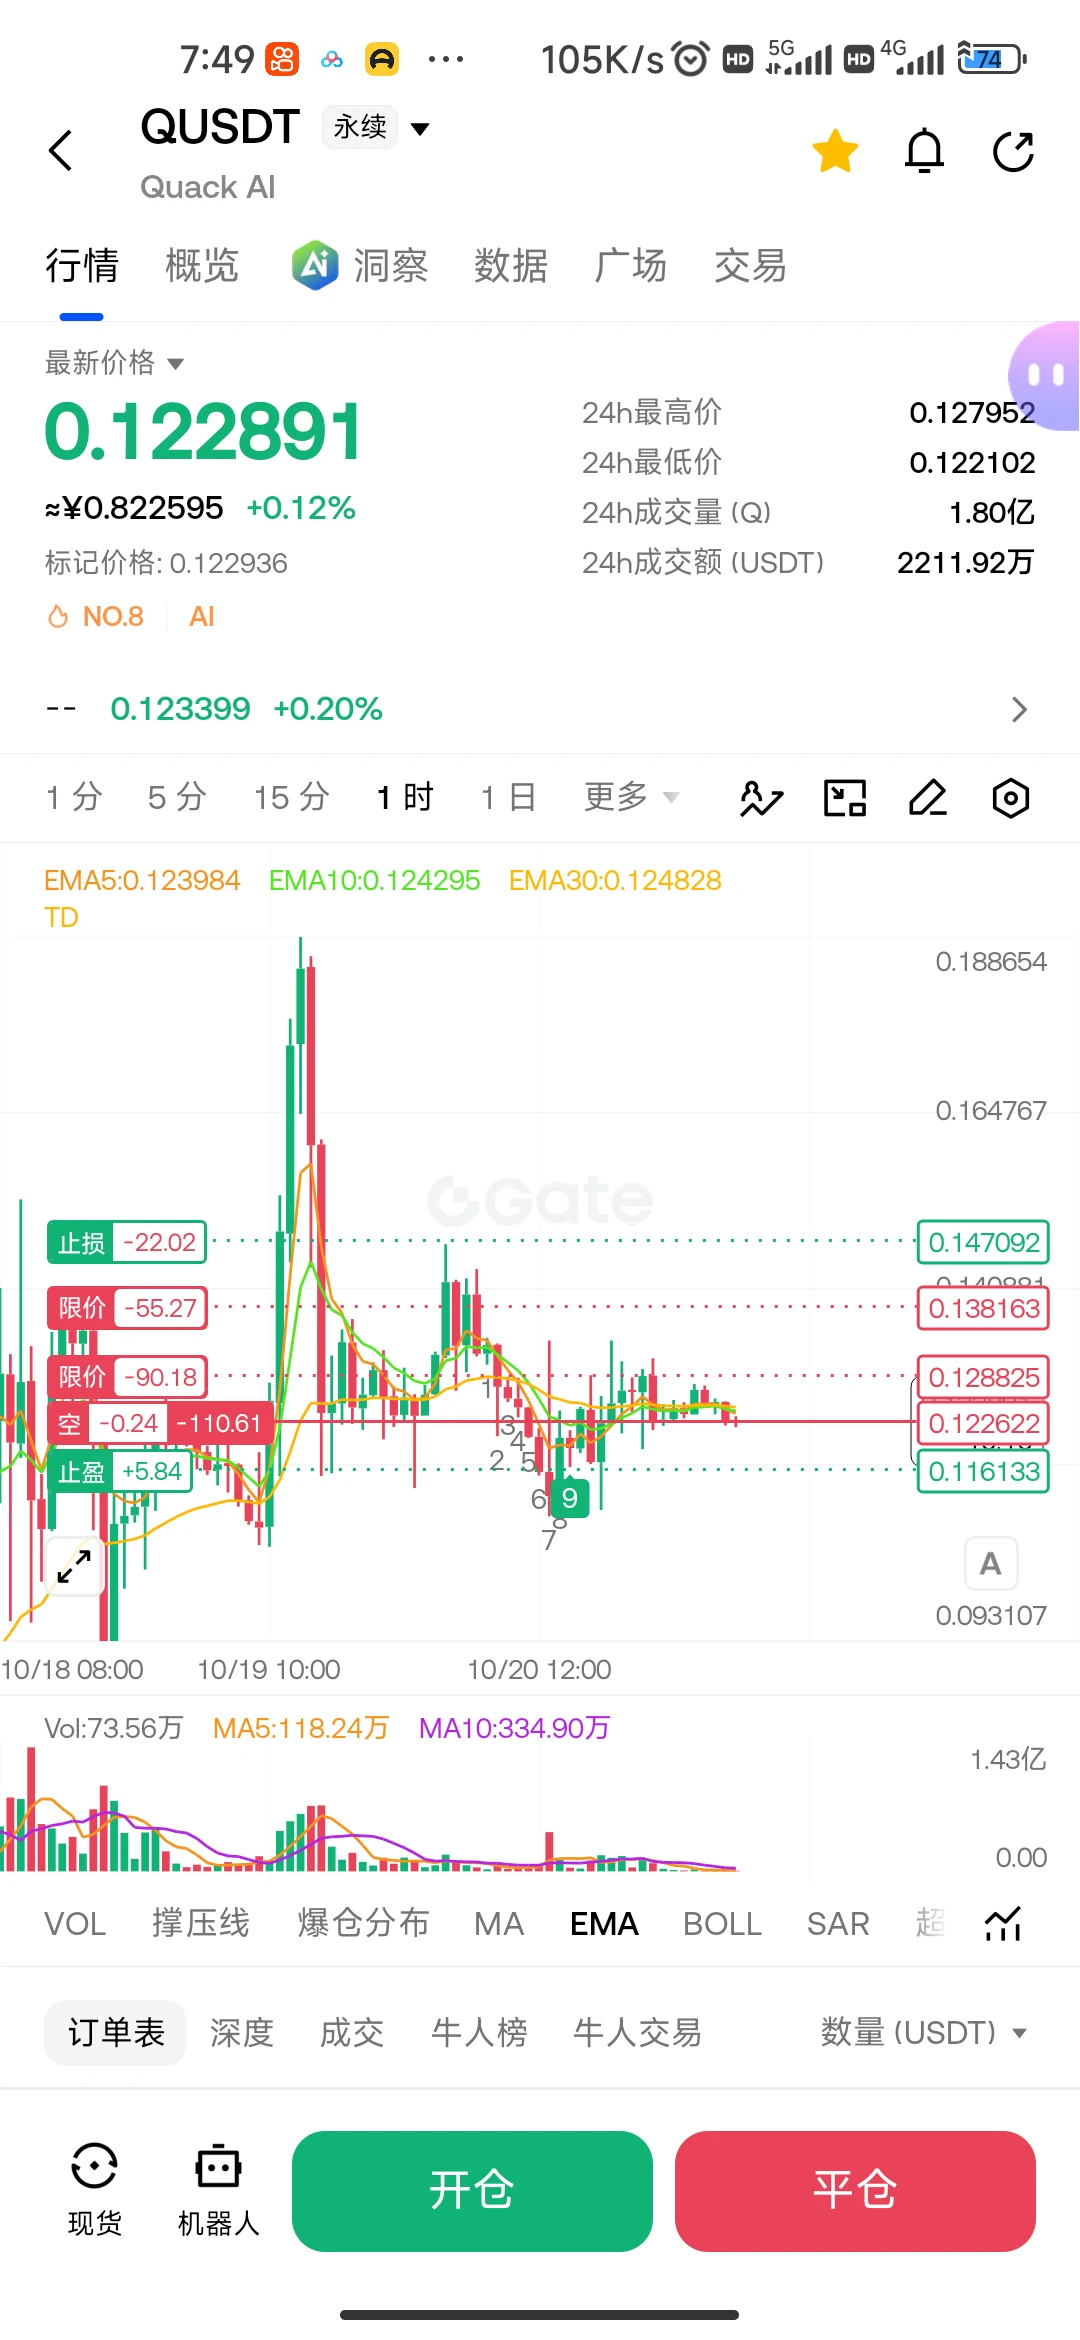
$Q Brother Zhuang, I'm not greedy; just let me make enough for a meal
post-image
Q-3.96%
  • 3
$BTC BTC/USDT 4-hour, 1-hour, 15-minute and 5-minute candlestick charts; the current price is near 83,000 USDT. Overall, the price has broken above the previous downtrend line (see the orange trendline) and is facing short-term resistance near 83,400.
Based on Bollinger Bands (BOLL) and support/resistance levels across different timeframes, here are key reference levels for long positions (buying dips in the direction of the trend) and short positions (selling high to play a pullback):
I. Key Support and Resistance Levels
* Strong resistance (overhead pressure): 83,400 - 83,500 USDT (recent
BTC+1.91%
Layout: Bitcoin, Ethereum, Dogecoin
live-cover
LIVE1,464
  • 1
Sparkappen Launch Bitcoin Trading via DekaBank in Banking App
Deka has listed five participating savings banks on its platform, with more than 230 having expressed interest. Trades on the platform cost €0.99 plus a spread, and withdrawals are limited to approved custodians.
⚠️ Personal market analysis only. NFA — manage risk and DYOR.
Educational content, not investment advice or a recommendation to buy, sell, deposit, or withdraw any asset. No paid promotion or referral/affiliate links.
post-image
BTC+1.91%
Seeing everyone on X enjoying a nice hot breakfast
makes your boy so jealous.
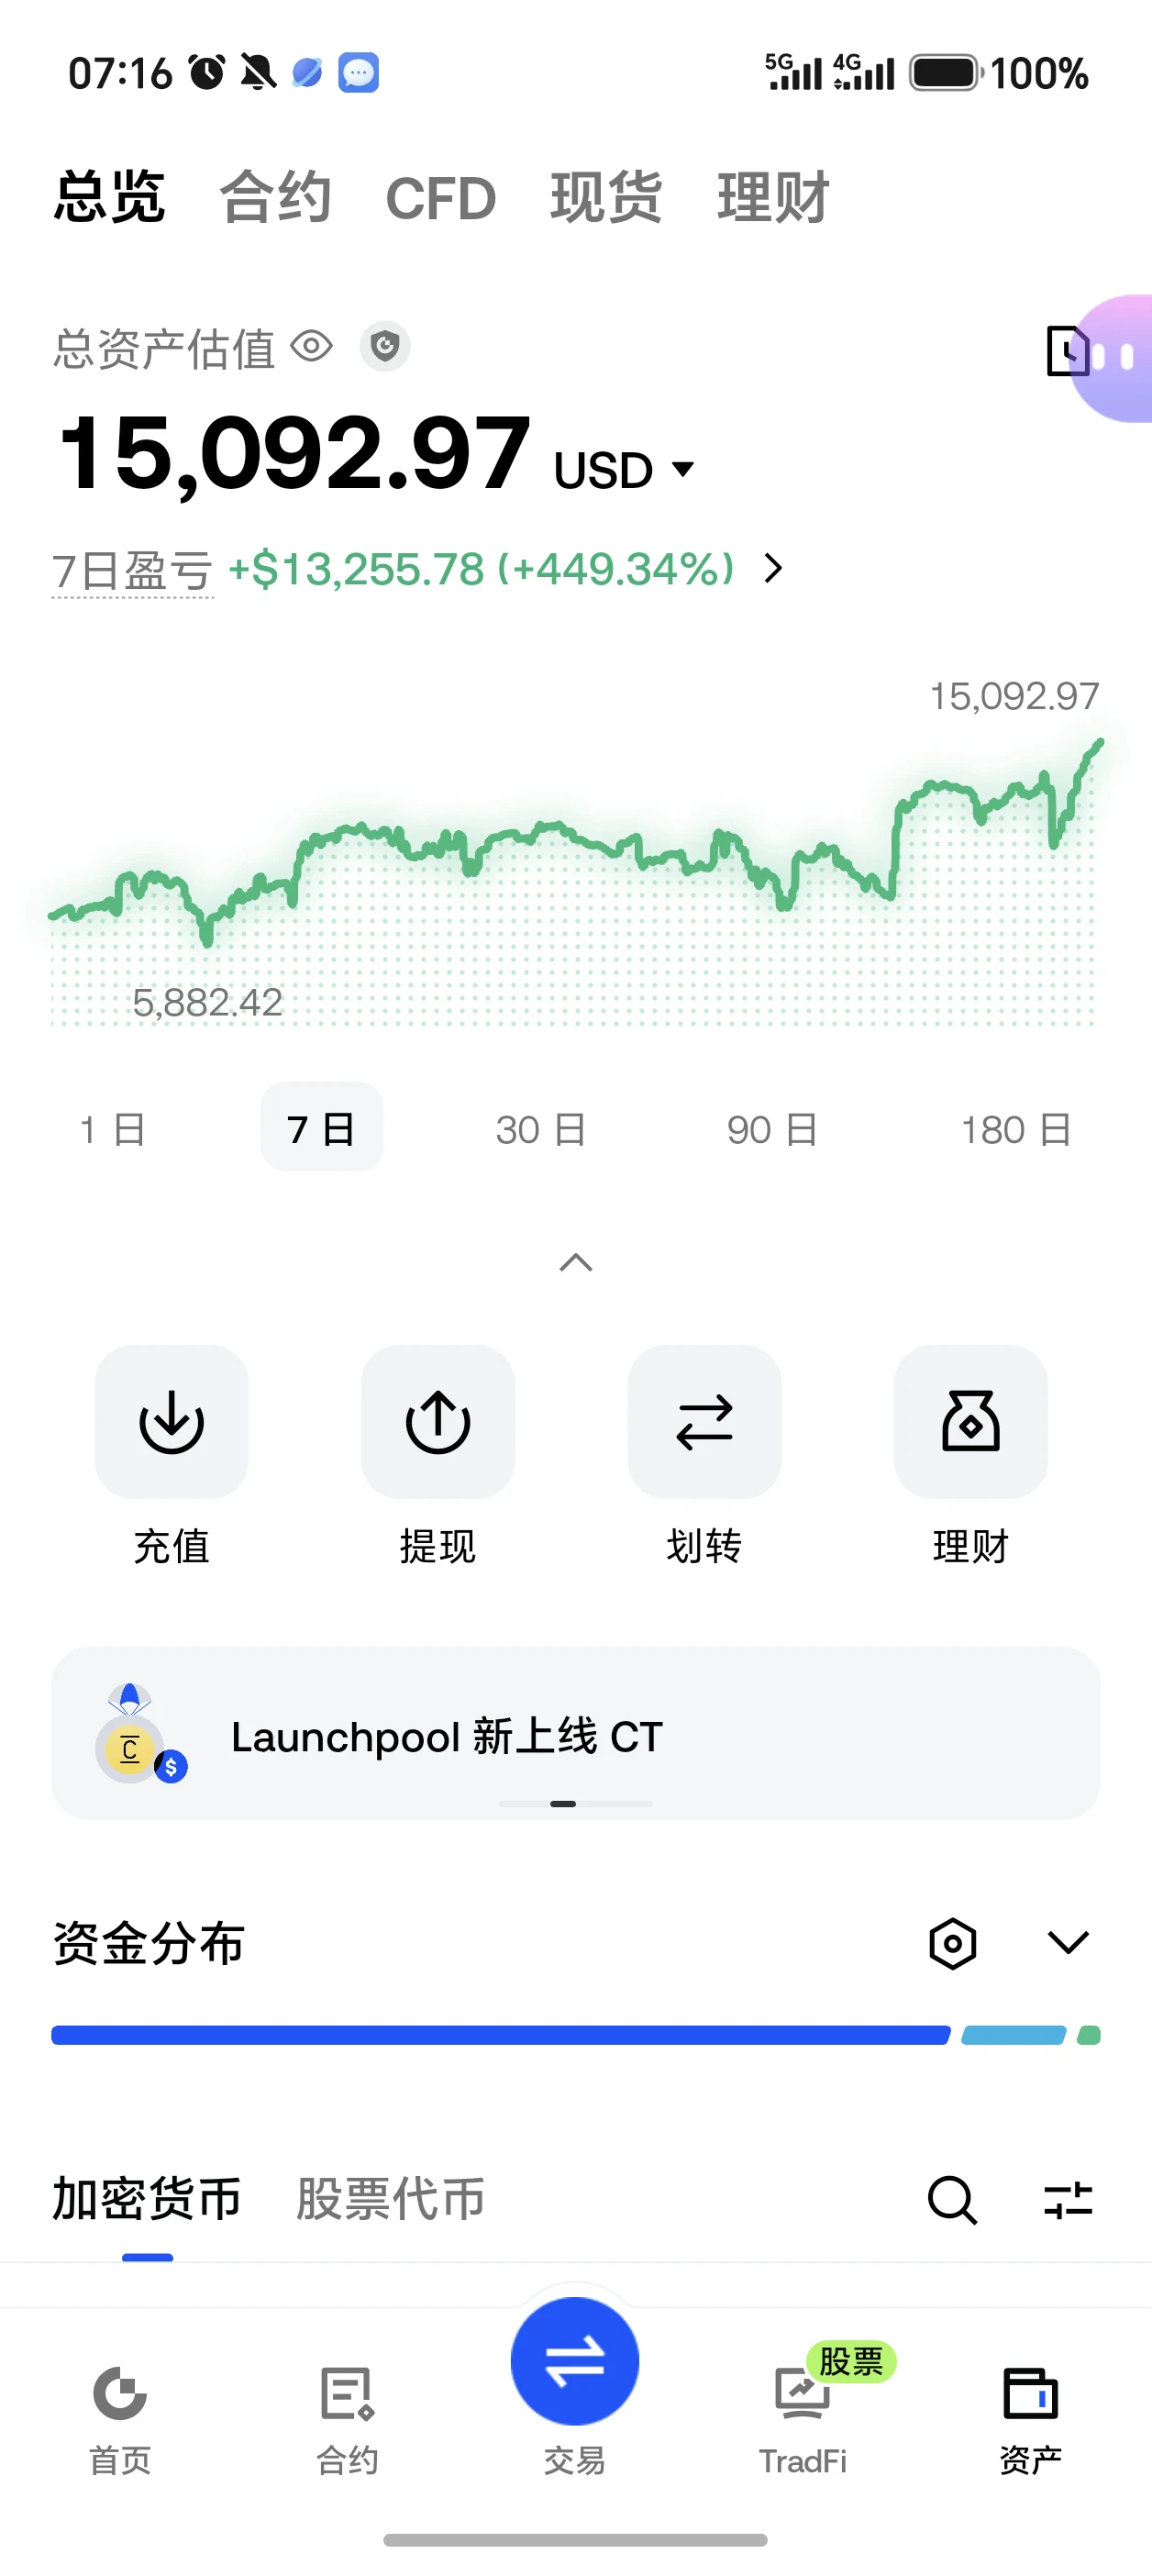
Went out to buy a steamed bun today, only to find my balance was too low.
Ugh, this sucks.
post-image
Review of yesterday’s livestream: all three trades ended in profit.
After the stream, we gave a clear advance call on the market outlook and the direction of U.S. stocks at the open.
U.S. stocks surged across the board at last night’s open, fully matching the outlook we had forecast on the livestream.
Market forecasts are only probabilistic projections; the market is always subject to change. Never let your guard down on risk management, and assess trading opportunities rationally.
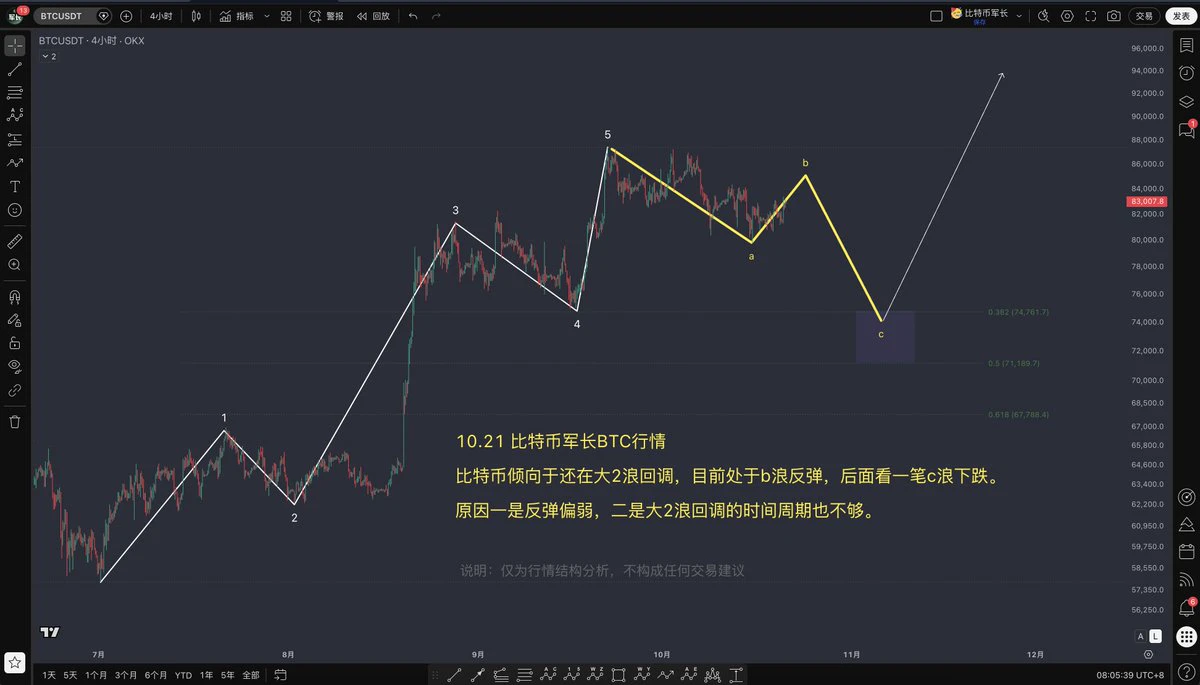
$BTC 10.21 Bitcoin Trend Analysis
Bitcoin is likely still in the larger Wave 2 correction and is currently experiencing a Wave B rebound, followed by a Wave C decline.
The first reason is that the rebound is relatively weak, and the second is that the time period of the larger Wave 2 correction is also insufficient.
Risk warning: This is only a market structure analysis and does not constitute any trading advice.
#BTC走势分析 #比特币走势分析
post-image
BTC+1.91%
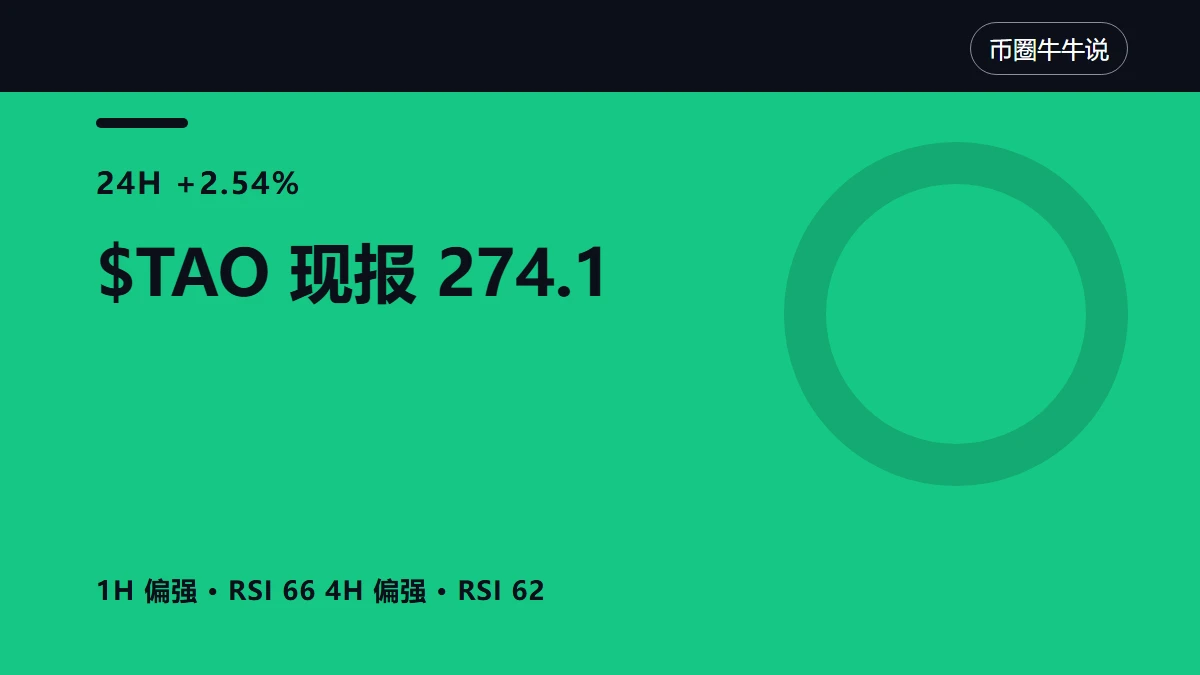
$TAO uses price and volume alignment to find opportunities, with levels and exit lines here
Today, $TAO is at 274.1, up 2.54% over 24 hours, but the 1-hour support is at 261.9 and resistance at 278.5. The price has moved, but volume is clearly below average. The direction can be trusted for now, but not its continuation; moves without follow-through can be reversed at any time.
My view: The direction is there for now, but low participation has weakened the credibility of this move.
The price has already moved, but volume is insufficient. Merely touching 278.5 does not count as breaking throug
post-image
TAO+3.23%
$BUN H12 rh eco picking up again
post-image
RH+5.03%
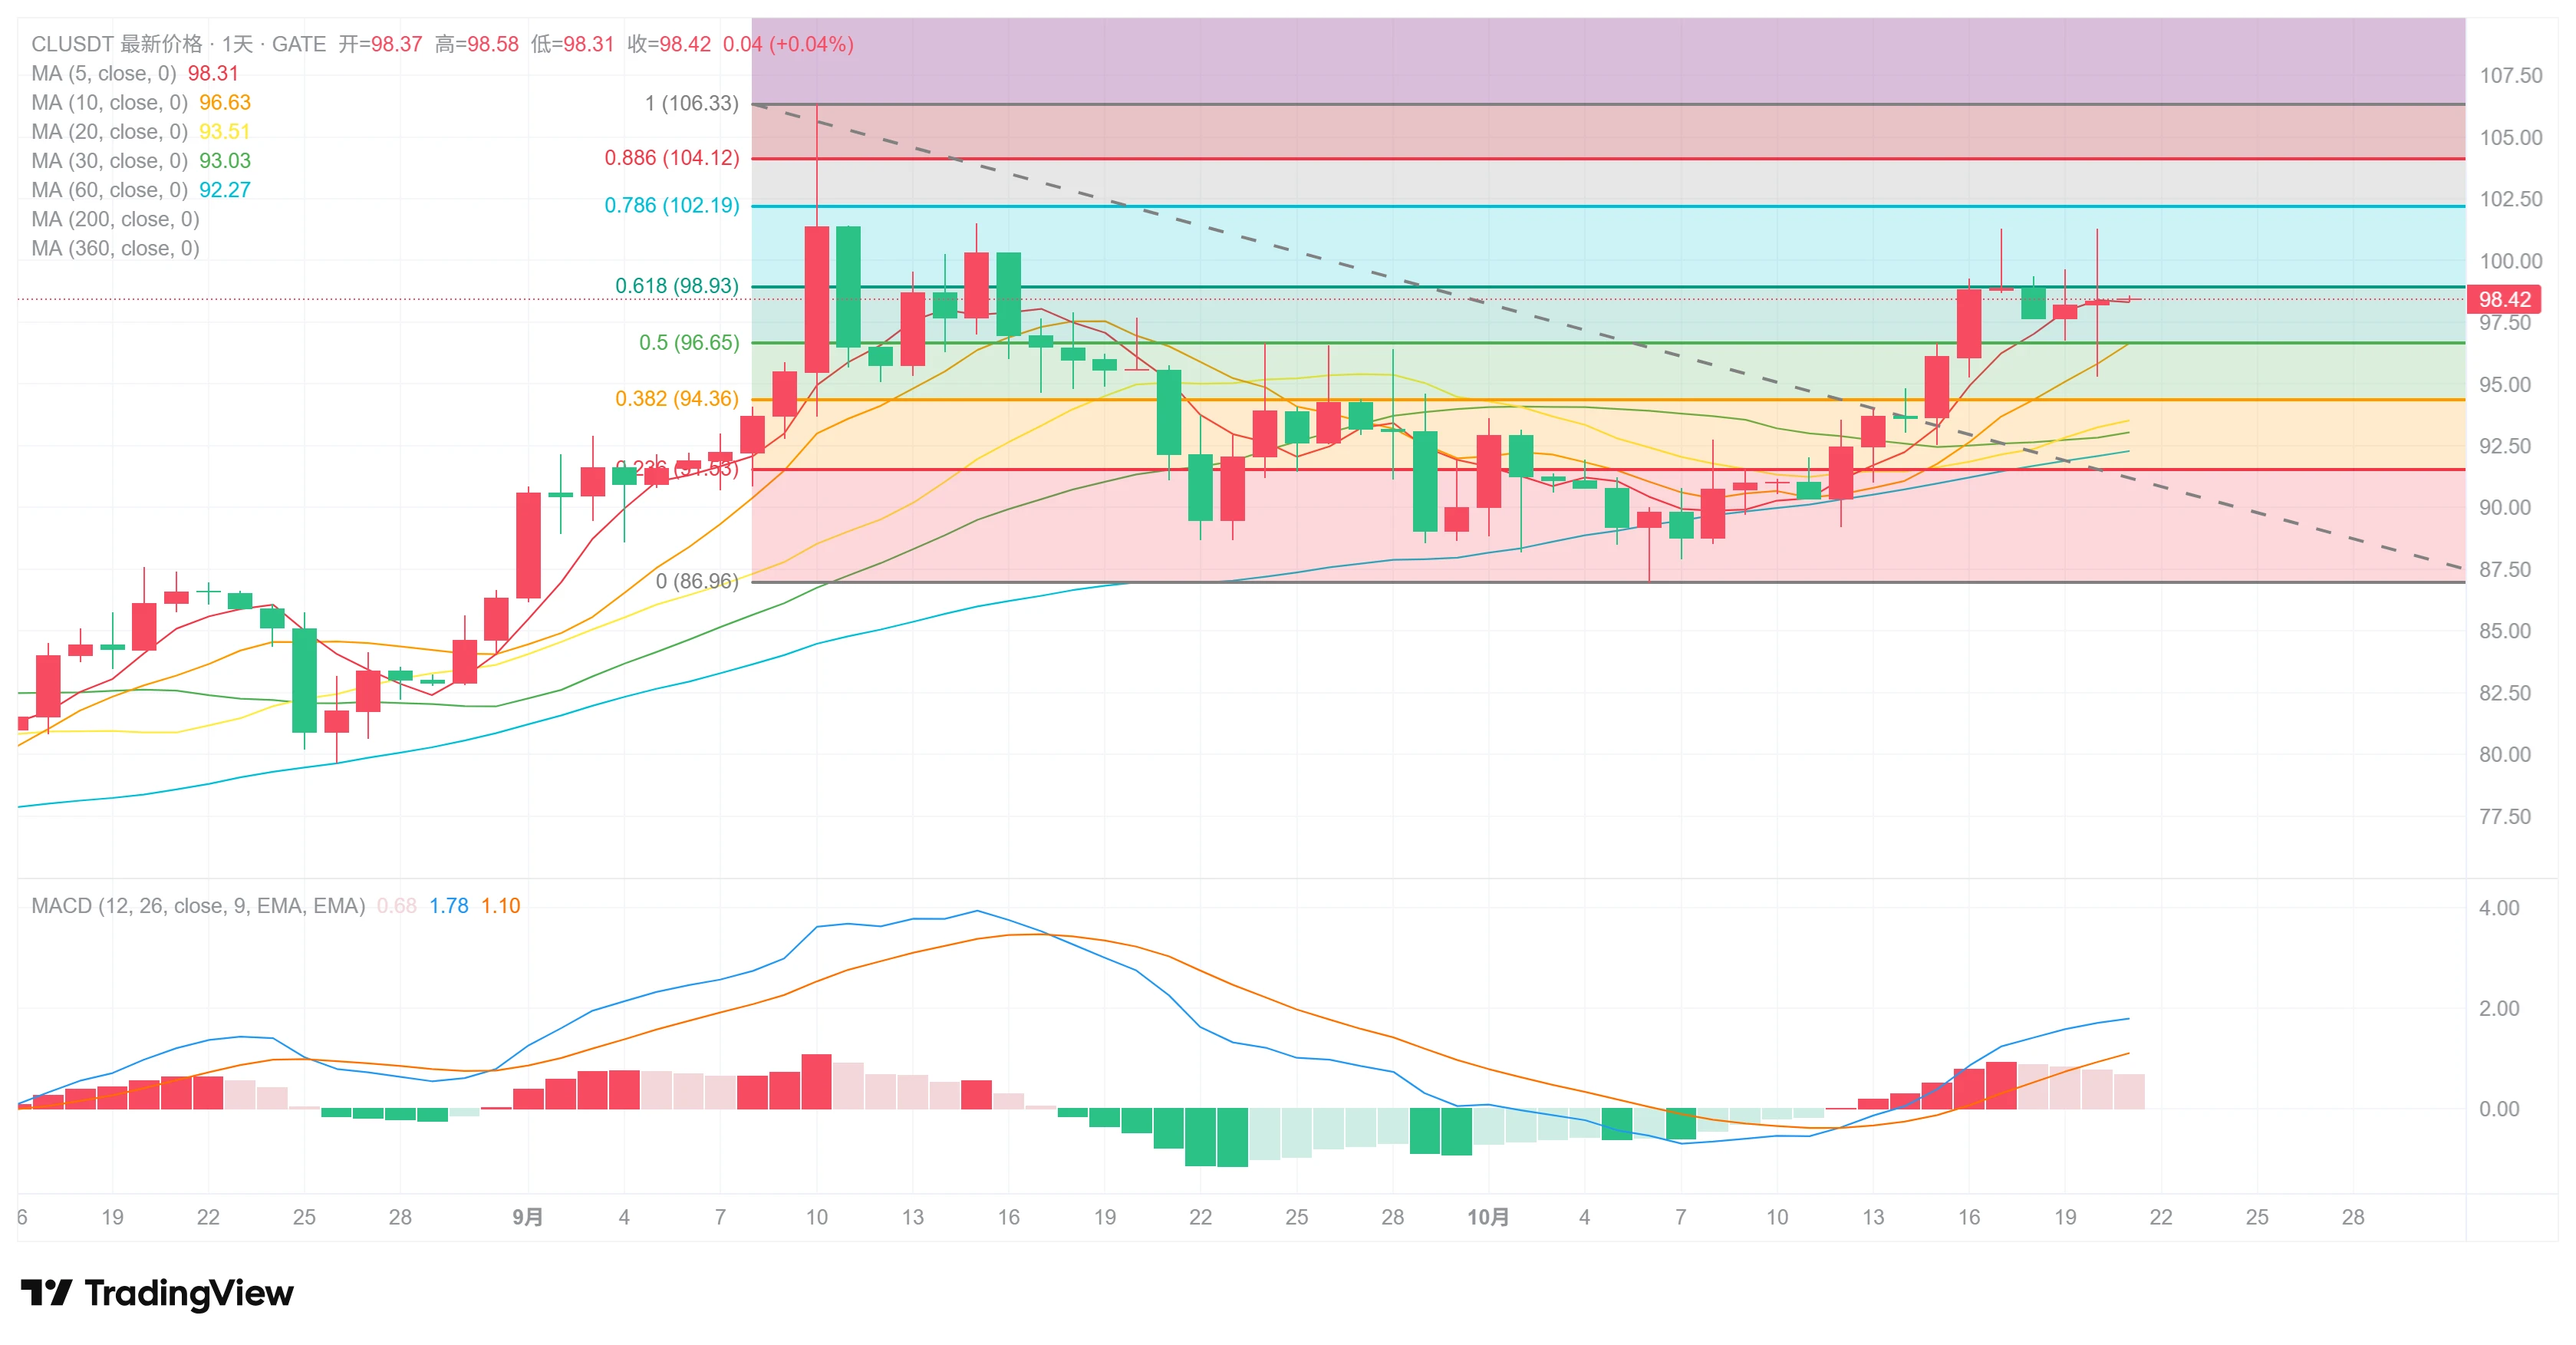
Bad Boy Watch: CL Crude Oil 10.21
CL rose and then fell yesterday, before closing with a doji. Bad Boy has said before that CL retesting the 10-day moving average would be an opportunity for us to reduce our U.S. stock positions. CL has now recovered somewhat, and the headwinds facing U.S. stocks remain.
Let’s see how CL and U.S. stocks perform tonight. Before month-end, we’ll continue to focus on reducing positions on rallies.
post-image
CL-0.19%
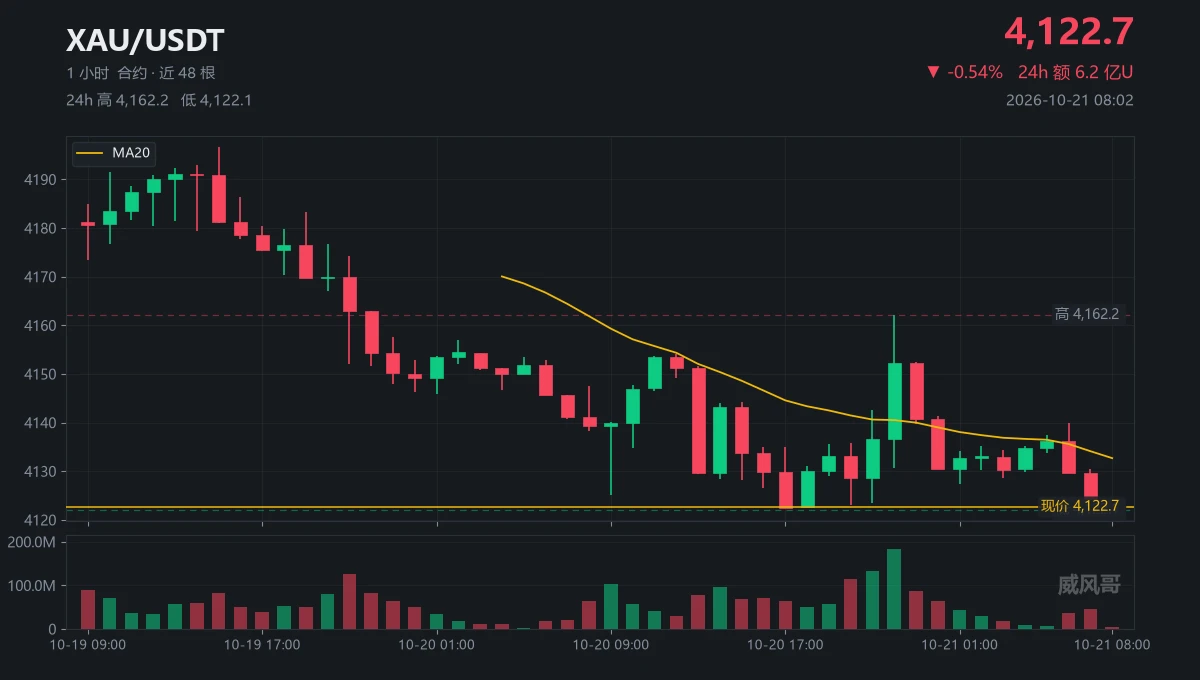
First, a bit of jargon: shorting at a new low is called handing your head to the market.
Someone asked me whether to buy the dip after $XAU had fallen for two days.
I replied: first, look at where the current price is.
4122.66. The 24-hour low is 4122.05.
Just 0.61 points apart.
Then they asked: Isn't this a double bottom?
I answered: A double bottom needs a proper bottom. This is a slow bleed lower.
At 22:00, a volume spike of 180 million pushed the price to 4162.16.
After that, volume shrank to 40 million. Volume is fading, and the price is leaking lower.
Finally, they asked: So, should I s
post-image
XAU-0.28%
🔥 $CVX is breaking out strongly, with a powerful bullish candlestick and a noticeable increase in trading volume. Buyers are actively entering the market, pushing the price above the upper boundary of the recent consolidation range. If bullish momentum continues and the breakout holds, CVX may continue to rise and test the next resistance level. 🚀Take profit: 3.528 Stop loss: 2.119 Long $CVX 👇
post-image
CVX+17.75%
Load More

Join 40 M users in our growing community

⚡️ Join 40 M users in the crypto craze discussion

💬 Engage with your favorite top creators

👍 See what interests you

Trending Topics

GateRanks2ndIn30DayNetInflows

6.18k Views787 Discussing

According to DefiLlama, Gate recorded over $199 million in net inflow over the past 30 days, ranking second among global centralized exchanges. Capital keeps flowing in — what's your strategy? [👉 Read more](https://www.odaily.news/en/newsflash/525820)

GateIdleFundsSurpass$300M

9.36k Views1.48k Discussing

TeslaQ3EarningsPreview

3.8k Views232 Discussing

View More