Square
Following
Hot
News
Notifications
Profile
Share your thoughts
placeholder
Article
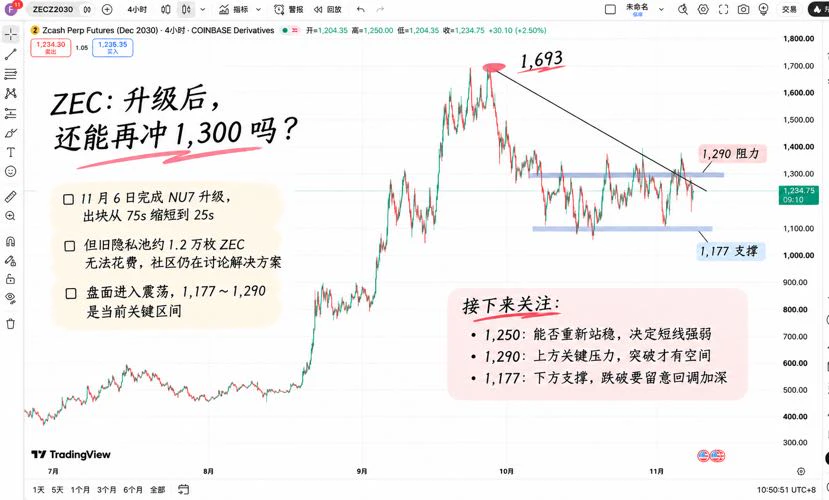
#WCTCS9 Whoa, $ZEC just finished upgrading, and now 12k coins are stuck?

On November 6, Zcash completed its NU7 upgrade, cutting the target block time from 75 seconds to 25 seconds. It was supposed to be good news, but an awkward issue cropped up elsewhere: the old Sprout privacy pool was shut down, leaving 12,224 ZEC that can’t be spent, and a recovery plan hasn’t been approved.

Now that’s interesting. The technology has indeed advanced, but rushing in as soon as you see the word “upgrade” is getting a bit carried away.

Looking at today’s market, ZEC plunged to a low of $1,177 before reb
post-image
ZEC+1.29%
After BTC Plunges, How Can You Tell a Normal Correction from a Trend Reversal?

Whenever Bitcoin sees a sharp drop, the easiest mistake for investors to make is to rush to conclusions about the market. Some believe it is a normal pullback in a bull market, while others think a bear market has begun. But the truly important question is: What signals should we use to distinguish between these two scenarios?

First, look at market structure. A normal correction typically does not completely break the previous upward structure. Prices may pull back, but key support areas may still hold. If prices
post-image
BTC-0.67%
Trenches
ZIG
Z
bade
b
ZIG
0x8c...1145
Market Cap
$.
Change
.
24h Vol
$.
Holders
.
BTC
B
bade
b
BTC
C5xp...pump
Market Cap
$.
Change
.
24h Vol
$.
Holders
.
STONK
S
bade
b
STONK
6GmA...UNgx
Market Cap
$.
Change
.
24h Vol
$.
Holders
.
ANSEM
A
bade
b
ANSEM
9cRC...pump
Market Cap
$.
Change
.
24h Vol
$.
Holders
.
牛逼
牛
bade
b
牛逼
0x96...7777
Market Cap
$.
Change
.
24h Vol
$.
Holders
.
Why do many trading strategies perform consistently in backtests, only to suddenly fail in a different market?

A trading strategy may have generated consistent profits over the past few months.

It may perform well in trending markets, with a beautiful backtest curve. But when the market enters a choppy phase or liquidity suddenly drops, signals that once worked may start failing frequently.

At this point, many people’s first reaction is: Are the parameters poorly tuned?

But the problem may have nothing to do with the parameters. It may be that the market conditions the strategy relies on t
post-image
Why does the price move in its original direction after you get stopped out?

You go long on BTC and set a stop-loss.

The price falls, triggering your stop-loss and closing your position.

But a few minutes later, the price starts rising again, even reaching your original target.

You might wonder: Was my stop-loss targeted? Is the market deliberately shaking retail traders out?

This can certainly be frustrating, but before drawing conclusions, you need to distinguish between several different causes.

A triggered stop-loss does not necessarily mean your trade thesis was wrong; a subsequent
post-image
BTC-0.67%
Good news lands, but the price gets dumped? The big players are faking a breakdown to shake out traders—the golden buying opportunity for $ZEC bulls is right in front of us!

Good news being fully priced in doesn't mean it's the top; a low-volume pullback is the real opportunity.

Personal view: This is a classic case of “buy the expectation, sell the fact.” The NU7 upgrade cuts block times from 75 seconds to 25 seconds. After the news was priced in, the big players took the opportunity to dump the price and shake out weak hands.

But look at the whales’ cards: 117.6 million in long positions
ZEC+1.29%
morning market update xrp
live-cover
LIVE2,241
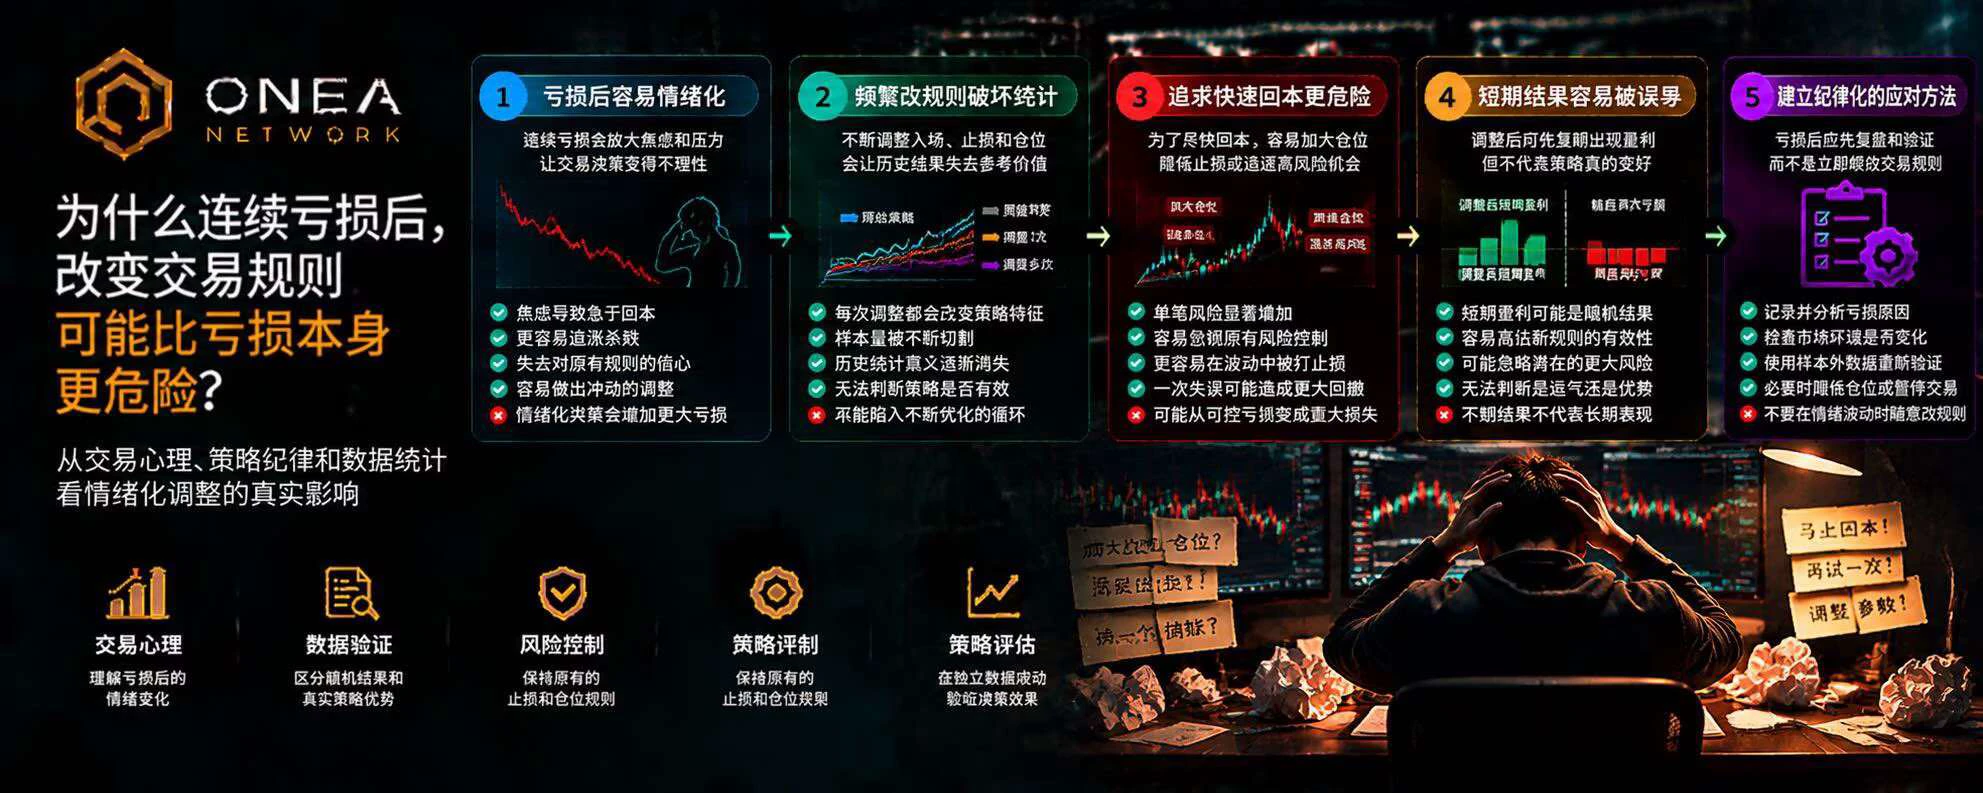
Why Can Changing Your Trading Rules After Consecutive Losses Be More Dangerous Than the Losses Themselves?

Many traders don't lose to the market. Instead, after a string of losses, they gradually abandon the trading discipline that worked for them.

First loss: They think it was just bad luck.

Second loss: They start to doubt the strategy.

Third loss: They change their stop-loss, adjust parameters, and increase their position size.

Fourth loss: They completely discard their original trading system.

Here's the question: Are you optimizing your strategy, or trying to escape the discomfort o
post-image
How can you tell whether a trading strategy truly has a statistical edge rather than making money by chance?

In trading, one of the easiest mistakes to make is treating profits as evidence that a strategy works.

A run of profitable trades could mean the strategy has an edge, or it could simply mean it happened to encounter favorable market conditions.

So how can you tell the difference?

The key is not how much a few trades made, but whether the strategy has a repeatable positive expected return after costs under sufficiently reasonable testing conditions.

1. First, understand what a real
post-image
How can you build a risk alert system for a trading strategy to identify anomalies before losses mount?

Many traders spend a lot of time studying entry signals, but rarely plan ahead for another question:

If a strategy starts to fail, how can I spot it in time?

By the time consecutive losses and a significant account drawdown prompt you to review the strategy, you may already have paid an unnecessary price.

A truly mature trading system needs more than entry and exit rules. It should also have a mechanism to identify anomalies, limit risk, and trigger a review.

I. First, be clear about wh
post-image
🔥ZEC shorts cashing in together, with pinpoint timing!
The strategy was laid out in advance: a rebound to around 1290 would be an entry point for shorts. Yesterday, the market surged as expected into that resistance zone, but the bulls lacked the strength to push higher and retreated under pressure. The morning low was 1176, capturing a 114-point move. The high-level short setup paid off precisely once again!
Every rebound gives shorts an opportunity, with entry levels called perfectly. Whether BTC, ETH, or ZEC, the shorts have dominated across the board!#美国10月CPI即将公布 $ZEC
post-image
ZEC+1.29%
Why Can a Strategy Perform Well in Backtests but Keep Losing in Live Trading?

A trading strategy can perform exceptionally well on historical data, with a high win rate, a beautiful equity curve, and a small maximum drawdown.

But once deployed in a real market, the results can be completely different: execution prices are less favorable, trading costs keep rising, returns gradually shrink, and losses may even persist.

So where does the problem lie?

Often, it’s not that backtesting has no value, but that we treat backtest results as a guarantee of live performance.

I. Backtests Test Histor
post-image
Why can some people follow the same trading signals consistently over the long term, while others keep changing their plans at critical moments?

Many traders are not lacking indicators or trading strategies.

They know where to enter, where to set a stop-loss, and how to manage their position size.

But once they actually enter the market, everything changes.

When they are in profit, they worry about giving it back and close their positions early.

When they are losing, they refuse to admit they were wrong and widen their stop-loss without authorization.

When the market rises, they fear mis
post-image
$SOL Yaoyao | 11.09 Solana Strategy
Entry: Short near the rebound at 88.60-89.10
Support zone: 86.80 - 87.20
Upside levels: First resistance at 88.60, strong resistance at 89.10; historical high resistance at 89.98
Pullback target: 86.80-87.20

Trend structure: The main downtrend began at 89.98, with a long bearish candle driving the price down to a low of 84.66. A bearish-led downtrend structure is now in place. The current rally is merely a corrective rebound after being deeply oversold, not a bottom reversal. A reversal requires lows to keep rising and a break above the previous high; there
post-image
SOL-0.74%
Why Can a Small Adverse Price Move Cause Massive Losses When Using High Leverage?

In the cryptocurrency market, some traders use high leverage because they hope to control larger positions with less margin.

But they often overlook one key issue:

Leverage amplifies not only potential gains, but also the rate of losses relative to their own margin.

When the price moves against them, their margin can shrink rapidly. Once account equity is insufficient to meet the platform’s maintenance margin requirement, forced liquidation may be triggered.

I. How Exactly Does Leverage Amplify Risk?

Suppos
post-image
How can you tell whether a trading strategy has a genuine statistical edge rather than making money through luck?

In trading markets, one of the easiest mistakes to make is treating profits as evidence that a strategy works.

A string of profitable trades could mean the strategy has an edge, or it could simply mean the market happened to be favorable to it.

So how can you tell the difference?

The key is not to look at how much a few trades made, but to determine whether the strategy has a repeatable positive expected return after costs under sufficiently reasonable testing conditions.

I. F
post-image
Crypto Market Plunges Across the Board: BTC Breaks Below a Key Level—What Exactly Happened?

Today, the cryptocurrency market saw another significant decline, with Bitcoin, Ethereum, and a range of major altcoins all under pressure. This is not just an issue with one coin; overall market risk appetite is shifting.

Three factors behind this decline are worth watching.

First, regulatory expectations have changed. After the U.S. midterm elections, the market began to worry that cryptocurrency regulations could become stricter in the future. Greater policy uncertainty can lead institutions and i
post-image
BTC-0.31%
ETH-1.26%
📊 **MARKET OUTLOOK: BTC, AI STOCKS & US CPI — WHO WILL DOMINATE THE MARKET?**

The market is in a highly uncertain phase. After US Nonfarm Payrolls (NFP) data exceeded expectations, investors are now focused on the upcoming US CPI release.

**₿ 1. Bitcoin (BTC)**
BTC briefly fell below $75,000. In my view, this area is an important one for market participants to watch. If selling pressure starts to ease and buyers return, a rebound is still possible. However, if support fails to hold, BTC could seek a lower support level.

**💻 2. AI Technology Stocks**
Friday's Nasdaq rebound brought hope fo
post-image
BTC-0.67%
  • 4
On November 2, Yushu said there would be one more C-wave rally. Today, November 9, the C-wave rally arrived, up 9% and very close to the upside target of 109.75 (it actually reached 109.5). The prediction was correct. What happens next? I share my view in image two. ​​​​$UNITREE ‌
UNITREE+4.35%
ZEC’s daily structure continues to shift lower, with price under pressure below the Bollinger middle band. 1290 has become strong resistance. There is currently no clear bullish reversal signal, and the overall setup remains weak and range-bound. 1300 is the bull-bear dividing line; no reversal is expected before price holds above it.
After declining on the 4-hour chart, price has entered a choppy consolidation. Downside momentum has briefly eased, forming a typical bearish continuation pattern. The key rebound resistance zone is 1275–1290, a high-volume area where price previously surged and
post-image
ZEC+1.29%
🔹Democrats Sweep Congress: Is a Major Shift Coming for Crypto? Tighter SEC Oversight and Prediction
live-cover
LIVE1,948
Load More

Join 40 M users in our growing community

⚡️ Join 40 M users in the crypto craze discussion

💬 Engage with your favorite top creators

👍 See what interests you

Trending Topics

USCPIDataIncoming

22.8k Views1.73k Discussing

The U.S. October CPI report will be released on November 10 at 8:30 a.m. ET. September CPI came in at 3.7% year over year, and markets will be watching closely for signs that inflation is cooling, especially in core CPI. A softer-than-expected reading could strengthen rate-cut expectations, while hotter inflation may pressure risk assets through higher Treasury yields and a stronger dollar. How do you think this CPI print will move $BTC, U.S. stocks and gold?

BTCFlashCrash

22.73k Views66.05k Discussing

USAIStocksHitHard

31.41k Views3.75k Discussing

View More