Square
Following
Hot
News
Notifications
Profile
Share your thoughts
placeholder
Article
Bro, if you tend to get carried away when opening positions, go out for a walk and cool off.
[Position details]:
$ETH The market stayed range-bound during the day yesterday. It tested the 2040 level several times without breaking below it, suggesting short-term support had formed below. Volume within the range had also dried up noticeably. After forming a higher-high pattern, the market pulled back. A long position was opened on a 3K reversal at the bottom. It then climbed to 2070 before pulling back into a trading range. The bottom held above 2040, which was seen as a bear trap, so a take-pro
ETH-1.23%
BTC-0.65%
Why Can a Trading Strategy with a High Win Rate Still Lose Money Over the Long Term?

A trading strategy with an 80% win rate sounds excellent, doesn’t it?

But suppose you make 100 trades, win 80 times and earn $10 each time, and lose 20 times and lose $50 each time.

What’s the final result?

Profits: 80 × 10 = $800

Losses: 20 × 50 = $1,000

A final loss of $200, not including fees and slippage.

That’s why you can’t judge a trading strategy by its win rate alone.

I. Why Can a High Win Rate Still Lose Money?

What really determines long-term returns is the relationship between the win rate
post-image
Trenches
Max
M
bade
b
Max
5qaP...pump
Market Cap
$.
Change
.
24h Vol
$.
Holders
.
mihao
m
bade
b
mihao
4Cxj...pump
Market Cap
$.
Change
.
24h Vol
$
Holders
.
AGT
A
bade
b
AGT
0x5d...e274
Market Cap
$.
Change
.
24h Vol
$.
Holders
.
DacityCoin
D
bade
b
DacityCoin
DKYc...pump
Market Cap
$.
Change
.
24h Vol
$.
Holders
.
FLOAT
F
bade
b
FLOAT
Bv1a...BMmr
Market Cap
$.
Change
.
24h Vol
$.
Holders
.
#WeeklyShare, #GateSquare.
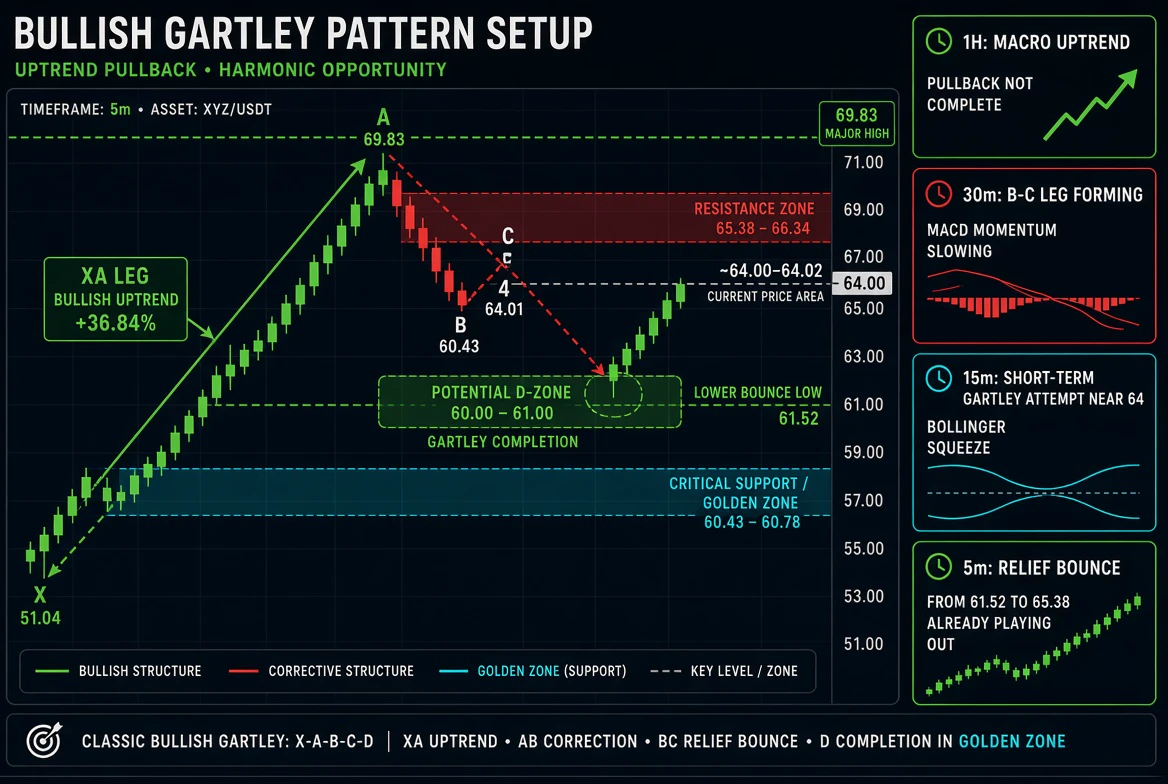
While making a trade, I only focus on one time frame, which results in my getting liquidated. Now I am trying another method. As we know, market sentiment is very low, but a few stocks are high, so now I am watching four charts /1 hour, 30 min, 15 min, and 5 min , so that the final decision can be made.

🔷️The 1-Hour Chart - The Big Picture

· What it shows: This is the most important chart for the overall trend. It shows a massive, sustained uptrend from roughly $51.04** up to **$69.83

· The Structure: The recent drop is just a pullback within a larger bullish mo
post-image
  • 10
  • 2
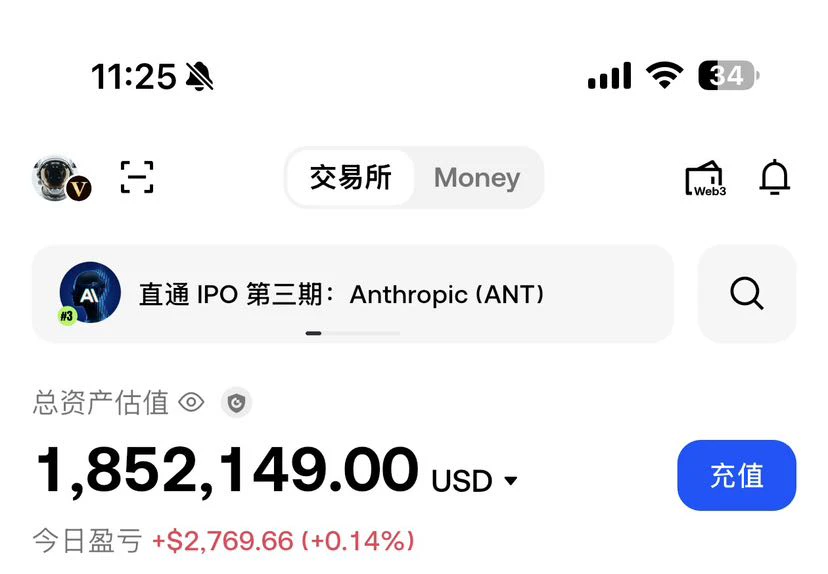
10000U principal, currently 1.8 million U
post-image
  • 9
  • 2
2013-2026
A lot has changed in these 13 years
🔹Rising Inflation Sends Treasury Yields Surging! The 2-Year Treasury Yield Posts Its Biggest Single
live-cover
LIVE1,803
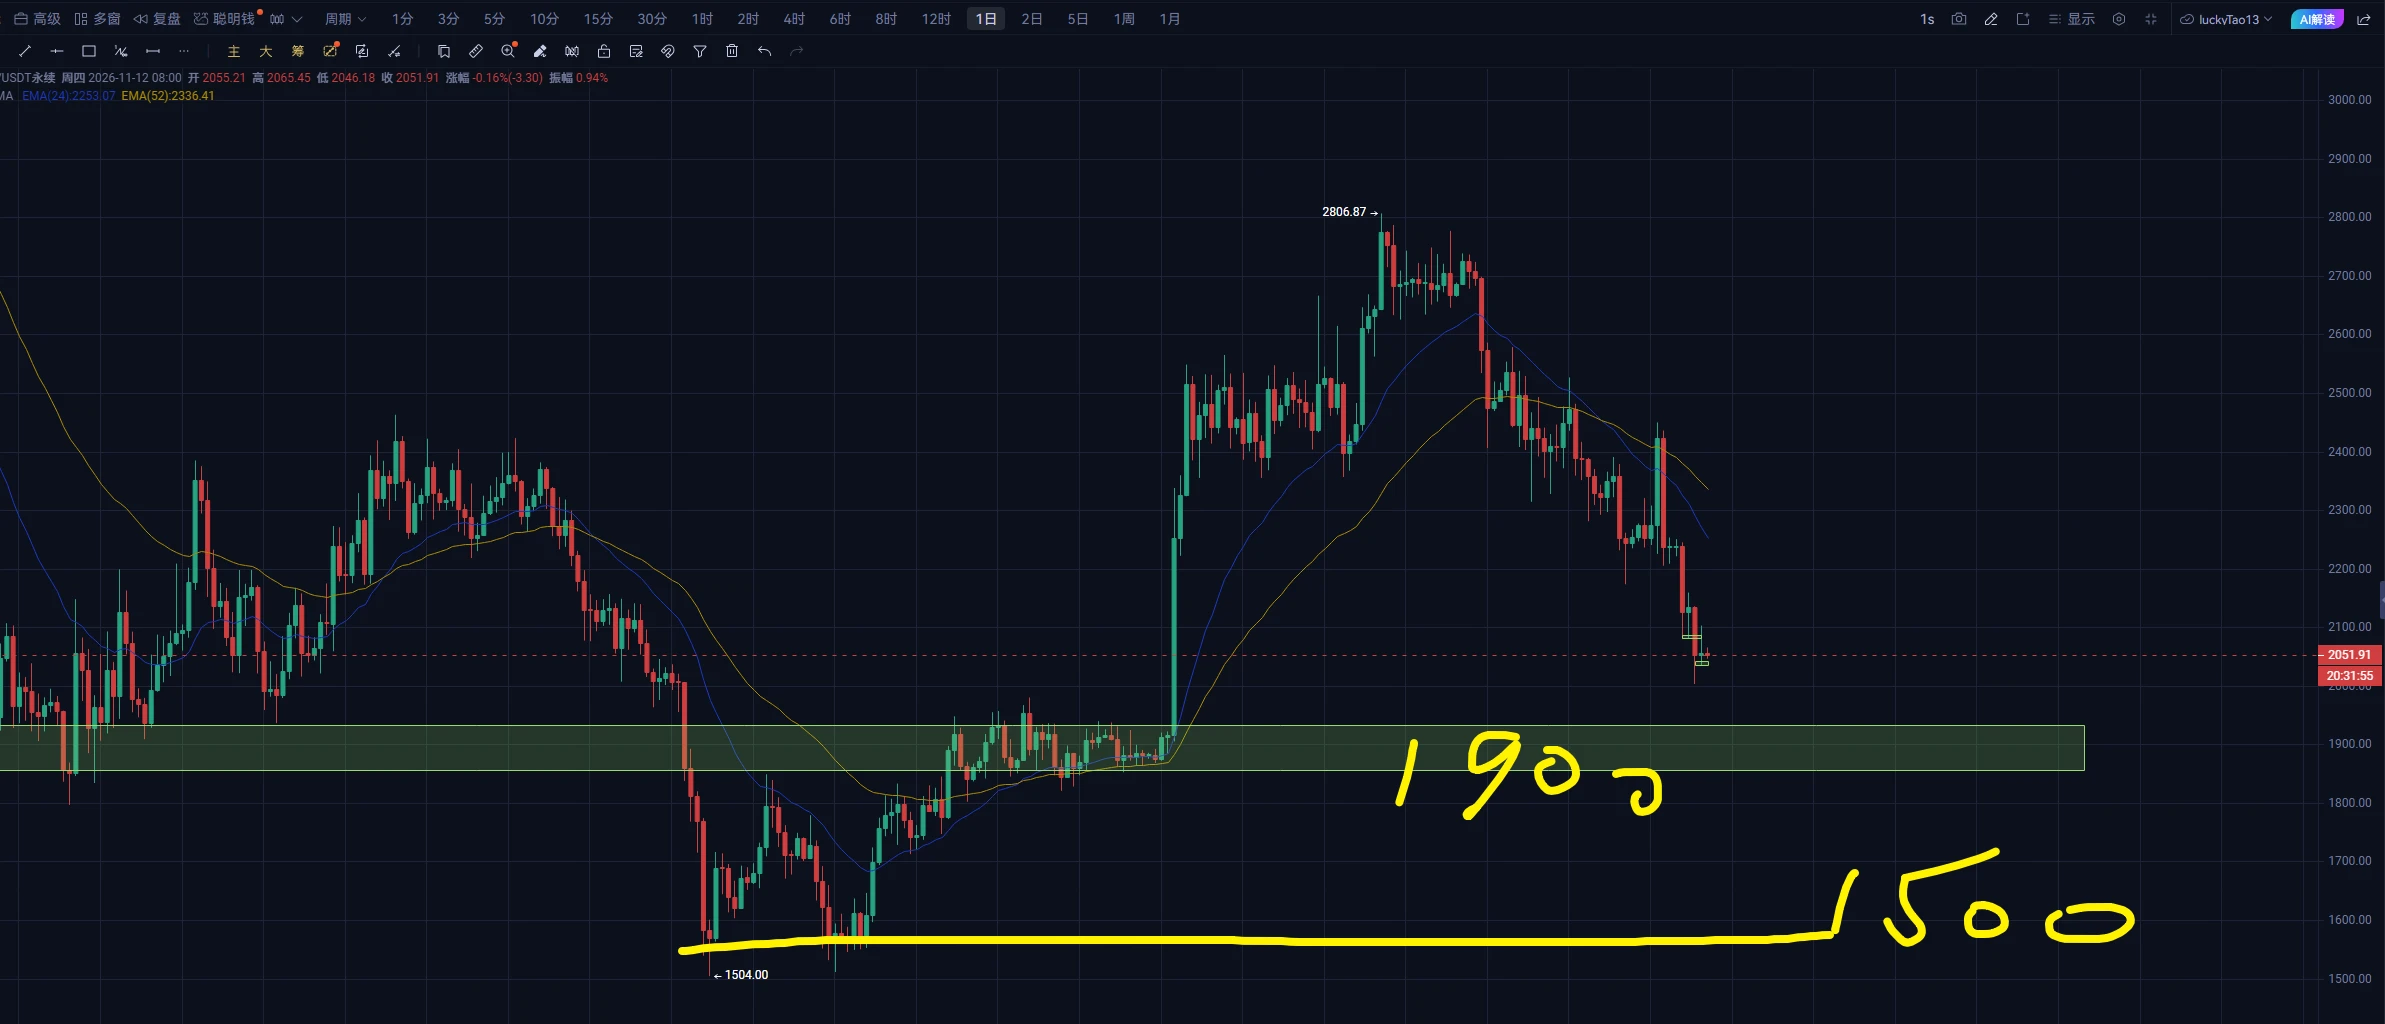
ETH daily timeframe analysis:
This decline has not yet reached the 1900-2000 support zone, so there is still room to fall. Those looking to buy spot or bottom-fish with low-leverage contracts can start building a position around 1900-1950.
If the downtrend continues toward a double bottom at 1500, you can keep adding to your position at support levels. So plan your add-on levels and position-size ratios, and execute the strategy like a Martingale.
Those currently trading regular contracts can focus more on the 1-hour and 4-hour charts. $ETH
post-image
ETH-1.23%
Which young master wants NVIDIA?
post-image
NVDA+2.99%
Why Can Continuous Profits Make Losses More Likely?

In cryptocurrency trading, a series of losses can make people cautious, but a series of wins can sometimes make them let their guard down.

After making profits on several consecutive trades, many people may unconsciously start to feel:

“I’ve figured out how the market works.”

Then they start increasing their position sizes, widening their stop-losses, and gradually abandoning the trading plans they used to follow strictly.

It’s not until an unexpected drawdown wipes out a large portion of their accumulated profits that they realize the r
post-image
Understanding DeFi Protocols—Don’t Just Focus on APY: Where Does the Yield Come From? Who Bears the Risk?

In DeFi (decentralized finance), one question that is easy to overlook is: when a protocol displays an attractive annual percentage yield, where does that yield actually come from?

APY is only a presentation of the outcome and cannot, on its own, prove that a protocol is worth participating in.

To assess whether a DeFi protocol is sustainable, you can start with the following four areas.

1. Where does the yield come from?

Yield may come from interest paid by borrowers, trading fees, l
post-image
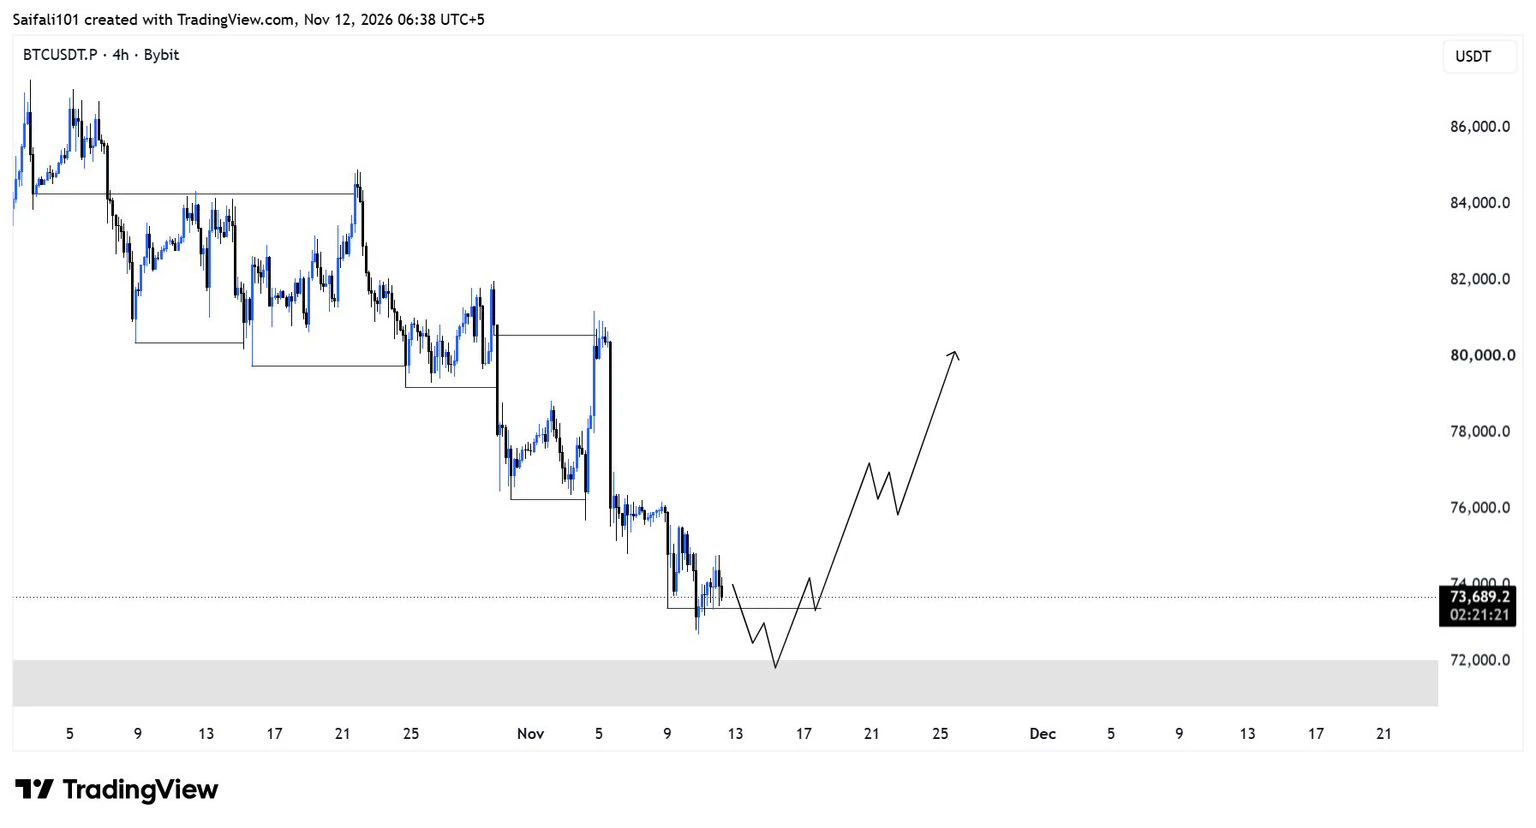
$BTC Weekly Update

BTC is ranging for more than 3 days now, just as I mentioned in my previous plan.

My plan remains the same. I’m expecting a proper retracement toward the 72K zone, where I’ll look for bullish confirmation to swing long BTC for the next leg toward 90K.

We’re very close to the bottom. Just have some patience, and I expect prices to be much higher in the coming weeks.

#GateIPOAccessAnthropic #USJoblessClaimsTonight #JensenHuangCouldFaceRemoval
post-image
BTC-0.67%
  • 2
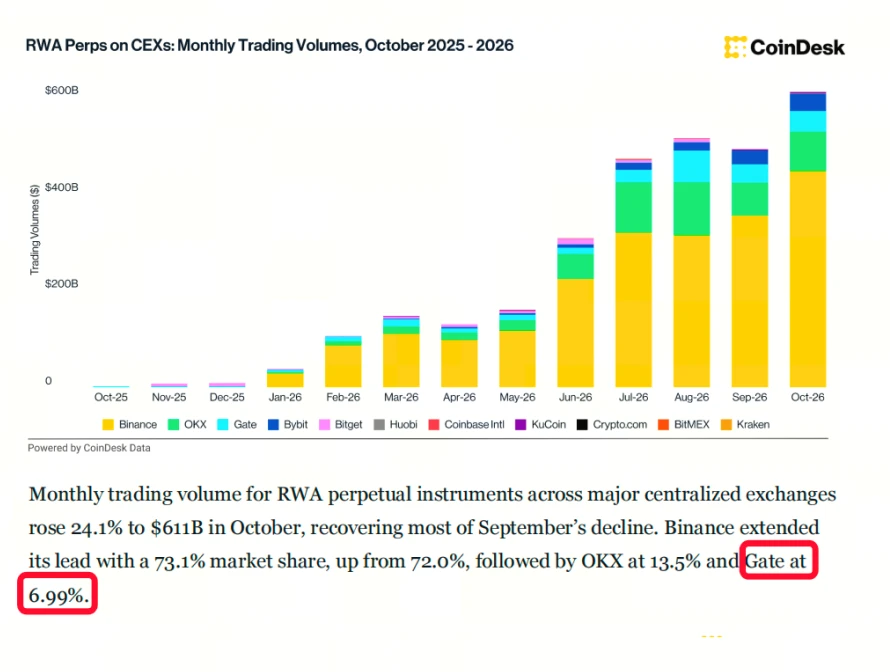
According to CoinDesk's latest October report, monthly trading volume for RWA perpetual contracts across major exchanges surged 24.1% in October, reaching $611 billion; meanwhile,
Gate captured 6.99% of the market, securing third place globally!

More and more capital now favors seamlessly switching between Crypto and traditional assets like US stocks and commodities in a single account, without the hassle of moving funds in and out. Ranking among the global top three in this emerging market shows that real money is flowing in, and that market depth and execution speed can fully withstand lar
post-image
Why Do Some Tokens Have High Trading Volume but Their Prices Still Fail to Rise?

In the crypto market, a puzzling phenomenon sometimes occurs:

Trading volume keeps growing, and market discussions become increasingly lively, but the token price continues to fluctuate within a range.

Many people assume that rising trading volume means money is flowing in and that the price will soon break out.

But that is not always the case.

Trading volume reflects trading activity, while price changes depend on how buyers and sellers transact and whether the market can continue absorbing selling supply.

post-image
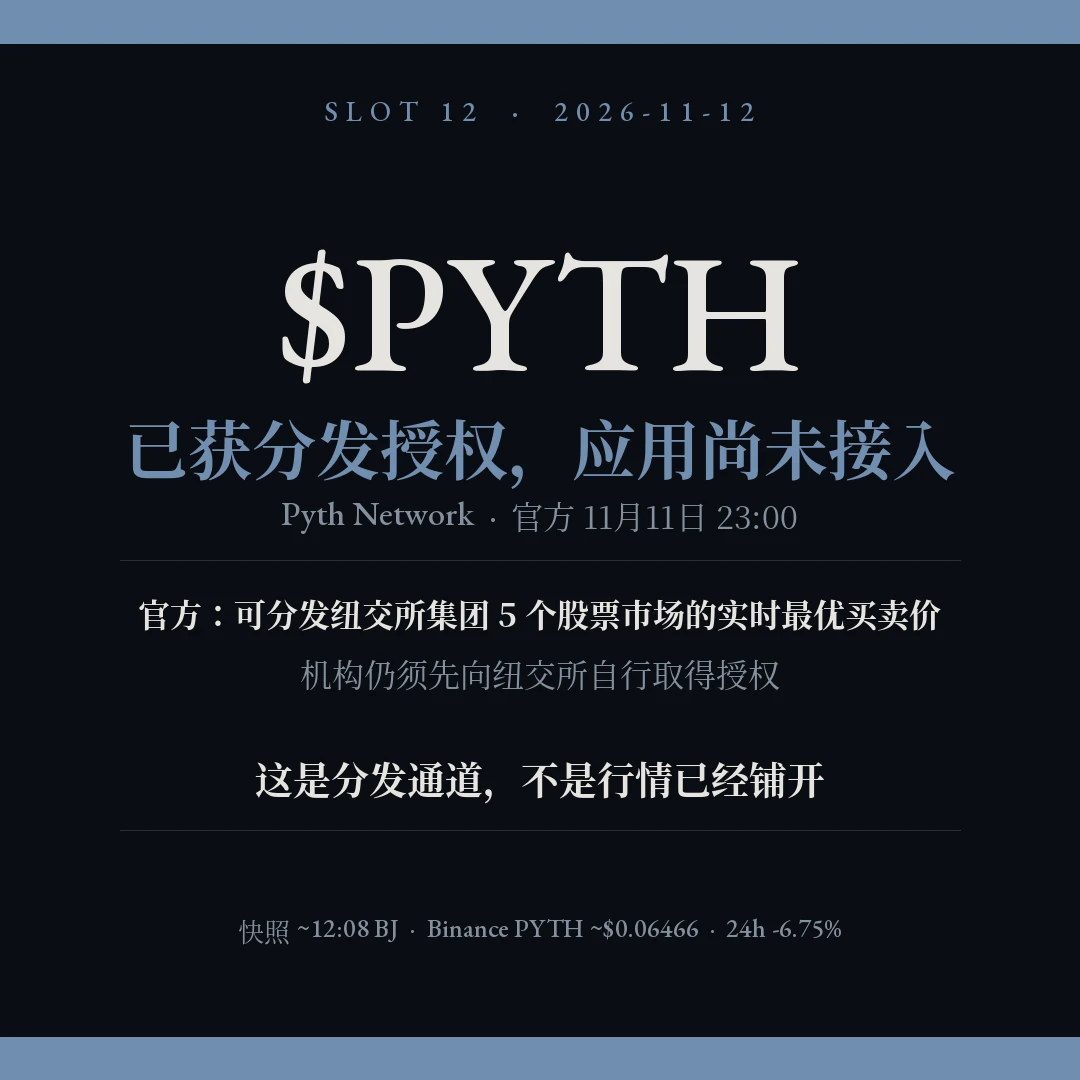
Don’t rush to interpret this authorization as NYSE market data already being available on-chain.
At 23:00 Beijing time on November 11, market data provider Pyth Network officially announced that it had become an authorized distributor of NYSE market data. Applications can use its data marketplace to access real-time best bid and ask prices from five equity markets under NYSE Group, covering stocks and ETFs. The official announcement specified that this covers only the top of the order book, not deeper levels. Institutions that want to use it must first sign an authorization agreement with NYSE
post-image
PYTH+3.23%
Whales Moves in Sync!
live-cover
LIVE1,969
What is Layer 2? How does it improve blockchain performance?

Many people encounter several problems when using blockchains: slow transaction confirmations, high fees, and network congestion.

Layer 2 (second-layer networks) is a type of scaling solution developed to address these issues.

I. Why is Layer 2 needed?

Take Ethereum as an example: the main chain must not only process transactions, but also maintain network security, verify state, and complete final settlement. When demand grows rapidly, limited block space can lead to higher transaction fees and longer confirmation times.

The id
post-image
ETH-1.26%
Stablecoins Are Not Bank Deposits: 4 Differences You Must Understand Before Using Them

In the Web3 world, stablecoins are often used for trade settlement, cross-border transfers, on-chain payments, and decentralized finance.

Because many stablecoins are pegged to the US dollar, many users assume that as long as the price stays close to $1, they are roughly the same as dollars in a bank account.

But there are several important differences between the two.

First, a price peg is not a guarantee of principal.

Stablecoins typically use reserve assets, redemption mechanisms, or other designs to
post-image
11.12 Thursday Midday Market Analysis
The downtrend has yet to reverse. ETH’s most obvious issue is not whether it can rebound in the short term, but that rebounds have consistently failed to change the broader weak structure.
On the 4-hour chart, after retreating from a high near 2449, ETH has continued to form lower highs and lower lows, with a low of around 2003. Although the price has returned to 2055, it remains in a downtrend overall.
After rebounding to 2103.6 on the 4-hour chart, ETH faced selling pressure again, indicating that a clear supply zone has formed around 2100. The rebound f
post-image
ETH-1.23%
BTC-0.67%
COIN+3.17%
  • 8
  • 3
What Is a DEX? How Is It Different from a Centralized Exchange?

In the Web3 world, there is more than one way to trade crypto assets.

Some people are used to centralized exchanges (CEXs), while others connect their wallets directly and trade through decentralized exchanges (DEXs).

They may both appear to let users buy and sell tokens, but they differ significantly in their trading mechanisms, control over funds, and risk profiles.

I. How Are Trades Executed?

Centralized exchanges are usually operated by platforms that handle order matching, account management, and maintenance of trading s
post-image
Load More

Join 40 M users in our growing community

⚡️ Join 40 M users in the crypto craze discussion

💬 Engage with your favorite top creators

👍 See what interests you

Trending Topics

GateIPOAccessAnthropic

247.65k Views2.31k Discussing

Gate IPO Access Phase 3 features Anthropic (ANT), with USDT subscription interest starting from 100 USDT. Successful allocations will be delivered as real shares to Gate Stock Accounts. Indicative price: $70–$78/share Subscription: Nov 12–17 (UTC+8) Allocation is not guaranteed. Please manage risk accordingly.

USJoblessClaimsTonight

165.72k Views32.8k Discussing

JensenHuangCouldFaceRemoval

219.19k Views2.42k Discussing

View More