Square
Following
Hot
News
Notifications
Profile
Share your thoughts
placeholder
Article
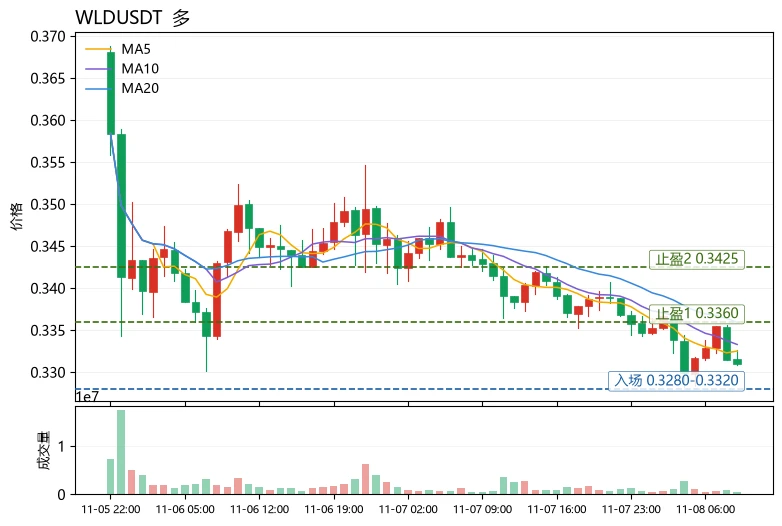
The Fear & Greed Index is only 28, yet the most unusual thing has happened: $WLD funding is at -0.0094%, meaning shorts are paying to hold their positions, but the price has not accelerated downward; instead, it is grinding near the lower Bollinger Band around 0.3294 on declining volume. This suggests that bearish sentiment has already been priced in quite fully by shorts, and the risk-reward of chasing further downside is worsening.
At the broader market level, $BTC is currently at 75792, down just -0.14% over 24h. MA5 is slightly below MA20, RSI is 43.7, and the 30-candle range is only 0.9
post-image
WLD-5.61%
BTC-0.67%
MITO+8.51%
Crypto Market update
live-cover
LIVE339
Trenches
ZIG
Z
bade
b
ZIG
0x8c...1145
Market Cap
$.
Change
.
24h Vol
$.
Holders
.
STONK
S
bade
b
STONK
6GmA...UNgx
Market Cap
$.
Change
.
24h Vol
$.
Holders
.
IDOL
I
bade
b
IDOL
0x3b...ab07
Market Cap
$.
Change
.
24h Vol
$.
Holders
.
BTC
B
bade
b
BTC
C5xp...pump
Market Cap
$.
Change
.
24h Vol
$.
Holders
.
CLAUDIA
C
bade
b
CLAUDIA
2j5S...W2ZM
Market Cap
$.
Change
.
24h Vol
$.
Holders
.
I'm trading on Gate, a top-tier exchange with a 13-year track record. Come join me and dive into the hottest events right now! https://www.gate.com/campaigns/6905?ref=VLARBF1YAG&ref_type=132
post-image
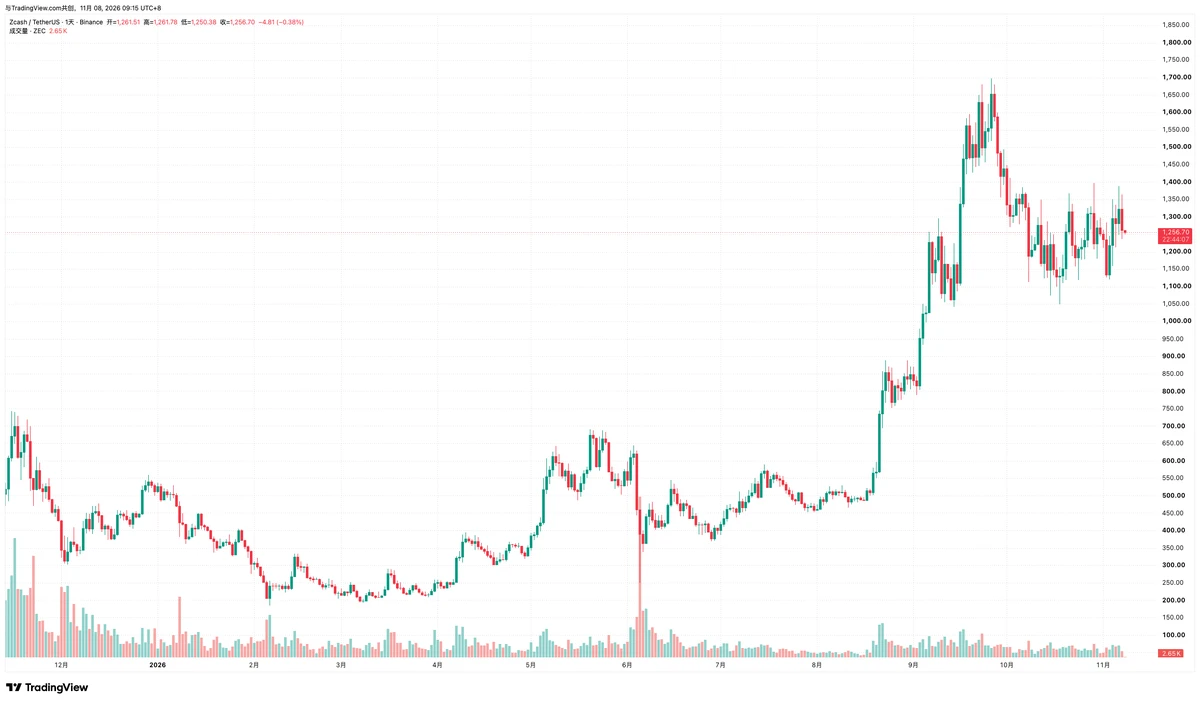
Over the weekend, I pulled up the hottest name and looked at it again.
It’s been stuck between 1120 and 1400 for 20 days.
On October 29, it surged to 1398, then got slammed back to 1223 by the close.
On Friday, it tagged 1388 again and closed at 1323.
It failed to break through the upper end both times.
Now it’s at 1256.
I didn’t take the ETH trade; it never held above 2450.
BTC has barely moved over the past three days. The one that gave way was the hottest name.
I’m betting ZEC drops to 1150 before Wednesday.
If it gets back above 1320, I was wrong.
post-image
ETH-1.26%
BTC-0.67%
ZEC+1.16%
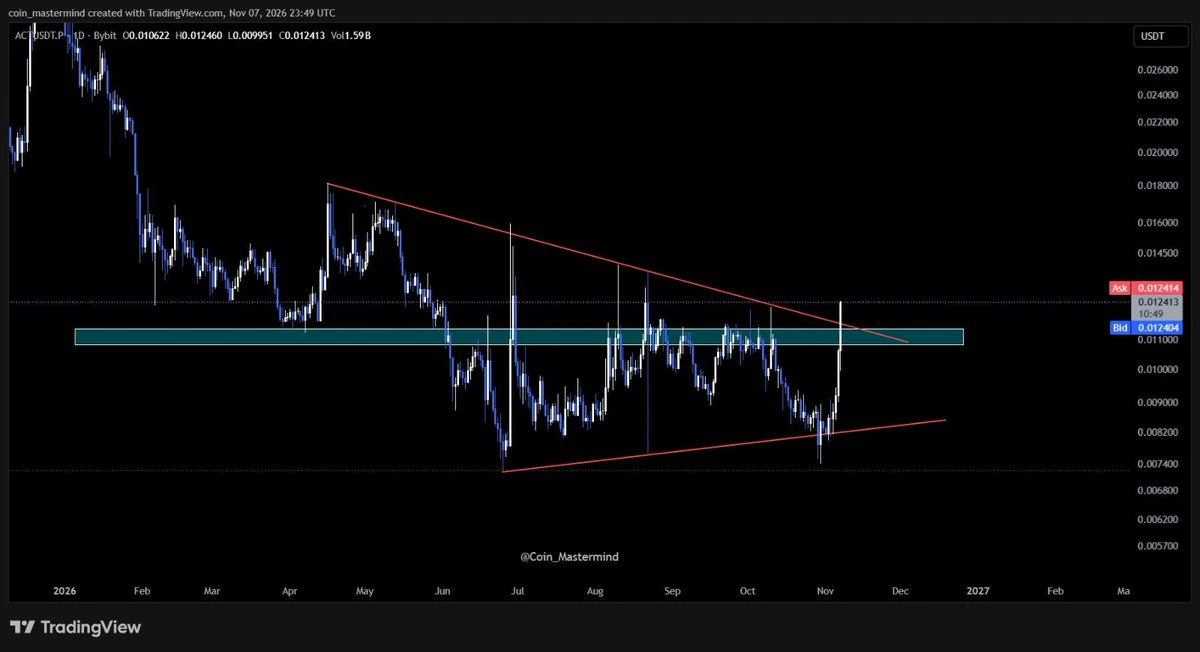
$ACT attempting a breakout! 🚀
📆 1D TF: Price is breaking out of a symmetrical triangle 🔺
Now watching for confirmation — a sustained breakout could open the door for further upside 📈
👀 Keep an eye on this setup!
#ACT #SymmetricalTriangle Not financial advice — DYOR!
post-image
ACT-1.19%
Is anyone really still selling
$GTC here? It feels like we’ve been watching this support line for a long time, waiting for a rebound that never seems to start. You’d think sellers should be running out of steam by now, but the chart is just stuck in this strange, quiet cycle.
Take profit: 0.16839 Stop loss: 0.15136 Market movers:
$SOL : Current price 89.37 - 24-hour change: -0.84%
$SWARMS : Current price 0.007535 - 24-hour change: +19.13%
post-image
GTC
GTC芝麻币
Gate.Fun
MC:$0.1Holders:1
0%
SOL-0.77%
SWARMS-3.61%
The nonfarm data was too strong! A December Fed rate hike—why is the market suddenly pricing in a 77.7% probability?

If we compare the Fed to someone controlling a faucet, rate cuts loosen the flow, while rate hikes tighten the faucet.
After the U.S. October nonfarm payrolls report was released, the market suddenly realized: the water may not be ready to flow more freely yet!
The number of jobs added this time reached 165k, far exceeding the market expectation of 65k. The unemployment rate fell to 4.1%, while average hourly earnings rose 0.4% month over month.
More notably, employment figures
AMD+11.55%
  • 28
OpenAI CFO: Data center investments will not change due to the midterm elections.
live-cover
LIVE18
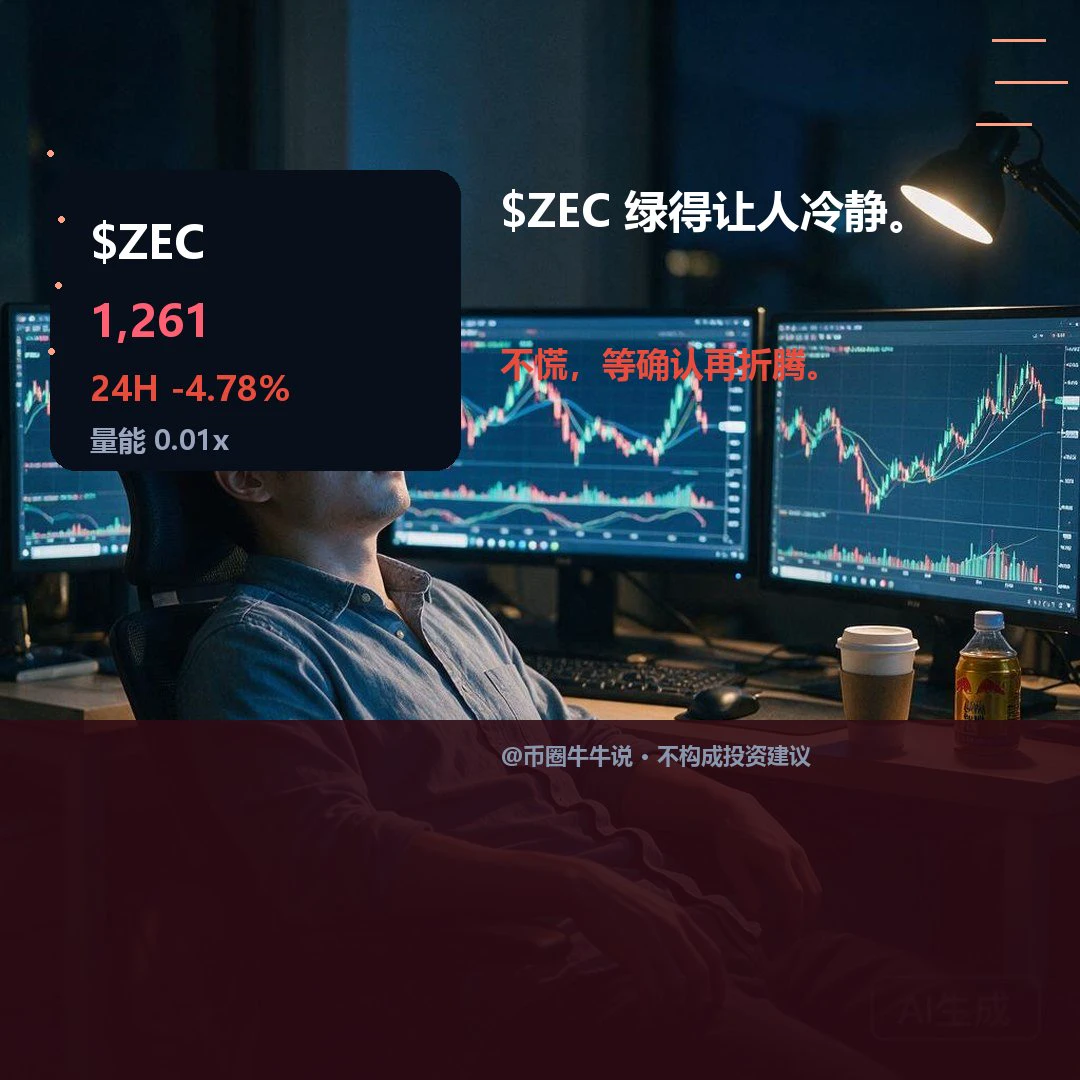
$ZEC Current price: 1260.54, 24H -4.78% (range: 1236.65–1364.08). 1H is weak, with RSI at 28.55, price below the EMA20 at 1277.27, and a volume ratio of 0.01; 4H is weak, with RSI at 52.36, price below the EMA20 at 1282.08, support at 1183.38, and resistance at 1387.89. A move higher requires holding above the 1364.08 resistance level; a break below the 1236.65 support level would weaken the structure. Review whether price holds above 1364.08 and whether it recovers after losing 1236.65; volume is only 0.01x. A hold without volume or a breakdown without a recovery would invalidate the setup. M
post-image
ZEC+1.16%
#StakeOnLaunchpoolToShare450KVLX
450,000 VLX is not just a reward pool; it is a strategic allocation signal for the next cycle of decentralized infrastructure.

The launch of the Stake On Launchpool campaign featuring 450,000 VLX represents more than a standard yield farming opportunity. It is a market-tested mechanism for distributing governance tokens to engaged users while simultaneously securing network participation. For serious participants, this event serves as a real-time indicator of project viability, community strength, and long-term tokenomics sustainability. Understanding the mec
post-image
VLX+0.00%
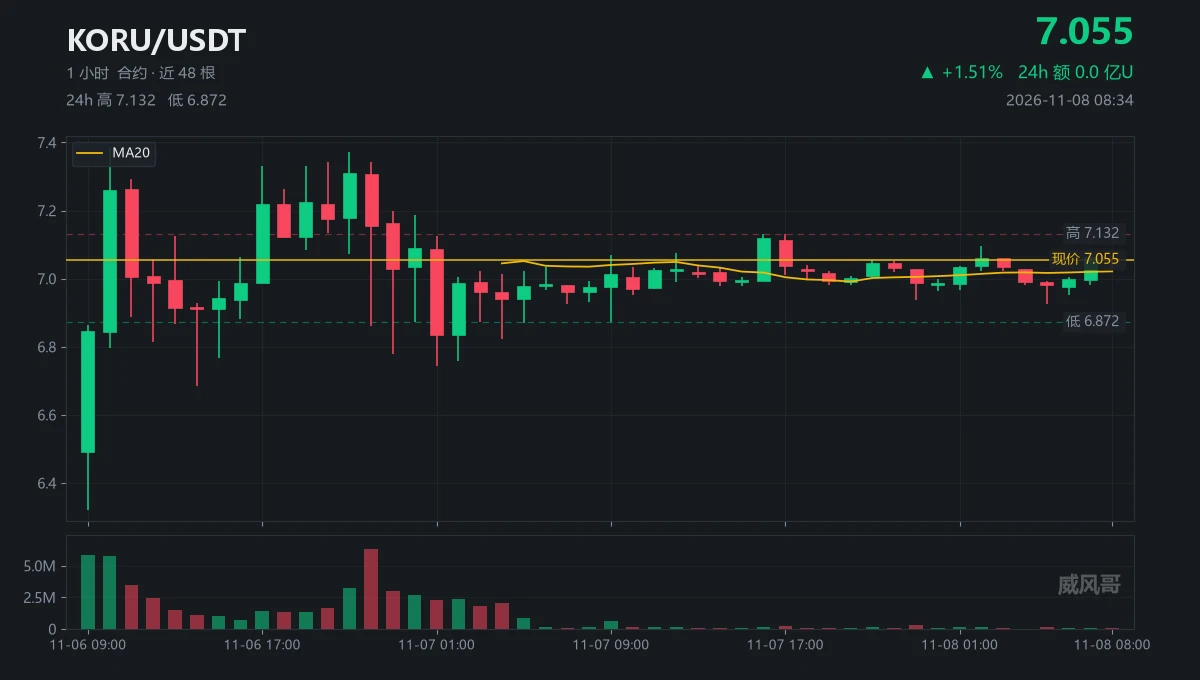
The best thing about this coin is that it can do in one hour what others take a week to do
But that hour was at 10:00 on 11-06, and it's already gone
6.321 to 7.387, up 16.9%; that's what 3x leverage feels like
But over the next 46 hours, it just wheezed sideways between 6.686 and 7.372
Now at 7.055, chasing a long with a stop at 6.93 means risking 0.125
Targeting 7.387 means a gain of 0.332; the 2.6-to-1 ratio looks pretty attractive on paper
The problem is that it has tested above 7.10 thirteen times and below 6.90 fifteen times
Twenty-eight boundary touches; at 0.1 per round trip, three tim
post-image
KORU-1.22%
The Fed’s December rate hike probability is nearing 80%! Are global stock markets facing another major test?

The U.S. labor market suddenly gained momentum, putting global investors on edge.
On November 6, the U.S. released October nonfarm payroll data, showing 165k jobs added, far exceeding market expectations of 65k. The unemployment rate fell to 4.1%, while average hourly earnings rose 0.4% month over month.
The data prompted markets to reassess the Fed’s policy path.
Currently, the market-implied probability of a 25-basis-point rate hike in December has risen to 77.7%.
Why are stock marke
  • 24
78% of accounts are long on $ETH . Consider shorting the 2235–2236 range. If this level holds, sellers may push the price toward 2230. A break above 2244 invalidates this view. Reasons: - At 2235, the trend structure still favors sellers, with the price below the EMA50. - The daily price is below the EMA200 at 2291, indicating the broader trend is down. - RSI is 45, indicating neutral momentum, with room for further weakness. Short 2235–2236 Take profit 2230 / 2227 / 2222 Stop loss 2244 Will sellers defend this level? Not investment advice · Do your own research
post-image
ETH-1.26%
$YB This -11.46% bearish candle has pinned the friends in my group who placed orders overnight at the 0.0571 peak. The current price is 0.0503, just one wick away from the 24h low of 0.0494. Trading volume of 5.8M is shrinking faster than weekend liquidity, and the order book is paper-thin; a single large order could easily smash through 0.049.
To be honest about the related market drivers: BTC is grinding sideways today in the wake of hawkish comments from Fed officials, and when Bitcoin doesn’t move, altcoins suffer. $YB’s pullback from 0.0571 coincided perfectly with BTC’s retreat after its
YB+2.91%
BTC-0.67%
Turned 100 into 500 in a week, Sharpe ratio of 24, zero drawdown, no oversized positions, and stop losses in place. Those of you following my trades, drop a hundred bucks to show some support. Value investing—next week will be another money-making market 🤩$XAUUSD
post-image
XAUUSD-0.45%
  • 6
This week, the cybersecurity company @wiz_io, which was just sold to Google for $32 billion, flew its entire workforce to Khao Lak near Phuket, Thailand, to celebrate with a party. The headline act was @katyperry—a private performance, featuring hit after hit, including “I Kissed a Girl.”
After videos from the event leaked on November 6 and went viral, a single post garnered nearly 250k views. The employee trip is estimated to have cost tens of millions of shekels, with Katy Perry’s performance fee alone running into the millions.
This wasn’t the first time Wiz did something like this: after r
post-image
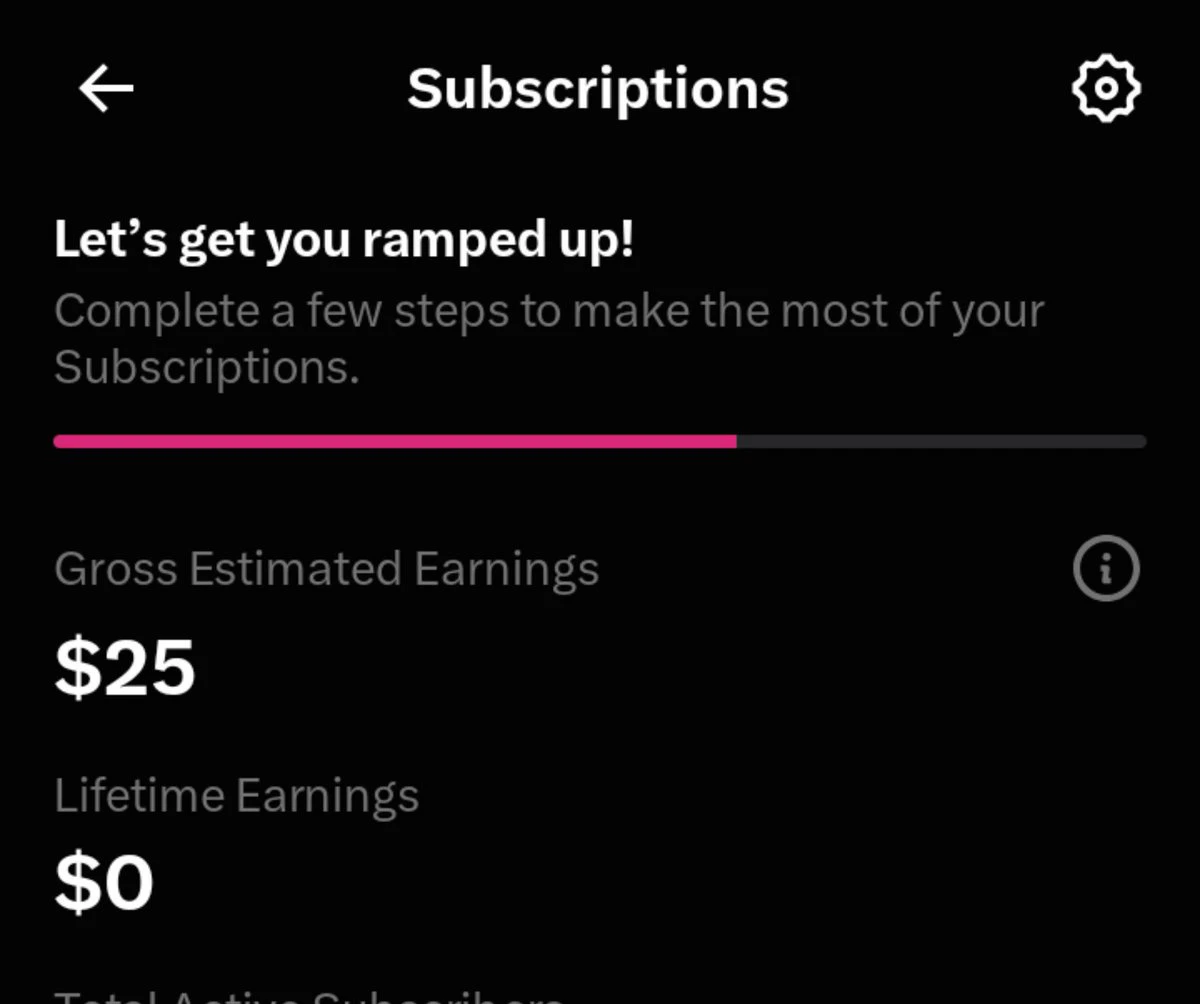
New Subscriber thanks for your support ♥️
Old Subcribers you have all made your money on mutiple project
post-image
U.S. Adds 165k Jobs! Markets Stunned: Weren’t We Told the Economy Was Supposed to Cool?

Wall Street may have really gotten it wrong this time!
The U.S. added 165k nonfarm jobs in October, while the market had expected just 65k. The actual figure beat expectations by a full 100k—a gap that’s about more than just hiring a few extra employees.
Even more interesting, job figures for the previous two months were revised up by 84k. In other words, not only did the U.S. labor market perform well this month, but past data also turned out better than initially reported.
The unemployment rate fell from
AMD+11.55%
  • 13
Load More

Join 40 M users in our growing community

⚡️ Join 40 M users in the crypto craze discussion

💬 Engage with your favorite top creators

👍 See what interests you

Trending Topics

USCPIDataIncoming

23.39k Views1.44k Discussing

The U.S. October CPI report will be released on November 10 at 8:30 a.m. ET. September CPI came in at 3.7% year over year, and markets will be watching closely for signs that inflation is cooling, especially in core CPI. A softer-than-expected reading could strengthen rate-cut expectations, while hotter inflation may pressure risk assets through higher Treasury yields and a stronger dollar. How do you think this CPI print will move $BTC, U.S. stocks and gold?

USAIStocksHitHard

22.67k Views3.69k Discussing

USNonfarmPayrolls

38.29k Views4.36k Discussing

View More