Share your thoughts
placeholder
Article
BNB rose 7.24 in 24 hours, breaking above 770 USDT
live-cover
LIVE1,877
No sense of scale, can’t hold on—the profits on this trade are paper-thin, but I’m absolutely loving it.
When the screen was glowing green, I set my sights on $WLD . The price repeatedly retested 0.3669 but managed to hold, and this kind of resilience in a weak market looked more like a signal light. While everyone else was running, I went long with a small position instead. Unexpectedly, the market really came through, climbing all the way to 0.4022, for a return of +681.22%.
Sideways movement at the bottom is an accumulation of strength, while holding firm after a retest shows confidence. Wea
post-image
WLD+0.55%
LAB-2.55%
SNDK+1.71%
$ZEC is making a serious move 👀
Zcash is up around 16% in 24H, pushing from the ~$1,030 area toward $1,180. The breakout came with strong momentum, but price is now consolidating near the highs.
The key level to watch is $1,180. A clean break and hold above it could open the door toward $1,210+.
If buyers lose momentum, the $1,120–$1,030 zone becomes important support.
For now, momentum is strong but chasing a vertical move is where traders usually get trapped. DYOR.
#Gate60MillionUsers
post-image
ZEC+17.31%
  • 6
  • 2
ZEC/USDT Trade Setup
Current: ~$1,190
Bias: Bullish
Entry: $1,175–$1,200
TP1: $1,300
TP2: $1,400
Final Target: $1,500
Stop Loss: $1,115
Key resistance: $1,220–$1,225
A clean breakout and hold above $1,225 could open the way toward $1,300 and potentially $1,500.
Chart-based setup, not financial advice. DYOR.
$ZEC #
post-image
ZEC+17.43%
  • 7
  • 2
$DOGE #DOGE
Broken Falling Wedge.
Successful retest could trigger a solid bullish wave during coming days✍️
DOGE+4.74%
#HYPE突破88美元创新高 #AIP
This bull market looks lively on the surface, but is fragmented underneath.
The AI narrative burned hot for three months, then gave way to a new batch of projects; RWA was talked up for half a year, yet not a single one has been implemented; BTC L2s have sprung up like mushrooms after rain, but the ones that truly work are still on the way. Retail investors chased the hotspots in a circle, only to look back at their accounts and find almost nothing left. It is not that they did not work hard—the hotspots moved too fast for retail investors to keep up.
Why? Because all hot
post-image
HYPE+3.59%
RWA+0.43%
BTC+0.44%
#美国8月非农超预期 #AIP
There is a rather interesting phenomenon in this market cycle: one hot trend after another emerges, but fewer and fewer retail investors are actually able to put profits in their pockets.
The AI narrative took off, people rushed in, and the project team unlocked tokens and dumped them three months later. RWA heated up, people chased it, only to find that liquidity was so thin that even entering and exiting was difficult. BTC L2 projects sprang up everywhere, yet 70–80% of them could not even run their testnets smoothly. It is not that retail investors are not trying hard enou
post-image
RWA+0.43%
BTC+0.44%
#XRP - ONLY HAMMERS 🔨:
This is the 2-Month Time Frame, serious HTF structure, where false signals become much less common.
Structure > Noise > Opinions.
📒I still believe a DOUBLE BOTTOM is coming, whether price gives us a HL or LL remains to be seen.
👉I won’t explain this chart too much.
Why?
👉Because after 57K+ posts, I want to see if you’ve learned how to read the structure yourself. 👀
👉Read the chart. Connect the dots.
ONLY FEW 🧠
ripple:native 🔥
post-image
XRP+1.10%
$PVP
PVP’s move this round clearly illustrates the characteristics of a “high-volatility small-cap.” Gate spot PVP/USDT was quoted at 0.032 USDT at 17:04, up 31.68% over 24 hours, with a range of 0.02187—0.04346 USDT; 24-hour trading volume was approximately 3,520 USDT, indicating thin market depth and greater price elasticity.
On the 1-hour candlestick chart, the price gradually stabilized after pulling back to around 0.02673 near 12:00. The 16:00 candlestick rose from 0.02778 and closed at 0.032, bringing the price back above 0.03 in the short term. The two upper wicks at 0.04346 and 0.0418
post-image
PVP+23.81%
Live trading - Analysis Crypto market
live-cover
LIVE2,725
#BTCReclaims80K
Bitcoin has once again captured the attention of the crypto market by reclaiming the important $80,000 psychological level. BTC recently pushed above $80K and reached the $82,000+ area, showing that buyers are becoming more aggressive after the previous period of weakness. However, the next challenge is whether Bitcoin can hold this breakout and turn $80,000 into strong support.
Current BTC Price Situation
At the latest market levels, Bitcoin is trading around the low-$80,000 region, after recently reaching approximately $82,000–$82,200. The move above $80,000 represents an im
BTC+0.44%
  • 5
burns over $5M worth of PAIR tokens, reinforcing its deflationary stance. Could signal tighter circulating supply; watchers may see this as a bullish tilt for PAIR. $PAIR
post-image
Everyone’s staring at LTC’s 54.12, but the real money is hiding below 53.07—are you early enough?

LTC/USDT - SHORT

Trade Plan:
Entry: 53.97 – 54.27
SL: 55.53
TP1: 53.07
TP2: 52.36
TP3: 51.31

Why this setup?
- 4h bias is SHORT with 55.4 confidence, and the 1D trend is stuck in a range—meaning no hero bounce is coming.
- RSI on 15m sits at 46.5, giving bears room to push before any oversold relief.
- ATR (1h) at 0.58 shows volatility is tight—so when TP1 (53.07) breaks, TP2 (52.36) can come fast.
- “Why now?” Because the entry zone (53.97–54.27) is holding as resistance, and the stop
LTC+2.59%
#ZEC What do you think after ZEC broke through $1,200?

First, the most compelling point in the bullish narrative: ZEC's all-time high was actually $5,941 in 2016—at the current $1,193, it is still about 80% below its ATH. Against the backdrop of continued ETF inflows, the market can fully tell the story that "a ten-year high is only the beginning, with a return to the ATH ahead." ZEC's ETF assets under management have surpassed $400 million, SMA-200 around $440 is providing strong trend support, and the daily structure remains healthy.

But in terms of pace, the risk is accumulating rather
ZEC+17.43%
  • 1
I’ve recently been researching AI Agent trading and happened to try @MossAI_Official myself.
I used to think of AI trading mostly as “AI helps you analyze, then you place the orders yourself.”
Moss feels somewhat different to me.
You don’t even need to know how to code first—you can directly describe your trading ideas in natural language.
For example:
Halve the position when ETH falls below a certain level, then add it back after reclaiming that level.
AI breaks this sentence down into specific trading logic and turns it into an Agent that can execute automatically 24/7.
After t
post-image
ETH+1.79%
$DASH 's long positions were fully liquidated, taking a considerable hit.
post-image
DASH+2.26%
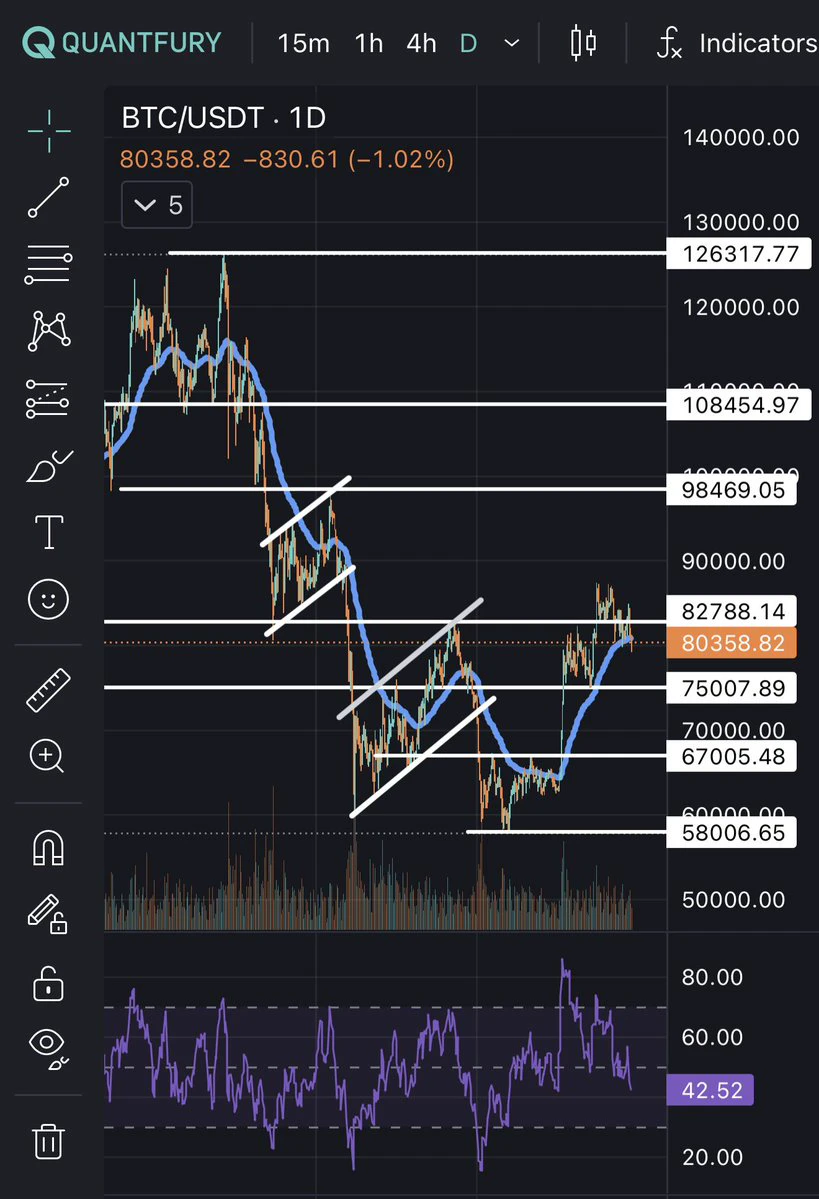
$BTC Bitcoin Weekly, Recovery Approaches a Key Resistance Zone
Bitcoin has recovered strongly from its recent weekly swing low, but the recovery is now approaching an important resistance zone at 82,850–83,929.
This zone combines the May swing high with the 38.2% Fibonacci retracement of the decline from 126,199.63 to 57,800.19. This confluence makes it an area to watch for confirmation, rather than assuming that the broader downtrend has already reversed.
A weekly close above 83,929, followed by sustained trading above the zone or a successful retest, would strengthen the recovery scenario. T
BTC+0.41%
Most traders still think SUI is bullish—here’s the quiet signal they’re ignoring.

$SUI /USDT - SHORT

Trade Plan:
Entry: 0.7899 – 0.7949
SL: 0.8163
TP1: 0.7744
TP2: 0.7625
TP3: 0.7445

Why this setup?
- 4H bias is SHORT at 0.7924, with RSI (15m) at 43.6—momentum is already rolling over.
- TP1 sits at 0.7744 (-2.3%), but the real meat is TP2 at 0.7625 (-3.8%) if range lows break.
- Stop at 0.8163 caps risk at ~3%, while the invalid line at 0.7723 confirms the short thesis is alive.
- Why now? The 1D is range-bound, and price is pressing the lower half—sellers get paid when range fades
SUI+1.46%
But there is one type of person I don't recommend chasing: those who only want to get in after seeing the price rise. Entering at this level leaves you without confidence, and you'll run at the first bout of volatility. Wait and see what the next structure brings. Managing risk in advance is called rationality; cutting after taking losses is called decisive self-amputation. There will be more opportunities ahead. Opportunities are waited for, not snatched.

$ADA $DOGE
post-image
ADA+2.72%
DOGE+4.59%
Everyone’s staring at DOGE’s 0.09087—but the real signal is the 4h timeframe that’s about to snap.

$DOGE /USDT - SHORT

Trade Plan:
Entry: 0.09059 – 0.09115
SL: 0.09351
TP1: 0.08889
TP2: 0.08756
TP3: 0.08558

Why this setup?
Why now? The 1D trend is *range*, not bullish—so any pop is a sell. RSI on 15m sits at 48.63, meaning no momentum to break higher. ATR on 1h (0.001102) shows tight coils—historically, that’s when shorts squeeze hardest. Entry at 0.09087 with a stop at 0.09351 gives you a 1:2.5 risk-to-reward to TP1 (0.08889). The alt setup is a trap—don’t chase 0.09285 when the daily i
post-image
DOGE+4.59%
Load More

Join 40 M users in our growing community

⚡️ Join 40 M users in the crypto craze discussion

💬 Engage with your favorite top creators

👍 See what interests you

View More