Share your thoughts
placeholder
Article
Crypto Signals and Trding Insights
live-cover
LIVE52
K-line pattern: The recent price rebounded sharply from the low of 62,508.3, reaching a high of 82,279.9, and currently stands at 79,874.2, consolidating at elevated levels. The latest candlestick has a relatively small body, with its upper shadow near the previous high, indicating selling pressure overhead.
· Technical indicators
· MACD: DIF (3,246.0) is below DEA (3,423.8), with a negative histogram value (-355.6). A death cross has formed, indicating weakening upward momentum and pullback pressure.
· KDJ: The K value is 87.3 and the D value is 86.9, both in the overbought zone (>80), in
AI
Which company has the best Code Arena WebDev AI model end of September?
OpenAI
82%1.21x
Anthropic
24%4.17x
$14.89K 24H+14 more
BTC+0.34%
ETH+1.40%
Everyone’s watching the range, but the real money is hiding in the 4h squeeze—$BTC /USDT is about to pick a side.

$BTC /USDT - SHORT

Trade Plan:
Entry: 79699.84 – 79817.26
SL: 80322.21
TP1: 79335.80
TP2: 79053.97
TP3: 78631.22

Why this setup?
Why short now? The 4h structure is armed with a 55% confidence SHORT, not a breakout.
- Price is pinned at 79,758, but the 1D trend is just a range—no bullish conviction.
- RSI on the 15m (47.61) is weak, not oversold, leaving room to drop.
- ATR (234) is tight—volatility is coiling, and TP1 at 79,335 is the first magnet.
This isn’t a chase;
BTC+0.34%
#Altcoins relative strength vs bitcoin:native is breaking out
What does this mean?
IYKYK
post-image
BTC+0.31%
  • 2
K-line: After a huge-volume long bearish candle on the 4-hour chart, the price consolidated at low levels, closing near the low, with bears in control; the daily chart shows a bearish candle with long upper and lower shadows, as bulls faced selling pressure.
· Indicators: The 4-hour MACD is about to form a death cross, RSI has fallen from overbought territory to below 50, EMA7 has crossed below EMA30, and the price has broken below EMA7/30, with the moving averages forming resistance.
· Volume: Volume has contracted significantly after the huge-volume decline, indicating insufficient buying, w
BTC+0.34%
ETH+1.40%
HK50+0.92%
Wait
What’s this
Who let the ___ out
@spark888 @惜风 @brocoliwang
I had just switched the app to the background when it suddenly popped back up—are you playing hide-and-seek with me? I wasn't expecting much from this move, but $ARB really knows how to surprise people.

Luckily, I hadn't canceled the order I placed before bed a few days ago, and it steadily caught the price around 0.10885. At the time, I saw it forming a bottom without breaking down, while funds were quietly flowing in, so I knew this level would most likely deliver an answer. Looking again today, the current price has already shot up to 0.1787, with a +3689.72% return sitting there—it compl
post-image
ARB+46.42%
ETH+1.40%
ADA+4.03%
$SUSHI Signal】Long pullback stabilizing + short squeeze setup
$SUSHI RSI 1H 73.35, 4H 71.86; the strong zones on both timeframes remain intact. The price fell from 0.2828 to the 0.2452-0.2556 range, with buying repeatedly absorbing the pullback and clear support orders around 0.2466 below.
🎯Direction: Long
⚡Entry/Limit order: 0.248353 - 0.249100
🛑Stop-loss: 0.246609
🚀Target 1: 0.252836
🚀Target 2: 0.254705
🛡️Trade management:
- Execution strategy: Reduce the position by 50% after reaching Target 1 and move the stop-loss up to breakeven. If the price falls back to the entry level, exit aut
post-image
SUSHI+32.20%
The short position from a few days ago was somewhat painful to hold. First, a wick spike swept upward, causing a small loss. Fortunately, the position was not large, so I did not stop out immediately. I only felt relieved after the price fell back below my entry cost. My reasoning for calling the high at the time was that a lot of trapped positions had accumulated around that level, while the bulls had made several attempts to break through without any obvious volume support. Personally, I felt the momentum for further upside was limited. The market did indeed pull back afterward, and the floa
post-image
LAB+1.71%
SNDK+1.83%
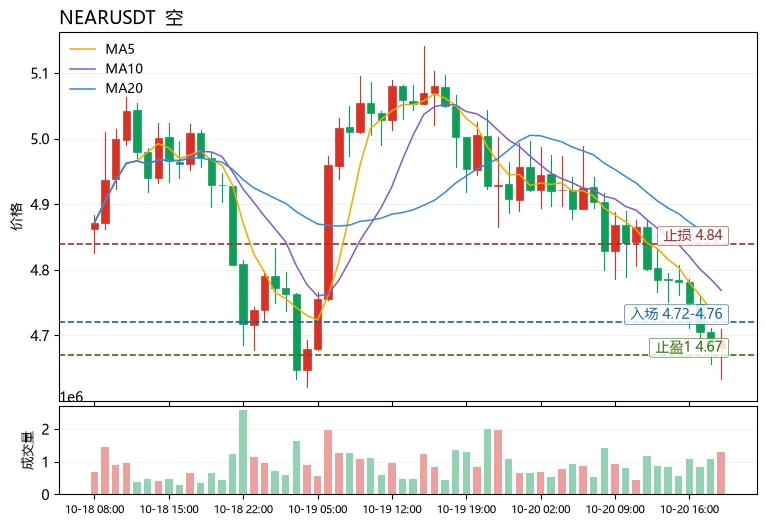
This time, what I think was most crucial in holding onto the $NEAR long was splitting the take-profit into several stages instead of waiting for one key level.
The entry price was around 1.8725. When it rose to the first target, I closed 30% first, instantly lowering the cost basis of the position. I set a protective stop for the remaining 70% and patiently waited for higher levels. Honestly, no one can guarantee selling at the key level. Locking in part of the profit and letting the remaining position continue to run actually makes it easier to hold the trade steadily.
There was one quick pul
post-image
NEAR-2.05%
ETH+1.40%
SOL+1.43%
#晒出我的合约收益 Last night, I kept a close eye on $BULLA on Gate and decisively opened a short position, fully capturing this pullback! Watching the market move steadily downward, I decisively took profits, and the gains were quite substantial. Futures trading requires speed, precision, and decisiveness—following the trend is the key. I’ll keep it up tonight!🚀 #BULLA #Gateio #加密货币
$BULLA $GT
post-image
BULLA+183.43%
GT+11.68%
$MEMECOIN Rumor has it that it will be listed on the spot market today! The 10,000x moonshot coin is counting on you!
post-image
MEMECOIN-6.95%
  • 1
$XMR
There is a structural scarcity on centralized exchanges, and that will amplify any real demand spike… if another wave of demand hits while CEX inventory stays low, the move will be strong. The remaining float is small and fragile, so volatility will stay high.
post-image
XMR0.00%
This return is making me feel anxious, afraid the market will catch on tomorrow and blacklist me. When it plunged intraday, $IN ’s rebounds grew weaker each time, with heavy resistance overhead. I opened a short position around 0.09355, set my protection, and watched the show.
Now at 0.03454, +3036.7% is sitting in my account. If you’re not confident in a token, taking a look keeps you clear-headed; buying a position makes you foolish. I took this move cleanly 🕶️.
Here’s the take-profit plan for everyone: bank 80% first, and move the stop-loss on the remaining 20% to the entry price. Let it r
post-image
IN+0.12%
ZEC+0.82%
SOL+1.43%
THIS IS INSANE. 🤯
$Nike is getting removed from the S&P 100. After nearly 18 years.
It joined the index in December 2008. It's leaving September 21.
$230 billion in market cap evaporated to get here. An 80% crash from peak. One of the most recognizable brands on the planet, quietly falling out of one of the most exclusive stock indexes in the world.
Here's the part that makes this worse than just a bad stock chart. When a company gets removed from an index like the S&P 100, every index fund tracking it is forced to sell automatically. Not because they want to. Because their mandate requires i
post-image
NKE-0.86%
SPX+1.63%
Waddle waddle 🐧
$QUOTRON coded
Everyone’s waiting for XLM to break out—but the 4H chart just whispered a dirty secret nobody’s pricing in.

$XLM /USDT - SHORT

Trade Plan:
Entry: 0.18434 – 0.18508
SL: 0.18823
TP1: 0.18207
TP2: 0.18031
TP3: 0.17767

Why this setup?
- XLM is stuck in a 1D range, and the 4H bias is SHORT with 55% confidence—not a screaming sell, but a “don’t get greedy” warning.
- RSI on 15m sits at 49.73—neutral, meaning no buying panic to save the dip.
- Entry at 0.18471 with TP1 at 0.18207 (1.4% drop) and TP2 at 0.18031—that’s your “why now?”: price is stalling under resistance while ATR (0.001466) s
XLM+3.27%
$TSLA #美国8月非农超预期
Tesla needs to be wary of further one-sided, straight-line declines next week.
Tesla’s daily-chart trend was broadly strong in August before pulling back in early September: Tesla experienced a significant rebound in August, followed by clear profit-taking around the first trading day of September, with its share price retreating from late-August highs to around $350.
The market is focused on the Cybercab commercialization event in early September. Some institutions chose to reduce their risk exposure ahead of the event, leading to a rapid pullback after the rebound.
In mid-t
TSLA-5.96%
market update
live-cover
LIVE1,427
Why the quiet RSI at 47 might be the loudest SHORT signal on $SNDK /USDT tonight.

$SNDK /USDT - SHORT

Trade Plan:
Entry: 1759.03 – 1763.69
SL: 1790.42
TP1: 1739.57
TP2: 1725.04
TP3: 1703.24

Why this setup?
The 4H timeframe is flashing a 77% confidence SHORT while the 1D trend sits in a range—not a breakout. Price is hovering at 1761.36, with immediate downside targets at 1739.57 (TP1) and 1725.04 (TP2).
- The 15m RSI at 47.54 shows no oversold bounce fuel, meaning sellers still control the micro-momentum.
- ATR of 9.31 on the 1H confirms enough volatility to travel 22 points to TP1 w
SNDK+1.83%
Load More

Join 40 M users in our growing community

⚡️ Join 40 M users in the crypto craze discussion

💬 Engage with your favorite top creators

👍 See what interests you

View More