


Share your thoughts
placeholder
Article
When this wick appeared, I didn’t rush to chase the short; I was waiting for a rebound to enter. $HYPE faced clear resistance near the previous high, so I placed staggered short orders. After the initial position was filled, the market didn’t weaken immediately but instead chopped around for a while.
My view at the time was that this was a false breakout. The liquidation zone above was too close, making it poor risk-reward to chase longs. After entering the short, I managed it with an 80/20 approach: took partial profits first, then moved the protection level on the remainder above breakeven,
post-image
HYPE-0.52%
ETH+2.50%
DOGE-0.06%
A few days ago, I was still thinking about how to exit with dignity. This morning, it sent me straight into profit.
When I opened the charts this morning, $WAL faced layer upon layer of resistance overhead. Every push was rejected, so I flagged a short at 0.02703: don’t bet on a breakout below a key level.
Now at 0.02603, with +178.16% secured, I can afford a good meal.
I’ve taken 80% off the table, with the remaining 20% protected at breakeven. I’m moving the stop-loss closer to the entry price. Don’t let profits inflate, and don’t despair over a pullback.
The prerequisite for compounding is
post-image
WAL+1.05%
BTC-0.04%
ZEC+2.30%
Insiders are quietly loading short positions on $XAU /USDT while the 1h price sits at 4358.21

$XAU /USDT - SHORT

Trade Plan:
Entry: 4353.25 – 4363.17
SL: 4405.82
TP1: 4322.50
TP2: 4298.70
TP3: 4262.99

Why this setup?
Why now? The daily trend is range-bound, which often precedes a sharp directional break, and the 1h ATR of 19.83796 confirms enough volatility to fuel a meaningful move. The 15m RSI at 47.88 shows the market is balanced, not overbought, so a short bias has room to breathe. The entry zone between 4353.25 and 4363.17 aligns with the 1h price of 4358.21, giving a precise refere
XAU+0.76%
DOGE on Solana traded $46 million in three days, yet the price barely moved: bullish catalyst fizzles
Ridiculous—$DOGE went live on Solana three days ago and traded $46 million, including over $8 million in the past 24h, yet the price only ground down from 0.08467 to 0.08415, down 0.61% since the event. Good news failed to lift it; I’m bearish and will treat rebounds as distribution.

One-line event summary—Solana-tokenized stocks hit a record $684 million, up 47% in three weeks; DOGE’s cross-chain volume is merely a splash in this on-chain wave. I buy the transmission story halfway, but gett
DOGE0.00%
I had just switched the app to the background, and it suddenly dropped—are you playing hide-and-seek with me? This morning, when I opened the chart, $TOSHI was clearly under pressure at the highs, with insufficient buying support; the overhead pressure was suffocating. I said then to stay bullish and look for shorts at high levels—the timing was spot-on.

Hold as long as the trend remains intact; run if it breaks down. Don't fall in love with a stock.

From 0.0001166 to 0.0001131, the short position wasn't held in vain: +144.55%. That feels amazing. It dragged its feet at first, but the mov
post-image
TOSHI+0.18%
ETH+2.50%
XRP+0.06%
🐋 WHALE WATCH : Looking at the current BTC sentiment I find it more noteworthy than scary.
Bearish + Very Bearish is taking up as much as 51% while Bullish + Very Bullish is only 28%. Neutral is 22%.
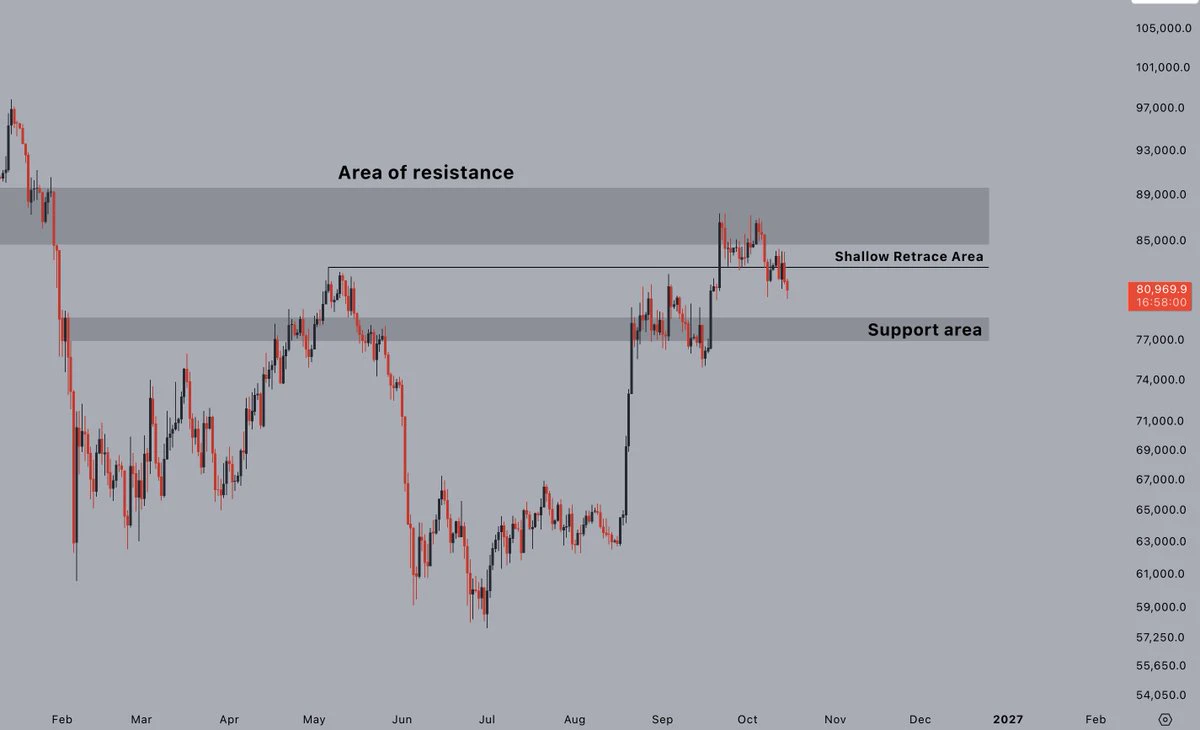
Personally I usually don't like FOMO when the majority is overly optimistic. On the contrary when sentiment tilts strongly toward pessimism like this I start paying more attention.
Of course bad sentiment doesnt mean BTC will bounce right away. But the market often has a familiar trick: when the majority has mentally prepared for a downside scenario the price chooses to make things difficult for
post-image
BTC-0.02%
Nobody is talking about the quiet move forming in WLD right now.

$WLD /USDT - SHORT

Trade Plan:
Entry: 0.3960 – 0.4004
SL: 0.4194
TP1: 0.3823
TP2: 0.3717
TP3: 0.3558

Why this setup?
Why now? The 1h price is sitting at 0.3982, which is the exact entry_ref for this short setup. The 1h ATR of 0.008835 tells us a single candle can cover over 2%, so a break of structure happens fast. The 15m RSI at 42.56 confirms the short-term momentum is already weakening without being oversold. With the daily trend in range and the entry zone between 0.3960 and 0.4004, the risk is tight but the targets are
WLD-1.21%
I wasn’t watching the market or using my brain—it was jumping around on its own, like it was working overtime for me.

During the repeated intraday fluctuations, $SKYAI I pointed out around 0.06198 that buying support was insufficient, and any move up would just be handing tokens to others.

It really did come down afterward. It’s at 0.05205 now, +392.47%. Feels good.

First close 80%; protect the remaining position at the cost basis, currently +392.20%. If it keeps dropping, let the profits run; even if it rebounds, don’t give the profits back.

The market is waited out, and profits are
post-image
SKYAI-0.31%
SOL+2.05%
BNB+1.19%
NEAR is about to expose the biggest trap in crypto right now

$NEAR /USDT - LONG

Trade Plan:
Entry: 2.3970 – 2.4340
SL: 2.2380
TP1: 2.5487
TP2: 2.6374
TP3: 2.7706

Why this setup?
Why now? The daily trend is firmly bullish, setting the stage for a decisive move higher. The 1h ATR of 0.073973 shows this pair is in an active volatility phase, meaning the next leg is likely explosive. The 15m RSI at 29.73 signals deep oversold conditions that often precede sharp reversals. With the entry zone anchored at 2.4155 and targets at 2.5487 and 2.6374, the setup offers a high-reward profile for patie
NEAR-4.31%
$MET Signal】Long | Buy the 1H pullback, target the 4H upper band
$MET 4H Bollinger upper band resistance at 0.2738, 1H RSI 65.20, order book depth imbalance -8.32%.
Current price 0.2687 is near-term support, 4H MACD red bars narrowing, 1H MACD also contracting. Bid/Ask 0.85, with sell orders slightly heavier. The risk/reward for this pending order is acceptable, but there is limited room to chase at the current price.
🎯Direction: Long
⚡Entry/Pending order: 0.267894 - 0.268700
🛑Stop-loss: 0.266013
🚀Target 1: 0.272730
🚀Target 2: 0.274746
🛡️Trade management:
- Execution strategy: After reac
post-image
MET+10.70%
I originally wanted to cut my losses and sacrifice to the heavens, but the ritual never happened—the meat cooked itself.
A few days ago, $RE was still bottoming out in the afternoon. I kept watching RE’s order book, and that pullback held without breaking down. The bids underneath were solid, so there was no need to overthink it—just sit tight. I only gave one hint at the time: if it can’t fall any further, that’s the best signal.
The market eventually gave the answer. Entered at 0.40266, now at 0.4461, with paper gains of +211.4%. The earlier stagnation made me want to close the app, but onc
post-image
RE+3.12%
SNDK-3.45%
ZEC+2.30%
Insiders are already positioned for a brutal SUIDEATH.

$SUI /USDT - SHORT

Trade Plan:
Entry: 0.7206 – 0.7270
SL: 0.7545
TP1: 0.7008
TP2: 0.6854
TP3: 0.6624

Why this setup?
Why now? The daily trend is bearish, the 1h price sits at 0.7239, the 15m RSI reads 43.59 and the 1h ATR is 0.012785, which together confirm a short setup with room to run. The entry zone of 0.7206 to 0.7270 gives a precise fill, while TP1 at 0.7008 and TP2 at 0.6854 define the first two targets. The invalidation level at 0.7829 acts as the line in the sand that must hold for this trade to remain valid. Missing this in
SUI-2.14%
Dim777 & BTC & LTC & GT
👜European banking giant UniCredit is preparing to enter crypto — the bank is selecting infrastructure for the custody and trading of digital assets
Stablecoins and tokenized bonds are also in the plans, but the project is still at an early stage.
post-image
Dim777
Dim777Dimzon777
Gate.Fun
MC:$70.49KHolders:8
100%
BTC-0.02%
LTC+1.33%
GT-0.10%
This profit is making me feel uneasy, worried that the market will catch on tomorrow and blacklist me.
Just when I thought this move was completely over, I went back and took another look at $EVAA ’s chart. Each rebound was weaker than the last, and volume failed to follow, showing clear lack of support. I placed the short at 0.8304. My thinking at the time was simple: if no one is buying up there, then it goes down.
+373.48% quietly landed in my account just like that. Getting the timing right feels better than anything.
The prerequisite for compounding is staying alive; the shortcut to getti
post-image
EVAA+6.20%
LAB+79.33%
ETH+2.50%
During the early session, the price pulled back to around 0.15105 and stabilized, so I went long directly. The plan is simple: as long as the hourly candle body does not break down, the upside target is the high-volume trading zone, with the stop-loss placed simultaneously.

After entering, the price consolidated for a short while, with one wick in between, but I left the position untouched. Once the hourly candle closed bullish again and volume pushed the price upward, I took 70% off at the first target and moved the stop-loss on the remaining position directly above breakeven.

The subsequ
post-image
ZEC+2.30%
BTC-0.04%
#SenateReleasesNewCLARITYAct
The CLARITY Act Has Reached a Make-or-Break Moment
The U.S. crypto market is heading toward another major regulatory test.
The latest development around the CLARITY Act is especially important because the Senate is preparing for a procedural vote on September 15. This does not mean the legislation is about to become law, but it could provide an important signal about whether there is enough support to move the bill forward.
For me, the bigger story is not simply the vote itself.
It is what the CLARITY Act could mean for the long-term relationship between crypto, r
today live markets informations
live-cover
LIVE460
Layout for Bitcoin, Ethereum, and Dogecoin
live-cover
LIVE1,721
Everyone watching the daily trend bullish, but SYMBOL is screaming something else right now.

$BTC /USDT - LONG

Trade Plan:
Entry: 77143.14 – 77474.72
SL: 75717.33
TP1: 78502.63
TP2: 79298.43
TP3: 80492.13

Why this setup?
Why now? The daily trend is firmly bullish, yet the 1h ATR of 663.165879 shows explosive volatility that can swallow a weak long instantly. The 15m RSI sitting at 46.89 means SYMBOL is neutral-to-slightly-bearish on the micro timeframe, creating a pullback entry zone around 77308.93. This is not a random dip; it is a calculated retracement within a 95% confidence LONG se
BTC-0.04%
#每周来晒 #8月CPI数据出炉
August CPI Is Not a Green Light — It Is a Market Test
The August CPI report has arrived, and in my view, the most important part is not whether inflation “beat” or “missed” expectations. The real question is how markets interpret the combination of slowing annual core inflation, stronger monthly price pressure, elevated Treasury yields, and the Federal Reserve’s increasingly difficult policy decision.
Headline CPI increased 0.4% month over month, accelerating significantly from July’s 0.1%. On an annual basis, CPI remained at 3.4%, exactly matching expectations. Core CPI, whi
Load More

Join 40 M users in our growing community

⚡️ Join 40 M users in the crypto craze discussion

💬 Engage with your favorite top creators

👍 See what interests you

View More