Square
Following
Hot
News
Profile
Share your thoughts
placeholder
Article
US oil is pumping
And you still believe in the BTC pump?
BTC+0.59%
Why is big money watching the PPI rather than the CPI?
CPI is a statement of fact (what people have already overpaid for in stores). PPI is a look into the future (what costs businesses are bearing now). If raw materials and production become more expensive, producers will inevitably pass these costs on to end consumers within 1–2 months.
Conclusion: High PPI today guarantees high CPI tomorrow. Major players reduce risks based specifically on PPI, without waiting for consumer reports.
#USCPISoon #ShareWeekly
$NEAR PROTOCOL (NEAR) REJECTING MOVING AVERAGE RESISTANCE ARE BEARS TARGETING $4.5221 NEXT?
Pair: $NEAR /USDT
Direction: SHORT
Entry Price: 5.3804
Target Levels (Take Profit)
TP 1: 5.0585 5.98%
TP 2: 4.844 9.97%
TP 3: 4.5221 15.95%
Stop Loss
🛑 SL: 5.8095
Technical Breakdown
NEAR ($5.3802) faced strong rejection following an aggressive parabolic spike, printing a topping wick that stalled out right at structural resistance. This price action confirms persistent seller defense and sets up a clean continuation toward lower targets.
Price action tested areas above short-term moving ave
NEAR+11.78%
$LYN
📉 Open interest has fallen flatter than my wallet, I'm dying laughing😂 This wave of bearish pressure is enough to crush a camel, but I refuse to believe it and will tough it out to the end💪 LYN's price action is just like an overworked employee who stays up late working overtime but still can't get a raise—frustrated but stubborn😤 Patiently wait for the wind to come; it should be about time for a rebound, so don't rush to admit defeat😌
post-image
LYN-4.95%
$ICNT
UPDATE
#ICNT is getting a good volume here. In this move we can see 80%+ gain here ✍🏻
#ICNTUSDT #ICNTBTC #BTC #Bitcoin #NFTs
post-image
ICNT+20.93%
BTC+0.59%
ETH is currently around 2,450, maintaining an overall weak recovery. This rebound is merely a technical bounce after the decline, not a reversal, and the bearish structure remains intact.

On the 4-hour chart, the price is pressured by the moving averages, rebound volume is insufficient, the Bollinger Bands remain in a downward trend, and overhead resistance is dense. This rise is merely a corrective move within the downtrend, with limited upside and relatively high pullback risk.

On the 1-hour chart, short-term fluctuations are showing a mild recovery, but bullish momentum is lacking. This
post-image
ETH+1.47%
Market update
live-cover
LIVE220
Too $ETH 'ZEY! 😂
Nothing easy. This has taken a tremendous amount of work.
Especially when you're not working with the full picture.
NFA, DYOR ⚠️
#Crypto #Trading #ETH
ETH+1.39%
This was 2 SOL, was it worth it?
SOL+1.70%
✨ US Data Update: What Today's Numbers Signal for Markets
🔹 A dense set of US economic data released today painted a picture of an economy that remains resilient, but with inflation pressures proving more persistent than expected. The combination of hot inflation, strong consumer spending, and a tight labor market is reshaping rate expectations.
📊 The data on the table:
🔹 PPI (Producer Price Index): September PPI rose 1.3% MoM and 6.3% YoY, far exceeding the 0.5% and 5.3% forecasts. This is the largest monthly increase since March 2022. Core PPI, excluding food and energy, rose 0.7% MoM and
post-image
User_any
#美国9月PPI大超预期 ✨ US PPI Inflation Surges to 6.3%, the Highest Since Late 2022
🔹 The US September Producer Price Index (PPI) rose 1.3% month-over-month and 6.3% year-over-year, significantly exceeding the consensus estimate of 5.3%. This marks the largest monthly increase since March 2022 and the highest annual reading since December 2022.
📊 The data behind the print:
🔹 Core PPI: Excluding food and energy, core PPI rose 0.7% MoM and 5.0% YoY, both above expectations.
▪️ Energy: Energy prices surged 10.8%, accounting for more than 80% of the broad-based increase in goods prices. Gasoline jumped 20.3%.
▪️ Context: The reading follows Wednesday's CPI report, which also came in above forecasts at 3.7% YoY headline and 2.6% core. Retail sales for September rose 0.8% MoM, beating the 0.3% estimate.
⚖️ Market impact:
🔹 Bitcoin: Briefly fell below $80,000 to $79,800 before rebounding to near $82,000. Market-wide liquidations reached approximately $930 million over 24 hours, with long positions accounting for $780 million. The $80,000–$81,500 zone remains a critical support area, overlapping with the estimated ETF cost basis.
▪️ US Equities:The S&P 500 and Nasdaq 100 traded mixed, with tech and semiconductor names under pressure. The Philadelphia Semiconductor Index fell over 4% in the prior session. Cyclical sectors and the Dow Jones outperformed as investors rotated toward defensive positioning.
▪️ Treasuries & Dollar: The 10-year Treasury yield dipped to approximately 5.04% from 5.10%, as safe-haven demand for bonds offset the inflation surprise. The dollar index retreated from its 18-month high toward 102.0.
▪️ Gold & Silver:Spot gold recovered above $4,150, up over 1%, while silver rebounded above $56.9 per ounce, gaining more than 2.4%. The recovery was driven by falling yields, a softer dollar, and renewed safe-haven demand.
⚖️ Structural perspective:
🔹 The PPI acceleration broadens the inflation narrative beyond consumer-level price pressures. With producer costs rising across energy, transportation, and services, the data reinforces the case for the Federal Reserve to maintain a restrictive stance. Markets now price roughly a 29% probability of a rate hike at the October 27-28 meeting, with December tightening expectations remaining elevated.
▪️ For risk assets like Bitcoin, the primary pressure channel is the rate outlook: higher-for-longer borrowing costs reduce the relative appeal of non-yielding assets. Gold and silver, however, face a more layered dynamic, balancing safe-haven demand against real-rate headwinds.
▪️ The key variable ahead is whether the Fed signals patience at the October meeting or adopts a firmer tone. Until that guidance arrives, markets are likely to remain in a recalibration phase, with capital rotating selectively between growth, defensive, and hard-asset exposure.
🔹 How are you assessing the market's response to two consecutive inflation surprises? 👇
#PPI #Inflation #Bitcoin #Gold
Not financial advice.
repost-content-media
BTC+0.59%
US500+0.28%
NAS100-0.08%
  • 1
  • 1
Trade live on $POL
.Entry Price: 0.09446 - 0.09493Take Profit 1: 0.09928Take Profit 2: 0.10295Stop Loss: 0.09163POL bouncing off local MA support—ready to retest that 0.097 high!Support the idea here.Watching both $SIREN and $BTC this session.
post-image
BTC+0.59%
first day calling on @Pumpfun
bullish tek!
post-image
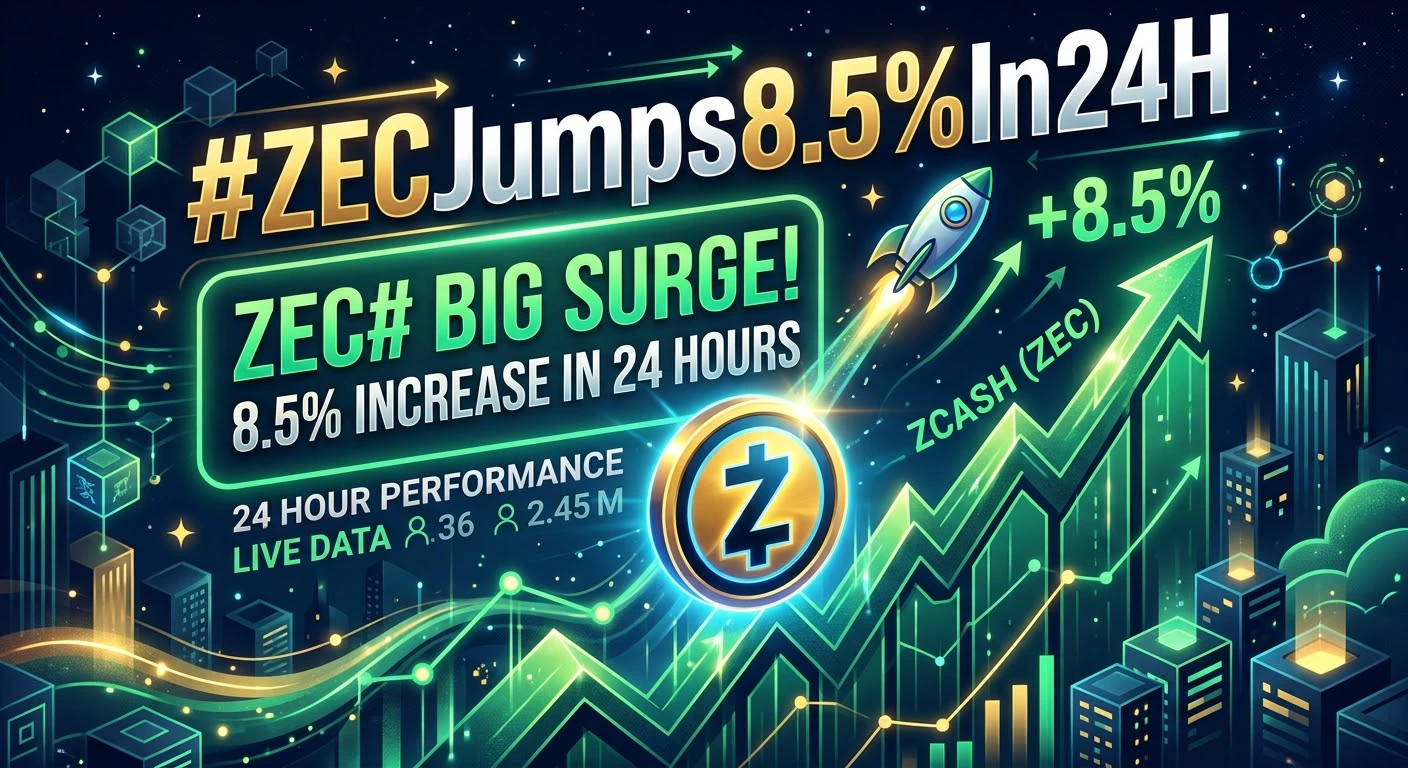
$ZEC Preparing to short, stop-loss at 1280-1300
post-image
ZEC+7.84%
  • 4
✨ Markets remain tense as a pivotal week continues, with Fed Chair Warsh set to speak before the central bank's pre-meeting blackout period.
🔹 Today's data confirmed that inflation pressures are broadening, while consumer demand remains resilient. Fed Chair Kevin Warsh is scheduled to speak at the IMF annual meeting in Bangkok on Friday, offering a final policy signal before the October 27-28 FOMC meeting.
📊 The data on the table:
🔹 PPI: September rose 1.3% MoM (forecast: 0.6%) and 6.3% YoY (forecast: 5.3%). Core PPI rose 0.7% MoM (forecast: 0.3%).
▪️ Retail Sales: September rose 0.8% MoM (
post-image
BTC+0.59%
GT-0.09%
XAUUSD+1.58%
MU+1.93%
NVDA-1.92%
  • 2
  • 2
BTC UPDATE
live-cover
LIVE81
As Bitcoin attempts to hold its ground at the $82,400 level, the market is simultaneously navigating a heavy flow of macroeconomic data. Over the past 24 hours, the price dipped to as low as $79,795 before recovering to test the $82,630 mark. This movement cannot be attributed to a single factor; rather, several distinct pressures have come into play at once.
PPI surprise and interest rate expectations
The Producer Price Index (PPI) data released in the U.S. for September came in significantly higher than anticipated. On an annual basis, the PPI rose by 6.3%, reaching its highest level in four
post-image
BTC+0.59%
GT-0.09%
ETH+1.39%
SOL+1.70%
XRP+1.32%
  • 4
  • 2
$ETH Long Catches a Fresh Flush Partial Bounce, No Momentum Confirmation
Pair: $ETH /USDT
Direction: LONG
Entry Zone: 2364.29
Take Profit:
- TP1: 2423.13 +2.5%
- TP2: 2462.36 +4.1%
- TP3: 2521.20 +6.6%
Stop Loss: 2285.83
Chart Structure:
- ETH declined steadily from ~2480 through MA7, MA25, and MA99, then printed a sharp flush candle down to ~2285-2300 before bouncing to current price
- Price remains well below all three moving averages this is a bounce attempt within an intact downtrend, not a reclaim
- RSI(14) dropped to ~25 at the flush low and has only partially recovered to the high-
ETH+1.47%
  • 2
Everyone, listen‼️ Quickly open a second long position on $ETH
now.entry: $2,451 – $2,455targets: $2,465 / $2,480 / $2,500sl: $2,418
post-image
ETH+1.47%
SANDISK $SNDK REJECTING MOVING AVERAGE RESISTANCE ARE BEARS TARGETING $1,272.23 NEXT?
Trade Parameters

Pair: $SNDK /USDT
Direction: SHORT
Entry Price: 1,347.86
Target Levels (Take Profit)
🎯 TP 1: 1,302.48 3.37%
🎯 TP 2: 1,272.23 5.61%
Stop Loss
SL: 1,408.36
Technical Breakdown
SNDK ($1,348.19) faced strong rejection following an aggressive upward push, printing a topping wick that stalled out right at structural resistance. This price action confirms persistent seller defense and sets up a clean continuation toward lower targets.
Price action tested areas above short-term moving ave
SNDK-0.01%
The second target has been reached at 0.03300. Keep your eyes on it and secure your profits. Congratulations! 🎉🤑💰👇$AKE
post-image
AKE+17.90%
Load More

Join 40 M users in our growing community

⚡️ Join 40 M users in the crypto craze discussion

💬 Engage with your favorite top creators

👍 See what interests you

Trending Topics

USSeptemberPPIBeatsExpectations

91.35k Views1.87k Discussing

US September PPI came in at 6.3% YoY, well above the 5.3% market expectation, pointing to renewed producer-side inflation pressure. Weekly jobless claims were 199K, broadly in line with forecasts. Could hotter inflation further reduce room for rate cuts, and what does it mean for $BTC, US stocks, and gold?

DrLinHanSpeaksAtOxfordUnion

135.63k Views1.86k Discussing

JapanAndKoreaStocksPlunge

47.27k Views1.76k Discussing

View More