Square
Following
Hot
News
Notifications
Profile
Share your thoughts
placeholder
Article
Sudden flash crash before BTC’s weekly close! A wick down to $73,510, with $715 million in long
live-cover
LIVE2,090
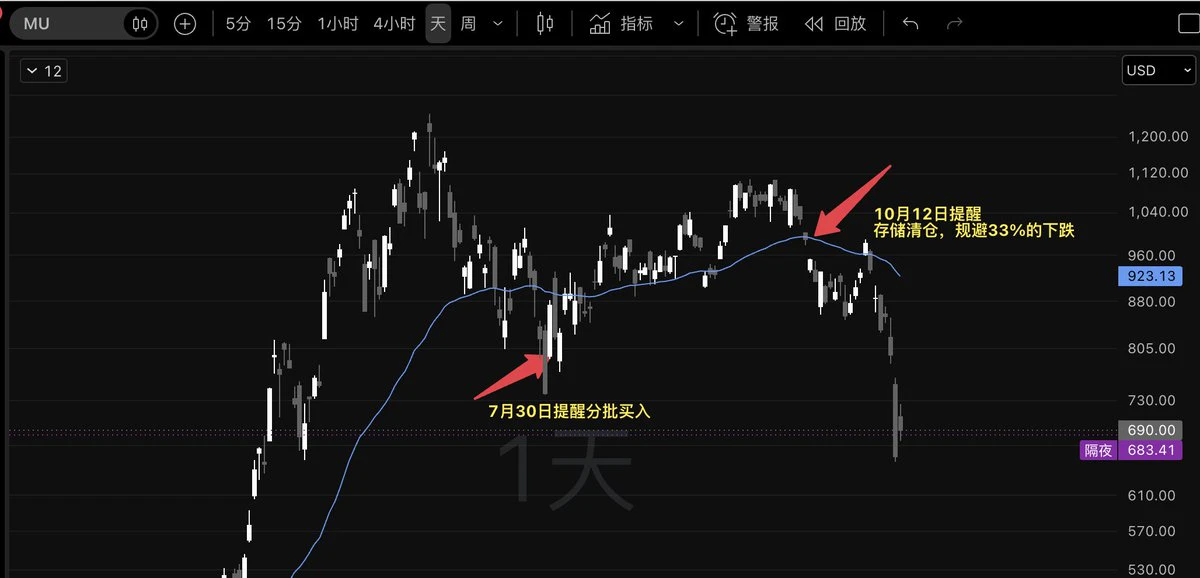
The storage sector is absolutely brutal...
You can still participate in the hype,
but only during the first cool-off after it boils over
After the second rally, the odds of success drop sharply if you join during the subsequent cool-off #交易思考
post-image
Trenches
牛逼
牛
bade
b
牛逼
0x96...7777
Market Cap
$.
Change
.
24h Vol
$.
Holders
.
ZIG
Z
bade
b
ZIG
0x8c...1145
Market Cap
$.
Change
.
24h Vol
$.
Holders
.
BTC
B
bade
b
BTC
C5xp...pump
Market Cap
$.
Change
.
24h Vol
$.
Holders
.
STONK
S
bade
b
STONK
6GmA...UNgx
Market Cap
$.
Change
.
24h Vol
$.
Holders
.
fxUSD
f
bade
b
fxUSD
0x08...d8f6
Market Cap
$.
Change
.
24h Vol
$.
Holders
.
#USCPIDataIncoming
#美国10月CPI即将公布 #每周来晒
: Why the Upcoming US Inflation Report Could Shape the Future of Crypto Markets
The financial world is closely watching the upcoming US Consumer Price Index (CPI) report, as this important economic indicator could have a significant impact on global financial markets, investor sentiment, and cryptocurrency prices. Inflation remains one of the most important factors influencing the Federal Reserve's monetary policy, making the upcoming CPI data particularly important for traders and long-term investors.

The Consumer Price Index measures changes in the p
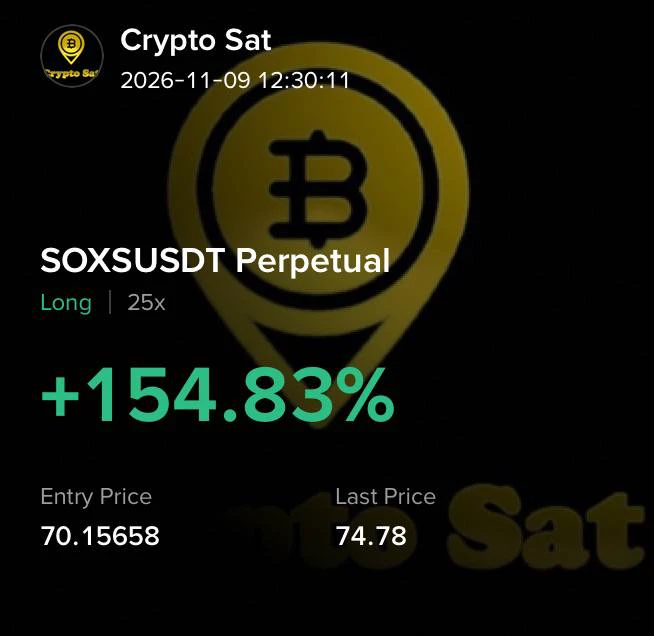
$SOXS 66% of position closed 👍

Remaining position at 200% ROI 🔥
post-image
CryptoSat
Open $SOXS LONG
Using 4% Fund , entry at 70-69
Sl at 68
ROI Targets - 100% , 150% , 200%
SOXS+1.46%
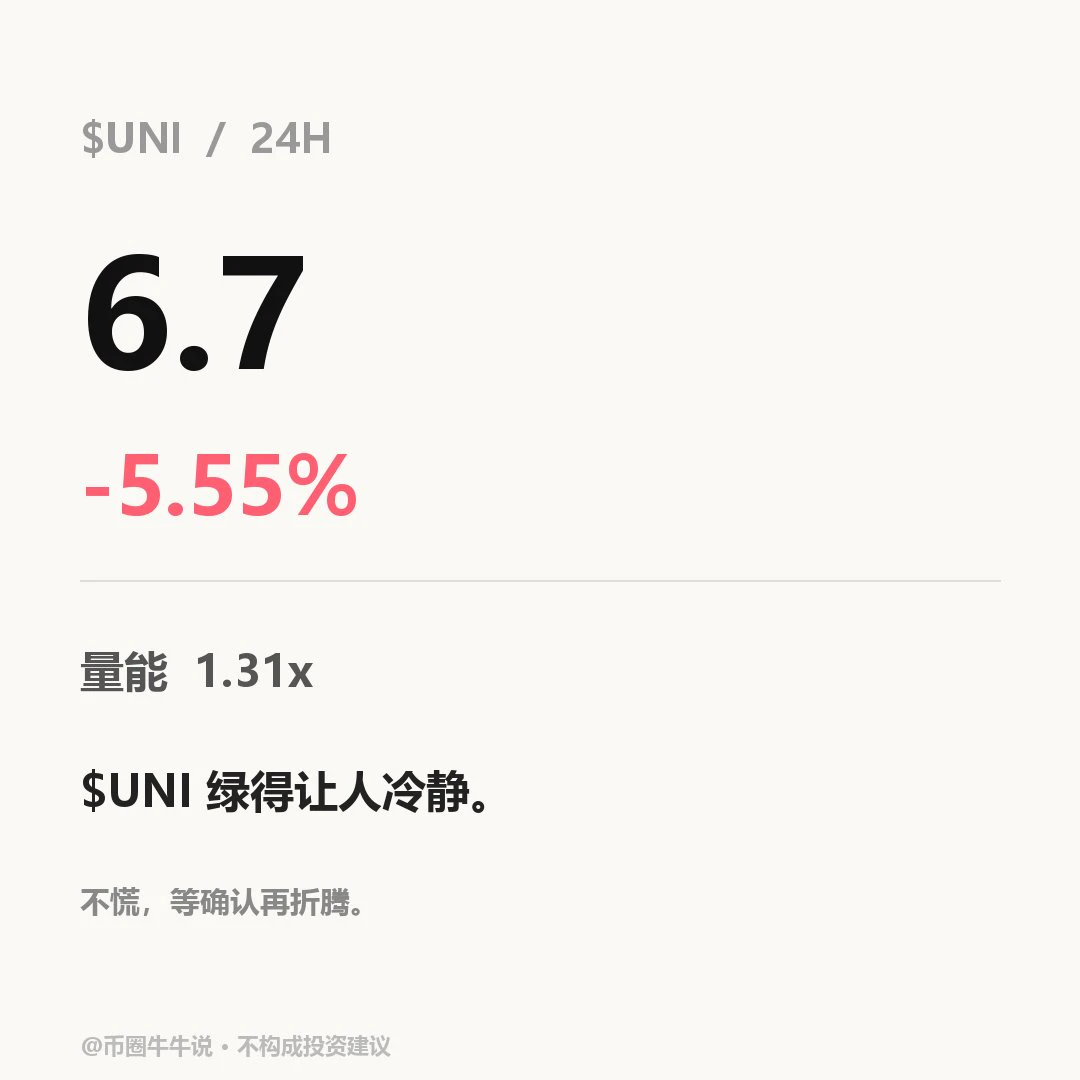
$UNI Currently at 6.702, down 5.55% over 24H. 1H is weak: RSI 34.5, EMA20 6.90, resistance 7.103, support 6.625; 4H is weak: RSI 42.2, EMA20 7.01, resistance 7.659, support 6.587. Volume is 1.31x. For an upside move, price needs to hold above the 7.103 resistance; a break below the 6.625 support would weaken the structure. Next, watch whether 7.103 holds and whether price can reclaim 6.625 after losing it; a break below 6.625 without a reclaim invalidates the setup. The market is volatile; for observation only.
post-image
UNI+3.05%
What Is the Sortino Ratio? Why Can Focusing Only on Volatility Misjudge a Trading Strategy?

In cryptocurrency trading, two strategies with similar returns can offer very different risk experiences. One strategy may often suffer sharp declines, while another may mostly see upward fluctuations. Measuring risk only with standard volatility can overlook this difference. The Sortino Ratio is a metric that can help provide a more complete analysis.

First, what is the Sortino Ratio?

The Sortino Ratio measures returns above a target return relative to downside risk. It is similar to the Sharpe Rati
post-image
Bro, this guy’s got a pretty well-rounded skill set.
I didn’t agree with letting talent like this enter the market in the first place.🙈
post-image
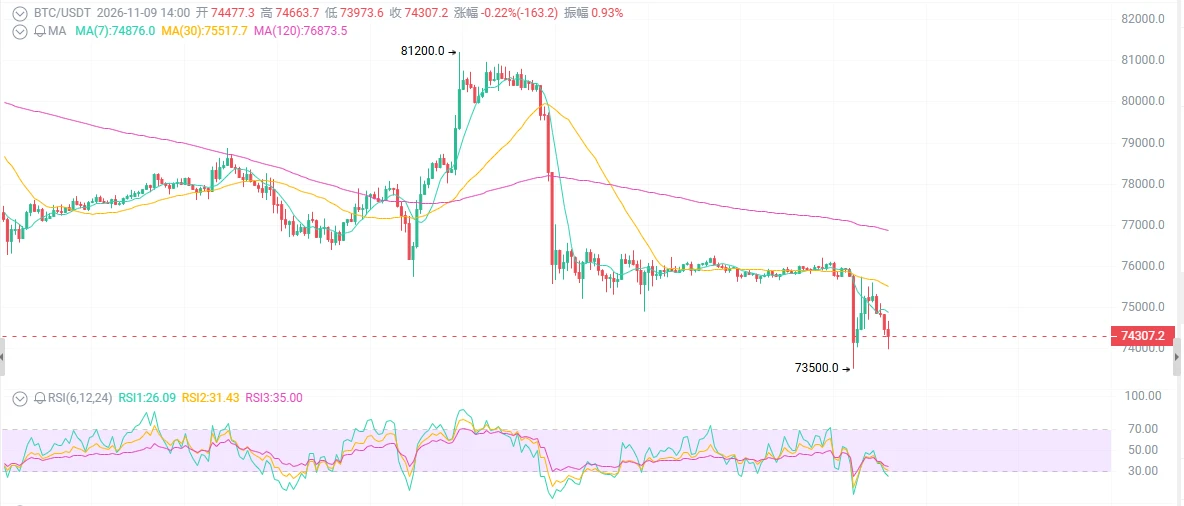
BTC at $74,300—would you still dare to buy the dip?
ETFs saw $1.28 billion in outflows in one week, over $1 billion in longs were liquidated, and the weekly chart posted five straight down weeks—everyone is shouting, “The bear market is here.” But is the $73,000 level really institutions’ cost-basis floor, or the next meat grinder?

First, the surface picture: the drop looks ugly, but it hasn’t collapsed.

It fell 1.5%-2% in 24 hours, hitting a low of 73,500. The daily chart has posted consecutive bearish candles, the weekly chart its fifth straight red candle, and price has broken below the 5
post-image
BTC-0.67%
ETH-1.26%
SOL-0.77%
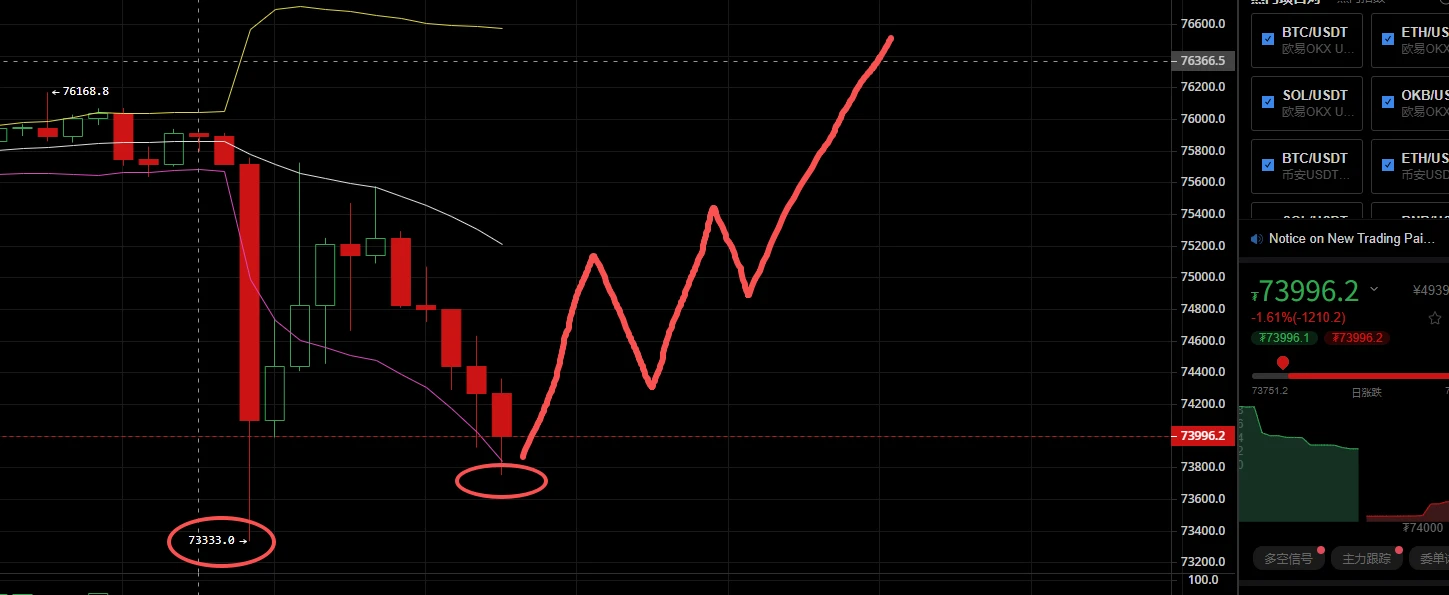
I've seen this Bitcoin price action before: after every accelerated drop comes a second bottom, and once that second bottom is in, a strong rebound begins. It's currently in the second retest, which is also a bear-trap pattern. Once confirmed, it'll take off!$BTC ‌
post-image
BTC-0.65%
morning market update btc
live-cover
LIVE2,277
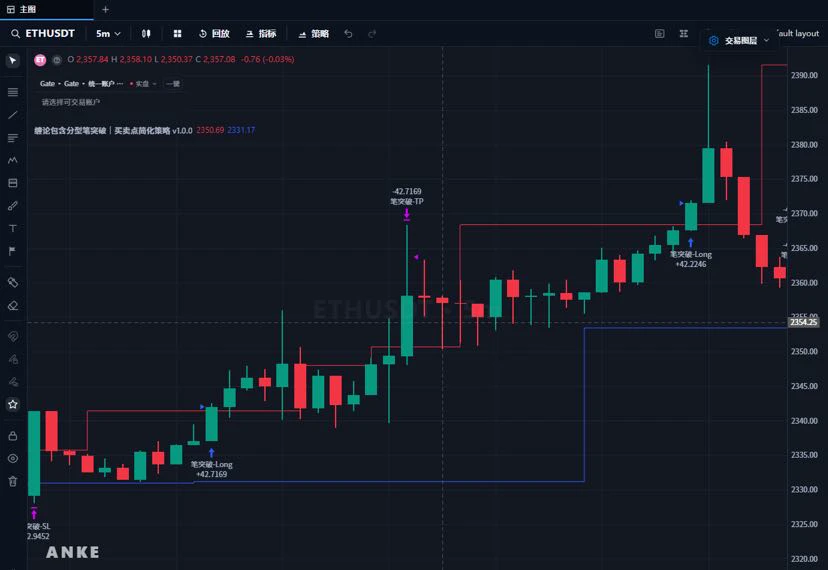
📈 Different markets need different strategic approaches.

Cryptocurrency, gold, stocks, and commodities each have their own market characteristics, volatility patterns, and trading logic.

ANKE AI distinguishes strategy directions by trading instrument, providing corresponding strategy tools and references for different markets.

It focuses not only on generating code, but also on how strategies fit different instruments.

Making tools better suited to the practical needs of different trading markets.
post-image
GLDX-0.40%
PAXG+0.37%
XAU+0.38%
A person's life
turns out to be this simple.
post-image
💰 The market continues to fluctuate, while Gate's 24-hour net inflows rank among the top three globally

According to DefiLlama data, Gate recorded net inflows of about $40.66 million over the past 24 hours, ranking third among centralized exchanges worldwide. 🏆

Amid market volatility, fund flows have once again become a focus of attention.

Some believe inflows reflect trading demand and market confidence; others think short-term inflows may simply result from portfolio adjustments, margin top-ups, or waiting for the next trading opportunity.

Inflows are a positive signal, but more data i
post-image
GateSquare
💰 The market continues to fluctuate, while Gate's 24-hour net inflows rank among the top three globally

According to DefiLlama data, Gate recorded net inflows of about $40.66 million over the past 24 hours, ranking third among centralized exchanges worldwide. 🏆

Amid market volatility, fund flows have once again become a focus of attention.

Some believe inflows reflect trading demand and market confidence; others think short-term inflows may simply result from portfolio adjustments, margin top-ups, or waiting for the next trading opportunity.

Inflows are a positive signal, but more data is needed to determine whether they can translate into sustained buying pressure.

💬 What do you think will be more important to watch next: spot trading volume, sustained fund inflows, or BTC's price performance?

Join #Gate24小时净流入全球第三 on Gate Square to share your market observations, trading strategies, or ideas on fund allocation.

📖 Odaily reports:
https://www.odaily.news/zh-CN/newsflash/532275
repost-content-media
BTC-0.67%
  • 1
$CYBER CYBER has crashed 15.4% in 24 hours, with the current price at 0.2621 and the low already down to 0.2610. It has fallen a full 5 points from today's high of 0.3121. Trading volume of 39.6M shows this isn't a low-volume slide—someone is selling.
First, let's look at market sentiment. Today's CYBER candle has seen almost no meaningful bounce; the price has been pushed down all the way from above 0.31, and each rebound has been weaker than the last—a classic structure dominated by selling pressure. Trading volume of 39.6M isn't small for an asset of this market cap, indicating that tokens
CYBER-5.40%
$HANA ’s vertical rally has finally run out of steam. It looks like everyone stopped buying almost at the same time, leaving a chart that’s gradually cooling off. Hard to say whether it’s looking to retest lower prices or will just trade sideways, but today’s momentum definitely looks heavy. Take profit: 0.01610 Stop loss: 0.0187 Market watch: $PIEVERSE : Current price 1.6017 - 24-hour change: +14.63% $ETH : Current price 2,113.93 - 24-hour change: -5.30%
post-image
HANA-3.22%
PIEVERSE+0.58%
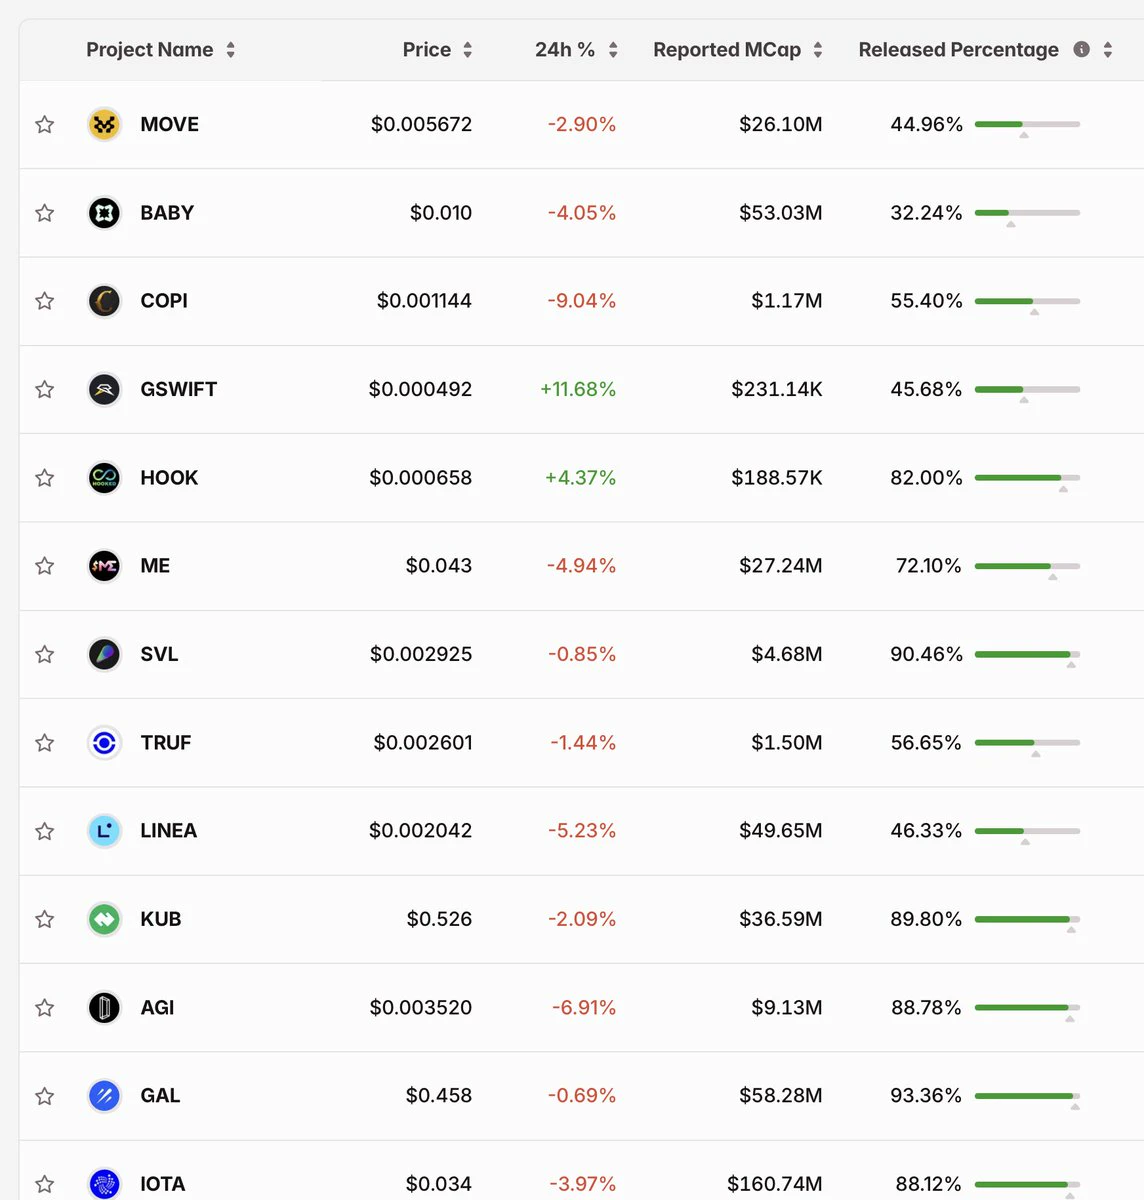
This week's largest unlocks ↓
• Cronos ($CRO ): $56M (2.3% of supply)
• Allora ($ALLO ): $24M (38.7% of supply)
• Arbitrum ($ARB ): $16M (1.4% of supply)
• YZY ($YZY): $8.6M (9.8% of supply)
• Starknet ($STRK ): $4.8M (1.7% of supply)
• Aptos ($APT ): $2.6M (0.5% of supply)
• Sei ($SEI): $2.4M (0.8% of supply)
• peaq ($PEAQ): $2.3M (3.2% of supply)
• Espresso ($ESP): $1.5M (2.8% of supply)
• Babylon ($BABY): $1.4M (2.7% of supply)
Top-3 account for 80% of the week’s total.
Data: @Tokenomist_ai
post-image
CRO-2.47%
ALLO-1.64%
ARB+1.17%
STRK-3.55%
APT-1.51%
  • 5
ETH | Shorting was flagged in advance at 2145; now at 2116! The rebound-short strategy has been validated once again!

ETH plan published in advance today:

Aggressive short: around 2145

Conservative short: 2160–2180

Stop-loss: 2200

First target: 2120

Second target: 2080

ETH is now around 2116, already below the first target of 2120, and continuing toward the second target of 2080.

Why not rush to buy the dip at the time?

ETH saw a high-volume drop to around 2050 in the early hours, with only a limited rebound; at the same time, the US-Iran military standoff and repricing of global risk
post-image
BTC-0.65%
ETH-1.23%
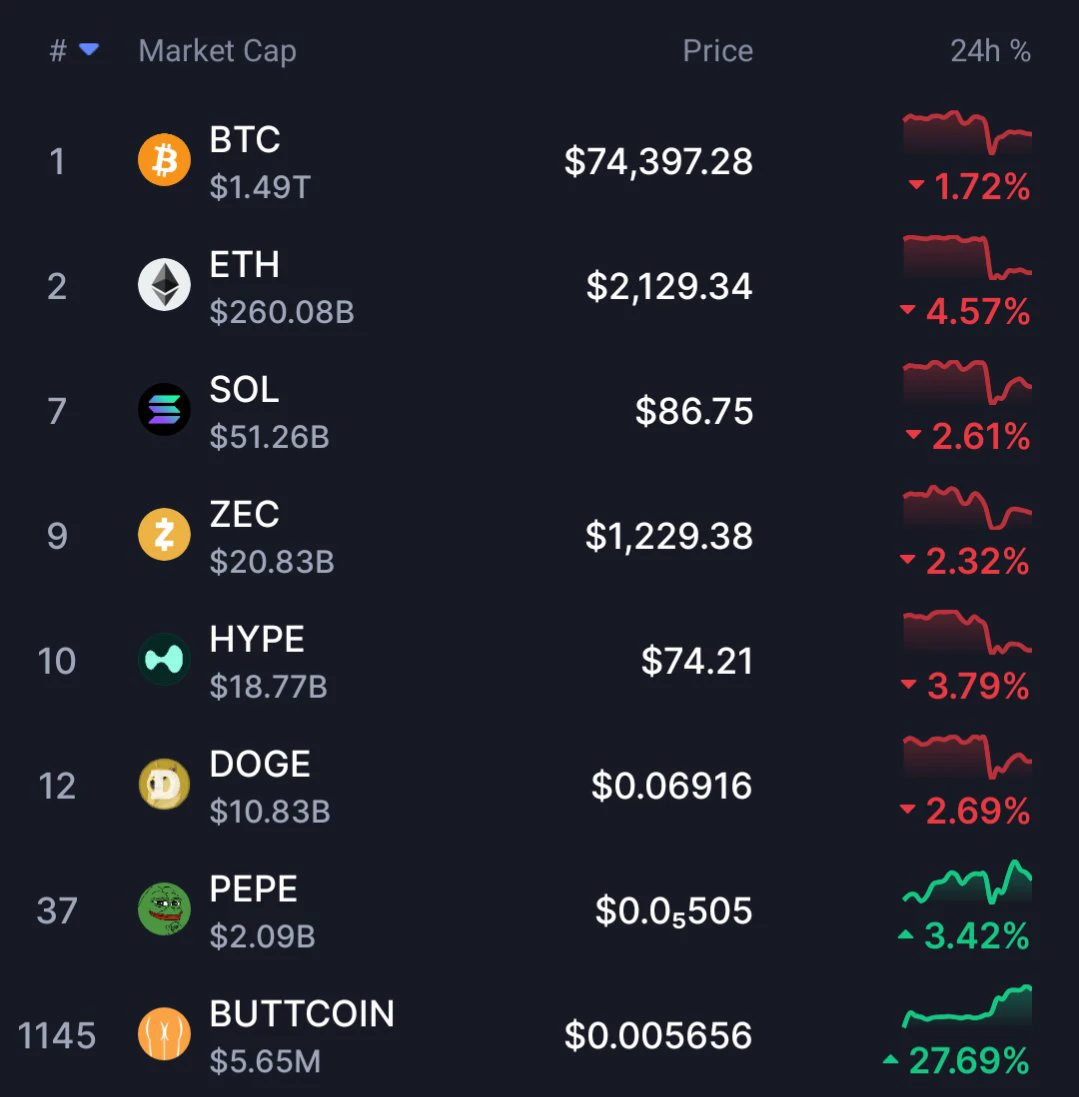
$Buttcoin is the new bitcoin
post-image
BTC-0.67%
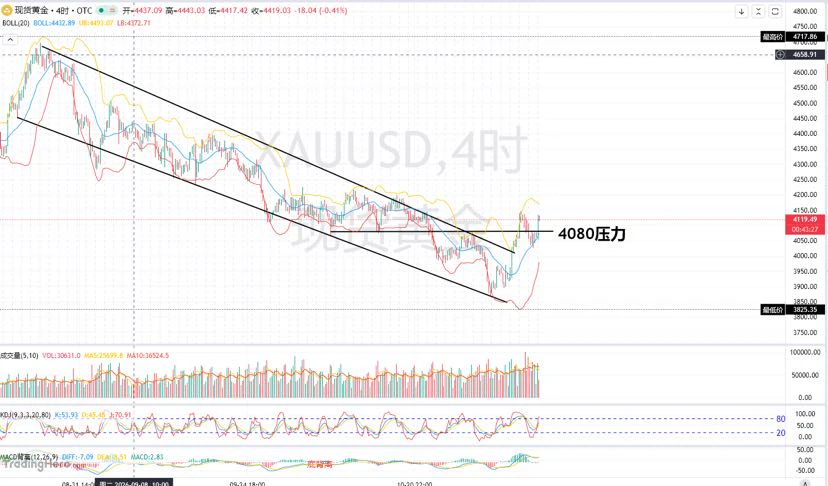
Gold this morning can be summed up in four words: a strong rally followed by high-level consolidation. It surged straight to around 4134, with considerable momentum, then stabilized above 4100 and moved sideways at elevated levels.

The descending trendline on the four-hour chart has capped gold prices for a long time. Recent macro factors broke through that resistance, and prices held above 4100. 4080 has become key support, and price is currently testing the 4100–4080 support zone. Although there is reason to be bullish, don’t chase blindly. On the four-hour timeframe, the strategy is to buy
post-image
XAU+0.38%
XAUT+0.34%
BTC-0.65%
#USOctoberCPIRelease Bitcoin vs Nasdaq vs Gold: Which Market Will Make the First Move?

Tomorrow’s US October CPI release could become more than another inflation headline. It may determine whether markets start pricing a more restrictive Federal Reserve, or regain confidence in lower rates. My focus is not simply whether inflation comes in hot or cool. I want to identify which market reacts first, which delivers the strongest follow-through, and whether the initial move survives the first hour.

The release is scheduled for November 10 at 8:30 AM ET — 21:30 UTC+8, or 18:30 Pakistan time.

The
  • 1
Load More

Join 40 M users in our growing community

⚡️ Join 40 M users in the crypto craze discussion

💬 Engage with your favorite top creators

👍 See what interests you

Trending Topics

USCPIDataIncoming

28.2k Views1.84k Discussing

The U.S. October CPI report will be released on November 10 at 8:30 a.m. ET. September CPI came in at 3.7% year over year, and markets will be watching closely for signs that inflation is cooling, especially in core CPI. A softer-than-expected reading could strengthen rate-cut expectations, while hotter inflation may pressure risk assets through higher Treasury yields and a stronger dollar. How do you think this CPI print will move $BTC, U.S. stocks and gold?

RedBullDoublePodiumInBrazil

1.76k Views30.52k Discussing

BTCFlashCrash

72.71k Views66.22k Discussing

View More