


Square
Following
Hot
News
Profile
Share your thoughts
placeholder
Article
Real-Time CPI Monitoring
live-cover
LIVE1,415
$ES | Strength Switching Universal Frameworks
‣ Asset Synchronization to Break SMT
‣ Breakaway Gap (BAG) Framework
🇺🇸 BANK OF AMERICA DUMPED 7.7% AFTER BEING FINED $1.2B FOR LAUNDERING.
post-image
BAC-5.70%
Today, we are only testing one question about $ENA : whether it can quickly recover after breaking below 0.1875.
The 1-hour and 4-hour trends are both weak, with RSI at 21 and 26, respectively. The current price is 0.1978, about 5.21% above the 1-hour support at 0.1875 and 8.44% below the resistance at 0.2145. The 24-hour change is -6.17%, but it cannot replace confirmation at key levels.
My view is not based on chasing rallies or selling into declines: I will wait for a breakout above 0.2145 or a break below 0.1875, and whichever occurs first will determine how I revise my assessment.
Would y
post-image
ENA-6.44%
$WAL remains strong, but the crowding risk is also rising
$WAL 24 hours +62.93%, current price 0.06193. The 1-hour and 4-hour RSI are 84 and 87, respectively. The strength is real, and so is the crowding. The question is not whether it can continue moving higher, but who will be willing to catch it on the first pullback.
Set emotions aside first—the structure offers very specific information. The 1-hour EMA20 is at 0.04995346, currently indicating strength; the 4-hour EMA20 is at 0.04326274, also currently indicating strength. Shorter timeframes expose changes, while longer timeframes limit im
post-image
WAL+58.67%
$OP Has fallen to the lower Bollinger Band—is this a bottom-fishing opportunity or merely a continuation of the downtrend?
Conclusion first: The technical outlook remains bearish, but the short term has entered an oversold trading zone. I would favor waiting for a rebound confirmation before opening short positions rather than chasing the decline.
$OP Current price: 0.1381, down 7.69% over 24h. The moving-average structure shows a standard bearish alignment: MA5=0.1395 has fallen below MA20=0.149675, indicating clear medium-term pressure. The MACD histogram at -0.002031 is still expandin
post-image
OP-7.42%
ZEC-4.01%
XRP-2.81%
The fact that Bannon was asked whether he would accept the midterm election results says it all. He has no intention of accepting them. Less than three weeks—just wait and see. Even if he loses, he’ll still declare victory. Save this prediction and come back tomorrow to verify it. Those of you watching, follow along.
post-image
#美国9月CPI超预期 Bitcoin Faces a Fed Repricing Test as Inflation Hits 3.7%
The biggest risk after a hot CPI report is not always the first red candle. It is what happens when traders begin changing their expectations for interest rates.
On October 14, the U.S. September inflation report delivered a clear warning: price pressures are moving in the wrong direction. Headline CPI increased 3.7% year over year, up from 3.4% in August and above the 3.6% forecast. Monthly inflation accelerated to 0.6% from 0.4%. Core CPI, which excludes food and energy, rose 2.6% annually and 0.3% monthly. These figures m
post-image
BTC-2.00%
GAS+0.35%
Firefighter: I was almost done here, and now you pull this.
CRYPTO + STOCK MARKET UPDATE
live-cover
LIVE1,808
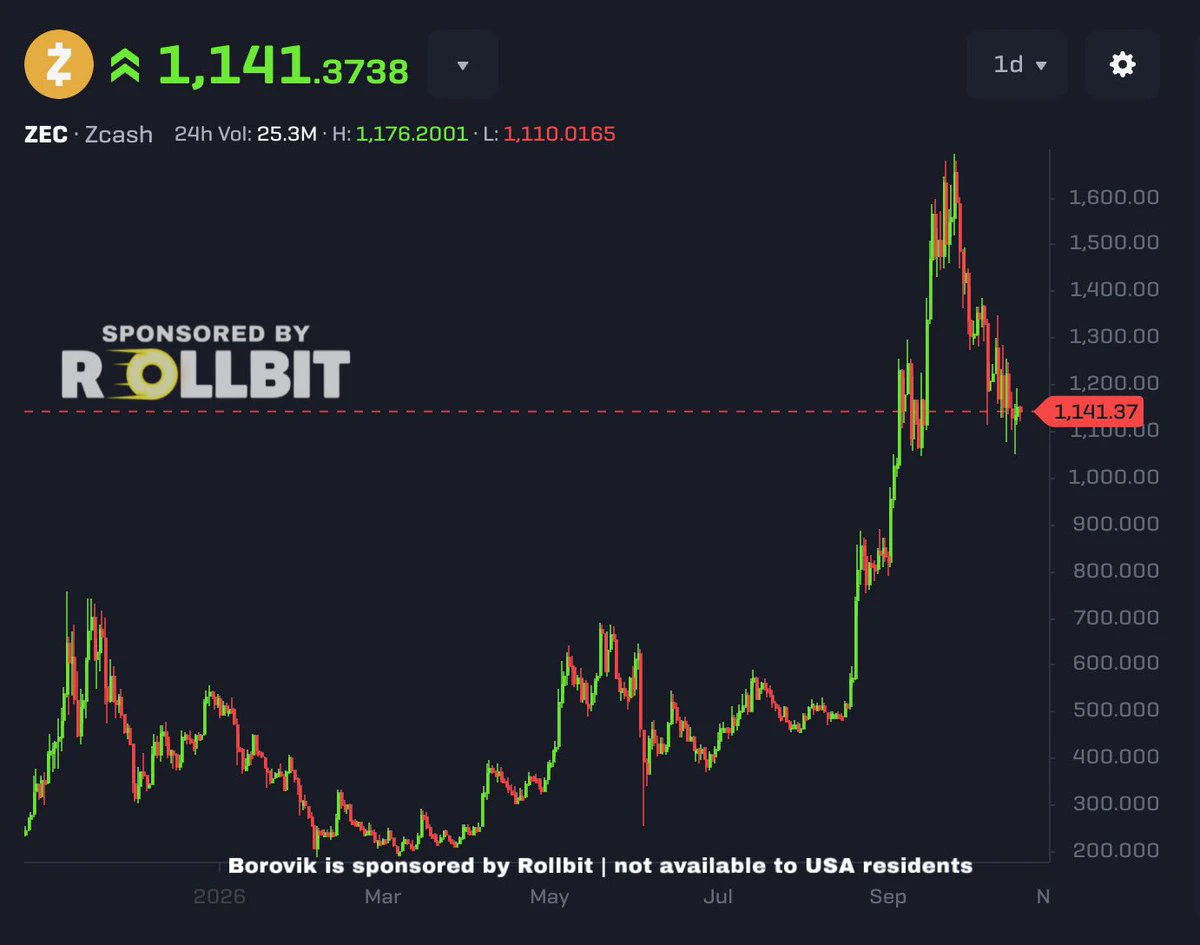
10.14 Intraday ZEC Strategy Review
Intraday $ZEC Silk Road strategy failed:
Intraday, it failed to break through 1286 and hold above 1300.
A loss is a loss, and one must stand straight after taking a beating.
Analysis and explanation regarding CPI in the evening: Considering that the market maker should have pushed the price upward to make the shorts more aggressive and provide some liquidity before forming a major waterfall, it instead started falling directly. The original view of Duo Dan, targeting 852 and 2560, was therefore invalidated, so I exited early, preserving principal and leaving
AChenBit
Still unsure whether to go long or short tonight?
The current trend analysis gives you the answer:
Trading factors: After Bitcoin and Ethereum fell to test the bottom, they simultaneously entered range-bound consolidation. ZEC initially followed the broader market in consolidation, then broke upward out of the range, but pulled back after rising sharply, showing a clear divergence in strength. Previously, both experienced sharp declines to test the bottom, followed by capital entering to repair the damage after finding the bottom, but their subsequent trends diverged.
$BTC remains constrained within the range in the short term, with no clear one-way direction. Only a break above 84259 could open up further upside; a break below 82793 would weaken again and move lower. For now, focus on selling high and buying low, and do not bet on a breakout in advance.
$ETH has not yet developed an independent trend and is undergoing passive consolidation in line with the broader market. Resistance is at 2535 above, while support is at 2468 below. Bitcoin needs to break out of its range first before ETH can follow and choose a direction.
$ZEC is a strong asset within the sector and broke out first, but the breakout lacks sustained volume expansion, making a false breakout and retest likely. Key support is near 1233. If this level holds on a pullback, there will be another chance to rise; if it falls back inside the original range, it will return to a consolidation pattern and the bullish logic will become invalid.
CPI data will be released tonight, with risk and profit equivalent. Prioritize long positions on Bitcoin and Ethereum, targeting above 852 and 2560. Once these highs are reached, execute planB. Do not take long positions on ZEC; prioritize short positions at high levels, targeting the lower boundary of the range.
Tonight's data is highly likely to be favorable, preparing for a rate hike in November or December. Wicks in both directions may easily trigger stop-losses, so enter cautiously with small positions.
#韩林博士受邀牛津大学辩论社演讲
#美国9月CPI即将公布
#GateWCTCS9全球交易赛
repost-content-media
ZEC-3.89%
BTC-1.95%
ETH-3.17%
Tomorrow, we’ll keep trading against the dog market maker to earn USDT. Gather quickly at 8 a.m. for the copy-trading subscription! Earn USDT to support the family, and make money for my wife to spend!
post-image
$TZA and $SQ are the two charts you don't want to see look bullish and right now both do (inverse ETFs).
TZA+6.56%
You’ve all been wrecked by losses, happy now
#USSeptemberCPITopsEstimates
🚨 HOT U.S. CPI SHOCK: BITCOIN, STOCKS & GOLD AT A CRITICAL TURNING POINT
September Inflation Report
The U.S. inflation report is out, and the market has a serious question to answer: will higher inflation force the Federal Reserve to keep monetary policy restrictive for longer, or can buyers absorb the shock and trigger a recovery?
September's CPI exceeded expectations, Treasury yields moved higher, the dollar strengthened, and financial markets faced renewed pressure. For Bitcoin traders, stock investors, and gold holders, the next move will depend on inflation
post-image
#美国9月CPI超预期 CPI beat expectations on both the headline and core readings, and tonight the market will likely reprice “higher for longer” first: rate-cut expectations will be pushed back, while the dollar, Treasury yields, and real yields rise first, putting pressure on gold, Bitcoin, and the Nasdaq.
How much did CPI actually beat expectations
September headline CPI rose 3.7% year-on-year, while core CPI rose 2.6% year-on-year; core CPI rose 0.3% month-on-month, above the expected 0.2%. The headline figure was elevated mainly by oil prices, but the 0.3% month-on-month core reading shows that in
post-image
BTC-2.00%
NDAQ-1.52%
SPX500-1.40%
XAG-6.34%
create posts, conduct broadcasts, or compete together with the team. Share your experience in the comments. 💬
#每周来晒 #美国9月CPI即将公布 #韩股大跌你会抄底吗
@Gate_Square @Gate Plaza
$MUM​U929.08Stocks-2.51% ‌$NAS100 N​A​S​1​0​030,079.34CFD-1.62% ‌$EURUSD E​U​R​U​S​D1.11CFD-0.67%
MU-2.85%
NAS100-1.82%
EURUSD-0.64%
Buying one more lot of gold won’t leave me stuck, right😂... Let’s give it a try.
GLDX-1.48%
PAXG-1.62%
Quantum Computing Threat Looms? Coinbase Urges Bitcoin to Prepare
NEW: Coinbase says the network should start preparing for quantum computers now through a staged, multi-year migration to quantum-resistant signatures.
It also wants the upgrade to stay safe for everyday wallets, while leaving the question of lost and Satoshi-era coins for a later phase.
⚠️ Personal market analysis only. NFA — manage risk and DYOR.
Educational content, not investment advice or a recommendation to buy, sell, deposit, or withdraw any asset. No paid promotion or referral/affiliate links.
post-image
COIN-5.33%
BTC-2.00%
$Q It surged 21 points in one day—is chasing in now smart, or are you just exit liquidity? Let me make this clear: this position is a meat grinder.
Bullish reasons: First, trading volume reached 278 million, meaning real money has come in—not a pump driven by empty talk; second, it moved from 0.0407 to 0.0529 intraday, with a 30% range, showing that major players are active rather than the market being stagnant; third, with this kind of high-volume breakout pattern, the odds of short-term momentum continuing upward are relatively high. Once the whole-number level of 0.05 holds, the next resis
Load More

Join 40 M users in our growing community

⚡️ Join 40 M users in the crypto craze discussion

💬 Engage with your favorite top creators

👍 See what interests you

Trending Topics

USSeptemberCPITopsEstimates

35.62k Views2.25k Discussing

US September CPI rose 3.7% YoY, above the 3.6% estimate; core CPI rose 2.6%, also above the 2.5% estimate. With inflation topping forecasts across the board, how will rate hike expectations shift? How will BTC react? Share your view.

DrLinHanSpeaksAtOxfordUnion

135.01k Views1.85k Discussing

GateWCTCS9GlobalTradingCompetition

37.29k Views6.1k Discussing

View More