SunnyOk

vip
Market Analyst
On-chain Analyst
Futures Trading Strategist
follow me and let's learn together
I’m back again!
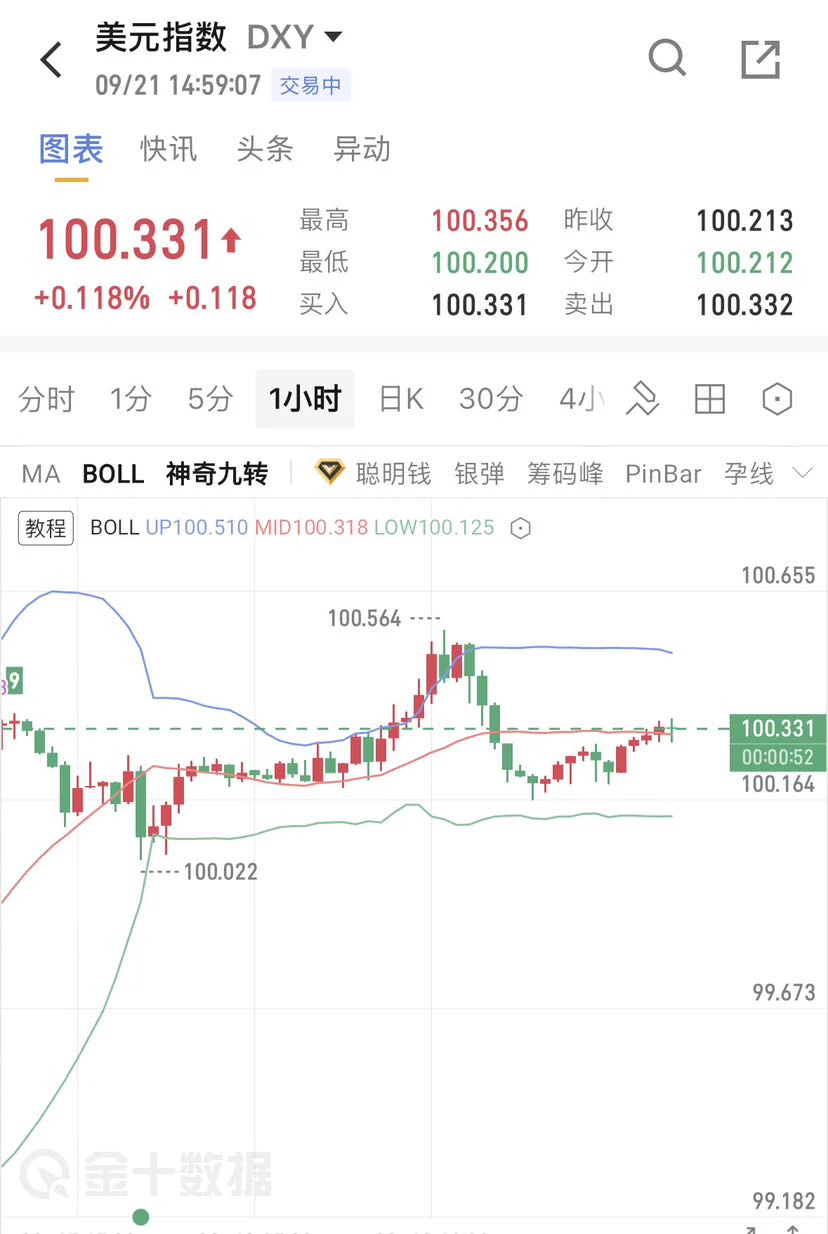
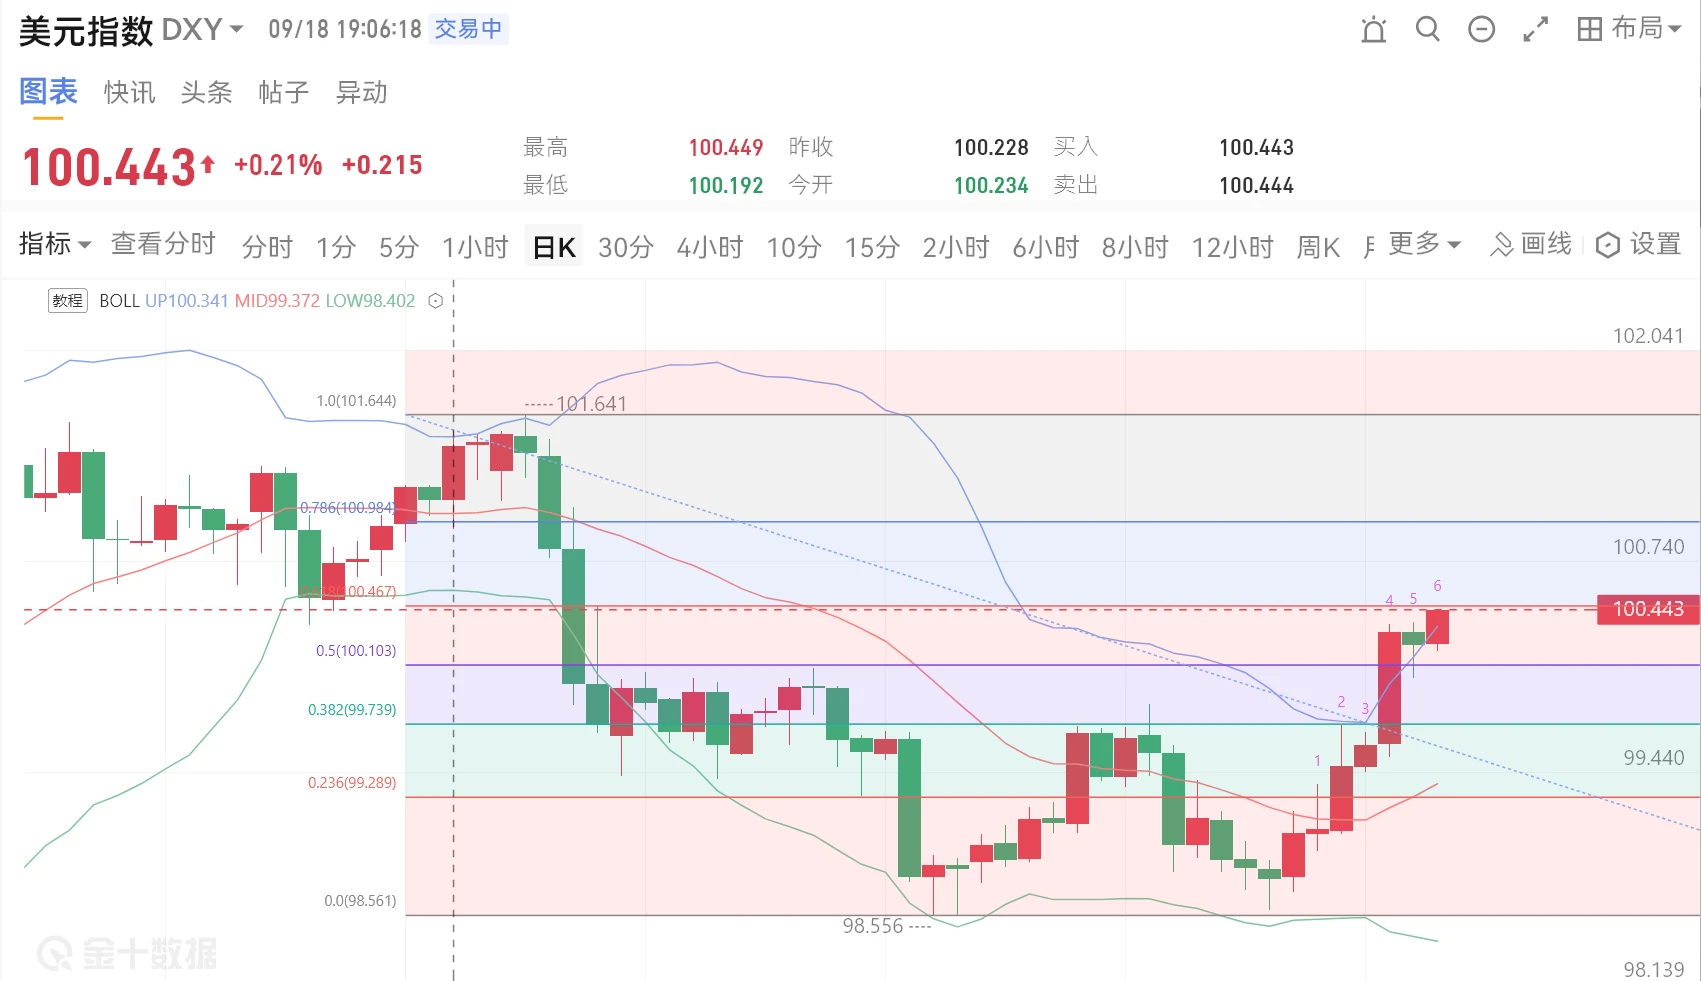
The U.S. Dollar Index failed to break above 100.4, retraced to the 50% level on the one-hour timeframe at its lowest point, and then continued to rebound. Therefore, as long as it cannot rise above 100.4, the low of its next pullback should be lower than that of this pullback. In other words, as long as it fails to hold above 100.4, the U.S. Dollar Index will move sideways to the downside.
Conversely, gold’s pullback levels will become increasingly higher each time. As long as it fails to hold firmly above 100.4, gold will move in a sideways-to-upward pattern.$XAUUSD Personal
XAUUSD+1.82%
  • 10
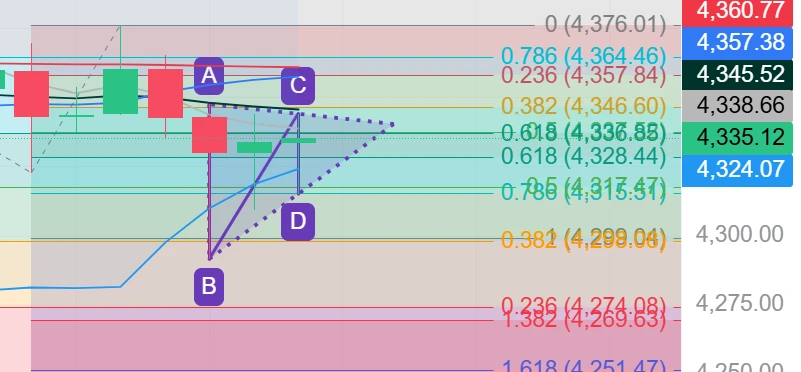
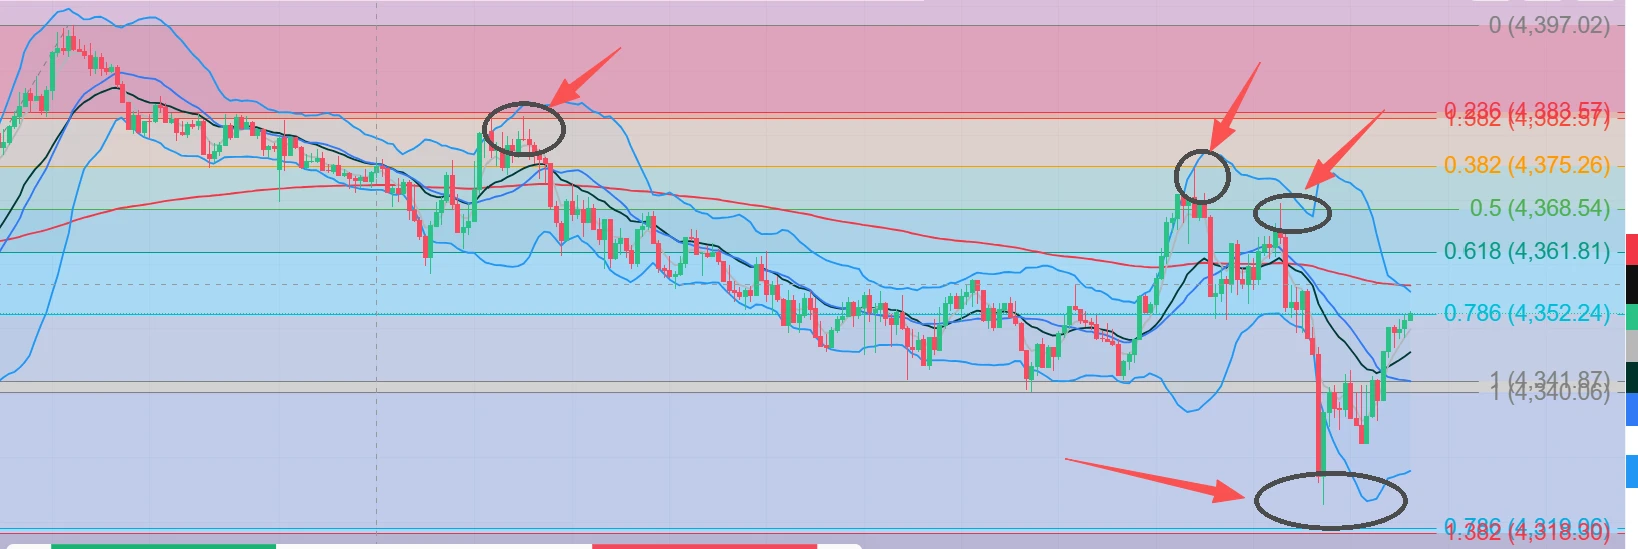
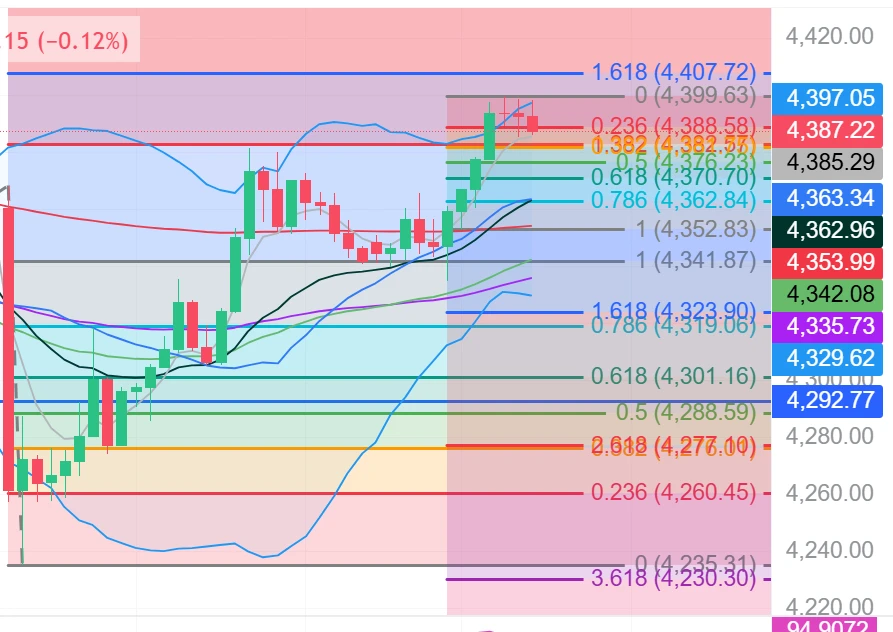
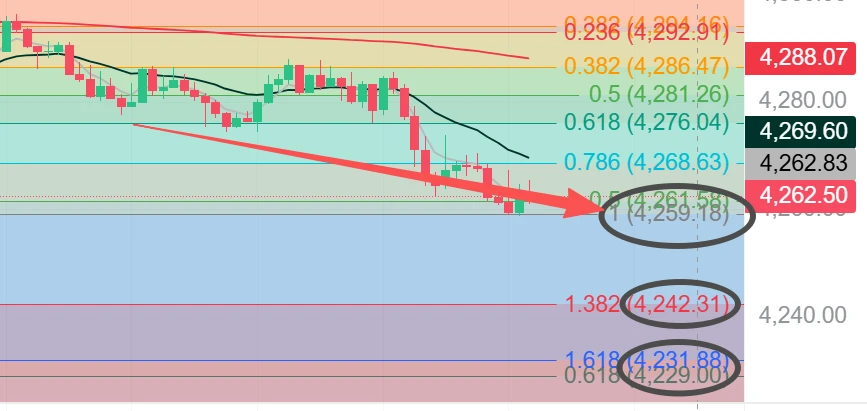
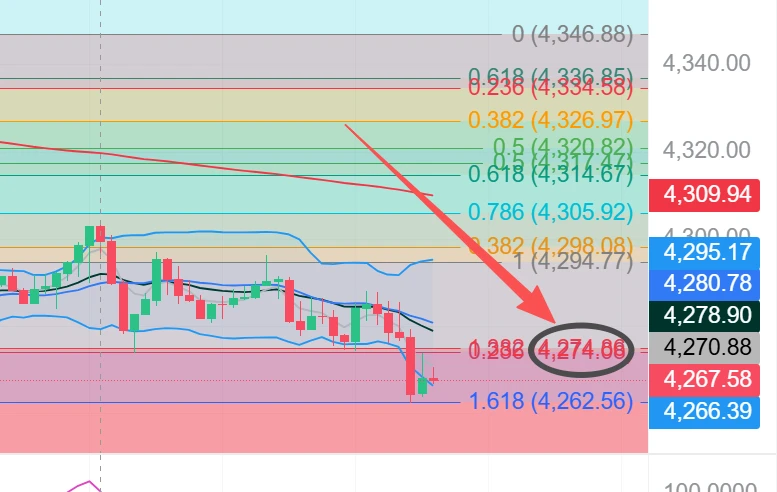
Gold Fibonacci levels, for reference only; if it breaks above 4382, it will rise strongly. $XAUUSD
post-image
XAUUSD+1.82%
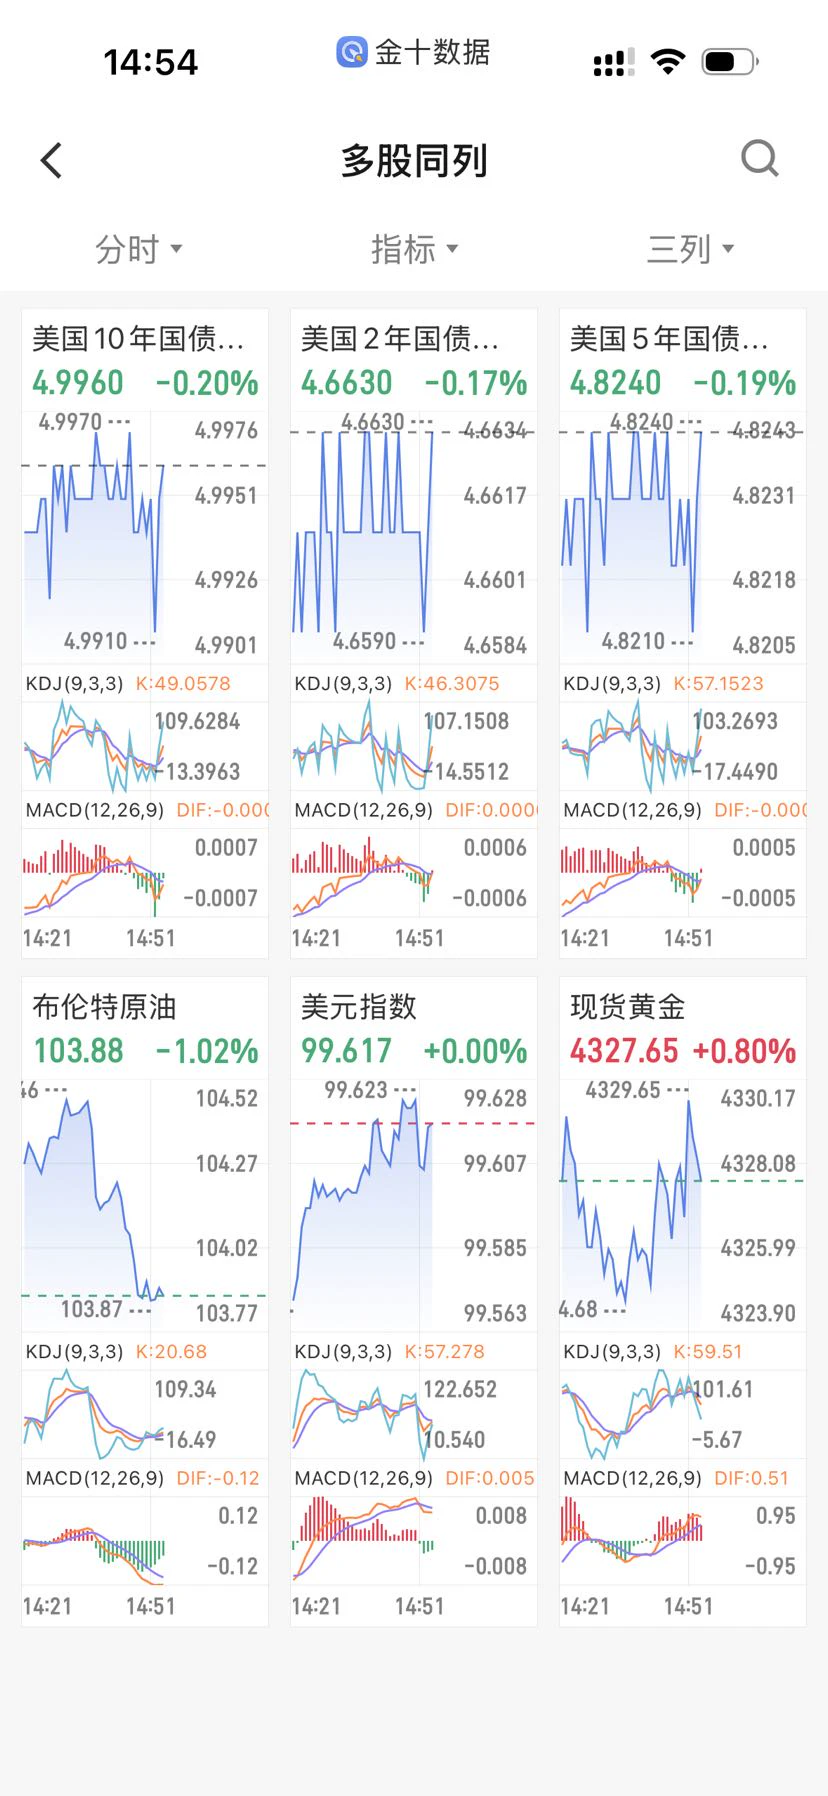
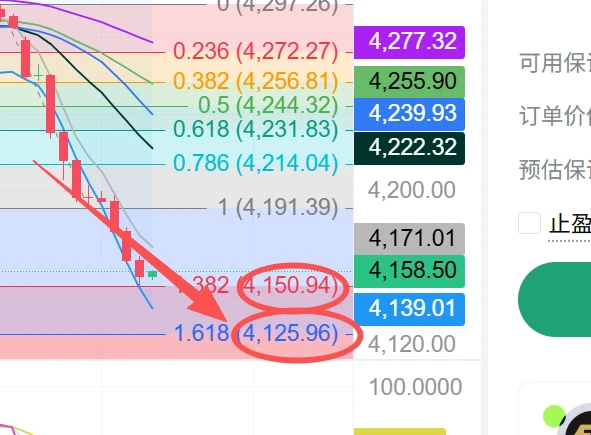
The US Dollar Index has reached the key resistance level of 100.4. After rising and retreating yesterday, gold rebounded. The main focus now is the 100.4 resistance level. Once the US Dollar Index closes above 100.4 on the daily chart, it will indicate that upside room has opened, and gold will continue to fall. If the US Dollar Index fails to close above it, watch whether gold can reclaim the 4283 support level; if it does, gold may also move higher. Geopolitical tensions have not eased, and interest rate hikes do not seem to have curbed oil prices. Oil remains above the 104 support level, so
XAUUSD+1.82%
  • 4
It’s been a long time since I shared some random thoughts, so here are a few. First, after the rate-hike news was announced during the session, the market launched a volume-backed rebound, with morning trading volume down by 50 billion before turning to an increase of 100 billion by late morning; second, technology and semiconductors did not follow the adjustment two days ago at a key level and instead rebounded, indicating that the bottom for this semiconductor move has been reached; third, gold closed above 4283, with support holding effectively, and is expected to fluctuate around 4340, whi
XAUUSD+1.82%
  • 17
Work
live-replay-cover
1,886 views06-10 07:43
02:39:50
Work
live-replay-cover
2,144 views06-09 06:16
02:48:19
Work
live-replay-cover
2,869 views06-08 07:32
03:20:43
Work
live-replay-cover
2,936 views05-28 14:24
02:44:38
ETH/USDT Market Notes (2084-2085, down about 0.5%)
Overall qualitative summary: A low-level grind within a downward channel, not a reversal, is a market maker’s game of feeding liquidity at both ends within the wide box of 2050-2120, eating spreads.
Yesterday’s price kept bouncing within the consolidation zone of the moving averages at 2090-2120. Today, it directly tested again at 2053-2060, rebounded but pressed very hard. The most obvious change compared to yesterday is—rebound is increasingly weak, even 2120 can’t hold steadily, indicating buying interest is there but not enough; the demand
ETH+1.97%
NAS100+1.57%
BTC+0.64%
  • 3
Time to work
live-replay-cover
4,177 views05-26 13:36
03:24:07
ETH/USDT Market Overview (Current Price ~2089)
Perspective: Liquidity Market Making / Order Book Structure
1. Current Market Situation: Weak Consolidation, Waiting for Direction
ETH is currently stuck in a descending channel, showing weak signs of repair. Yesterday, it was still grinding around the 2097-2120 area near the moving averages, but today it has dropped below. Now it’s watching the support band at 2083-2060. Above, a long line of long-term moving averages is pressing down—getting back up is hard.
• Short term (15m/1h): The Bollinger Bands are tightening, with the moving averages all
ETH+1.97%
NAS100+1.58%
BTC+0.64%
  • 2
Back to work again
live-replay-cover
3,311 views05-25 14:07
02:23:28
Market Overview: ETH Structure and Liquidity Observation
1. Core Range and Watershed
The current market rhythm is completely stuck within the 2080-2120 oscillation box, market makers are profiting from volatility on both sides, with no trending move.
• Bullish Key Zone (2120-2135): This is not only the moving average and previous high but also the 0.382 retracement level. Only when the daily chart stabilizes above this range can the bullish structure be confirmed, sweeping out liquidity above 2180.
• Bearish Defense Line (2060-2080): This overlaps with the recent low and the 0.5 Fibonacci leve
ETH+1.97%
BTC+0.64%
  • 7
Yesterday's decline + today's rebound reasons (market overview)
• Yesterday's decline: mainly due to leveraged liquidations chain reaction + macro/market sentiment drag. Recently, the crypto market experienced multiple rounds of selling pressure (ETH led the decline), with significant liquidation of derivatives long positions (ETH-related liquidations were prominent in the past 24 hours, mainly longs). The ETH/BTC ratio is weak, with funds rotating from ETH to BTC or other assets. Macro factors may include US stock/interest rate expectations and risk aversion.
• Today's rally: short covering +
ETH+1.97%
BTC+0.64%
  • 1
Working overtime on the weekend
live-replay-cover
4,331 views05-24 13:28
03:07:57
I'm here
live-replay-cover
5,060 views05-22 13:27
03:03:17
Work
live-replay-cover
2,543 views05-15 14:07
02:03:03