



Square
Following
Hot
News
Profile
Share your thoughts
placeholder
Article
Good morning from Thailand!!!
post-image
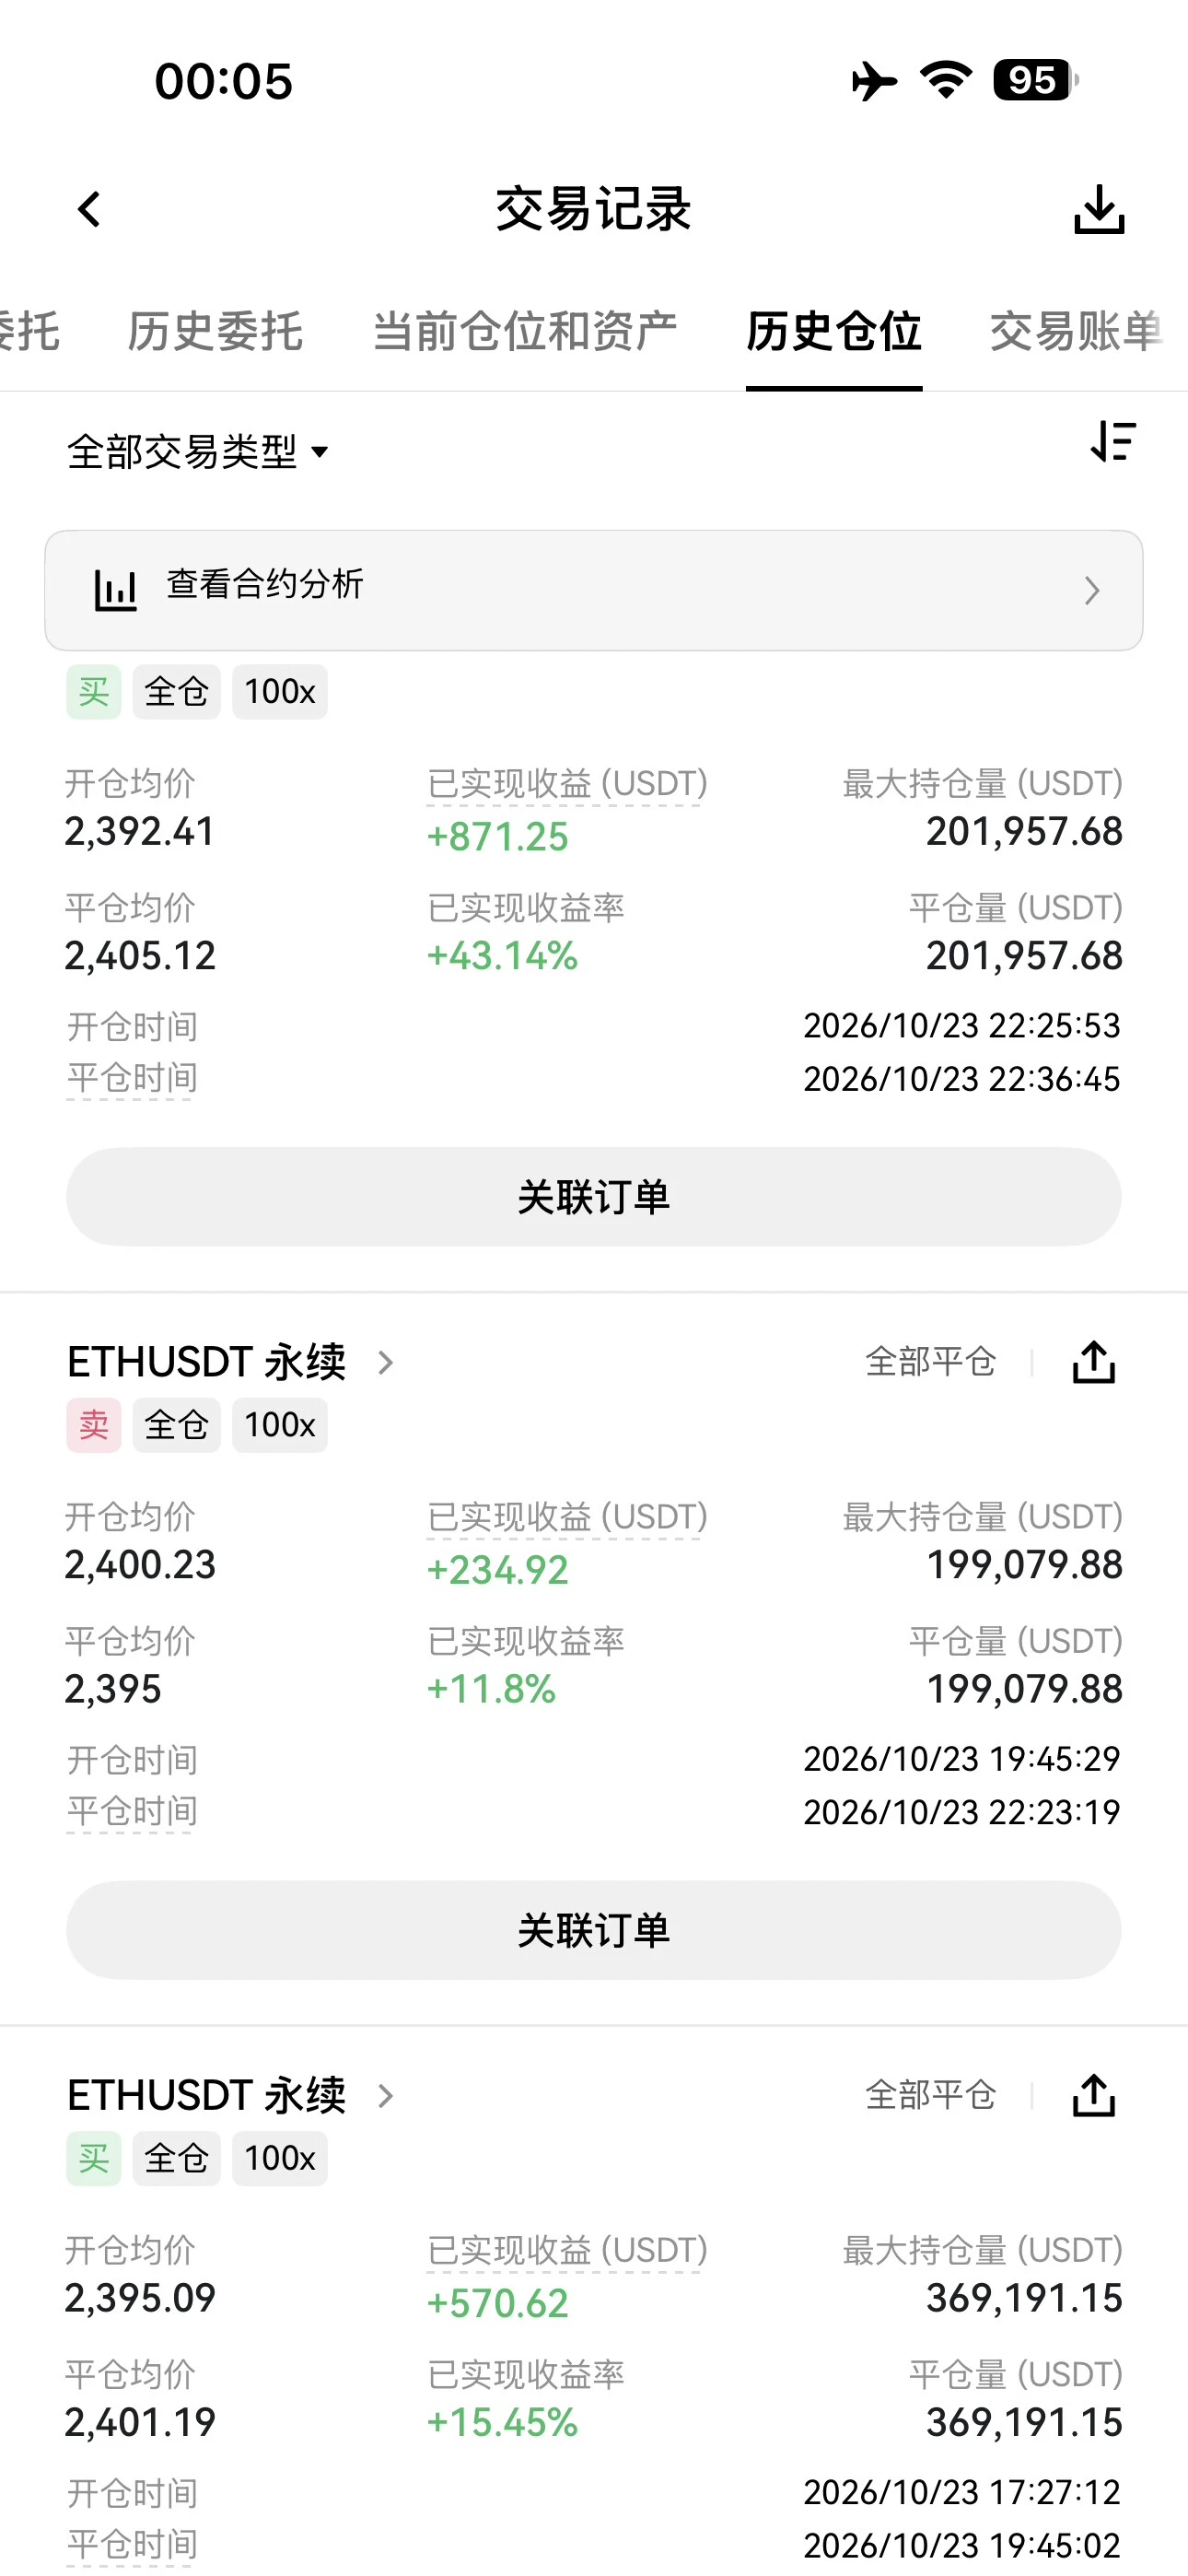
Take the 2,000-point move, and judge for yourselves how precise this entry was. How much you can make is up to you.$BTC $ETH #美国9月PPI大超预期
BTC+0.13%
ETH-0.51%
Trenches
AGT
A
bade
b
AGT
0x5d...e274
Market Cap
$.
Change
.
24h Vol
$.
Holders
.
CNPY
C
bade
b
CNPY
0xc6...ddd2
Market Cap
$.
Change
.
24h Vol
$.
Holders
.
Q
Q
bade
b
Q
0xc0...0589
Market Cap
$.
Change
.
24h Vol
$.
Holders
.
Gato
G
bade
b
Gato
55A3...pump
Market Cap
$.
Change
.
24h Vol
$.
Holders
.
DOPE
D
bade
b
DOPE
0xf9...8899
Market Cap
$.
Change
.
24h Vol
$.
Holders
.
A major rally is imminent—hold tight to the wheel#btc $BTC
post-image
BTC+0.15%
The Nasdaq has started a correction. A weekly bearish divergence is a correction signal, and this correction could be somewhat stronger. It is a multi-timeframe confluence signal, with support at 25,600-24,300-23,800
The question to consider here is: will a U.S. stock market correction spill over to other assets? ❓️
U.S. Treasury yields: The 10-year yield is around 5.09–5.10%, near its highest levels in recent years, putting sustained pressure on high-valuation, long-duration risk assets (tech stocks and crypto)
U.S. Dollar Index: Around 101.8, neutral to firm, with no extreme appreciation
S&P
post-image
SPYX-0.64%
BTC+0.13%
I think the current crypto market is in the early recovery phase after the cycle low, currently pulling back and waiting for secondary confirmation:
• BTC at around $81,500, down about 35% from its October 2025 ATH of $126,000
• This cycle’s low was around $58,000 in June-July 2026 (a drawdown of about 54%, relatively shallow historically)
• Q3 total market cap rose 39.6% to nearly $3T, with ETFs returning to net inflows
• Fear & Greed Index at around 53 (neutral)
• BTC dominance at around 59-60%
Institutional consensus: the bear market is over, and the market is transitioning from acc
post-image
ETH-0.51%
BTC+0.13%
A few days ago, I strongly urged a friend
to bet on AVA, and it has doubled now
You ask me why my bets are so accurate
It’s all insider information🤓
Some people pick coins by looking at altcoin holdings/market cap
and trading volume
Actually, this is not much different from guessing high or low
These are all metrics that market makers can easily inflate, at a very low cost
AVA+32.09%
At 5 a.m., Ethereum saw another sharp wick down, mainly as Brent crude broke above $106 in after-hours trading, up more than 4% intraday
Combined with the U.S. September CPI annual rate accelerating to 3.7%, markets repriced the rate-hike path and risk appetite contracted; continued net outflows from spot ETFs and declining exchange reserves amplified the drop, leaving the short-term outlook weak.
post-image
ETH-0.51%
BZ-0.76%
  • 2
  • 1
Saturday strategy: BTC long at 81000, in profit; zec long at 1120, in profit; ETH long at 2373, added to the position at 2353, in profit
BTC+0.13%
ZEC-1.04%
#美股存储板块跌幅扩大
The core question is whether this represents a healthy correction following a rally driven by artificial intelligence (AI), or the beginning of a deeper repricing process within the storage sector. Rather than buying simply because prices have fallen, it would be more prudent to focus on earnings expectations, memory pricing, and whether each company can maintain its profit margins.
My perspectives on storage sector stocks:
* Micron (MU): Monitor demand for DRAM and HBM, memory growth linked to AI, and gross profit margin forecasts. Strong AI demand could bolster earnings, though
post-image
ybaser
#美股存储板块跌幅扩大
The core question is whether this represents a healthy correction following a rally driven by artificial intelligence (AI), or the beginning of a deeper repricing process within the storage sector. Rather than buying simply because prices have fallen, it would be more prudent to focus on earnings expectations, memory pricing, and whether each company can maintain its profit margins.
My perspectives on storage sector stocks:
* Micron (MU): Monitor demand for DRAM and HBM, memory growth linked to AI, and gross profit margin forecasts. Strong AI demand could bolster earnings, though these expectations may already be priced into the stock.
* SanDisk (SNDK): Focus on NAND flash pricing, demand for enterprise SSDs, and the sustainability of any earnings recovery. NAND supply and price cycles can make this stock particularly volatile.
* Western Digital (WDC): Evaluate "nearline" (high-capacity/accessible) HDD demand from AI data centers, cloud computing expenditures, and free cash flow. The factors influencing HDD demand differ from those affecting NAND and DRAM.
* Seagate (STX): As data center storage requirements grow, keep an eye on demand for high-capacity drives, pricing power, and profit margins.
* Track NAND market conditions, enterprise SSD adoption rates, and the company's valuation relative to earnings expectations.
What signs might justify rebuilding a position? I would look at the following three points:
* Stabilization of fundamental indicators: A halt in the deterioration of memory and NAND prices, company forecasts, and earnings estimates.
* Confirmation through price action: Stocks forming higher lows and reclaiming key moving averages, accompanied by stronger trading volume.
* Attractive valuation: Expected earnings growth that justifies the current price, even under less optimistic scenarios.
A decline in a stock price is not, by itself, a buy signal. If earnings estimates are falling faster than the stock price, the valuation may not have actually become cheaper.
Rather than buying the entire storage sector indiscriminately, I prefer to differentiate between individual companies. While AI demand serves as a long-term tailwind, memory, NAND flash, and hard disk drives each have their own unique supply cycles, competitive pressures, and profit margins.
An important distinction: A pullback driven by profit-taking is fundamentally different from one caused by weak forward guidance or falling memory prices. The latter scenario warrants a much more cautious approach. Which of these stocks—MU, SNDK, WDC, or STX—are you following most closely? I can help you compare their valuations, earnings outlooks, technical levels, and the potential factors that could support a recovery.
$MU ‌$SNDK ‌$WDC ‌$STX ‌
repost-content-media
MU-5.66%
SNDK-6.90%
  • 9
  • 1
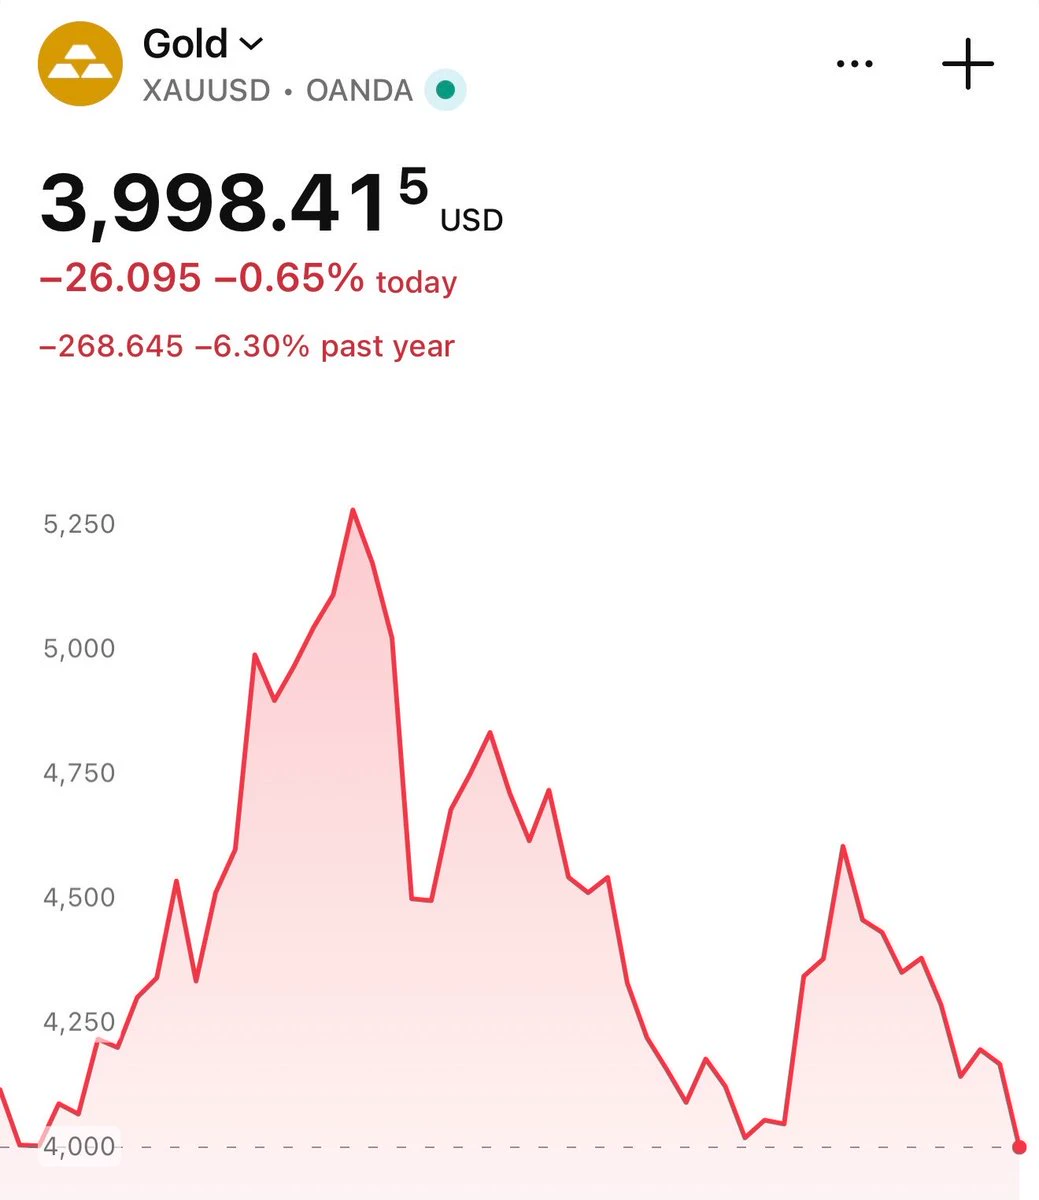
$XAU SHORT SETUP — GOLD FACING SELLING PRESSURE 📉**
Entry: 4164 – 4172 (Short)
SL: 4182
TP1: 4155
TP2: 4145
TP3: 4130
Gold is struggling to recover after rejection from 4205.65. Buyers look weak, and sellers are defending the recovery.
As long as 4182 holds, another downside move remains possible.
**Watch for rejection near entry before taking the trade.**
post-image
XAU-0.18%
  • 4
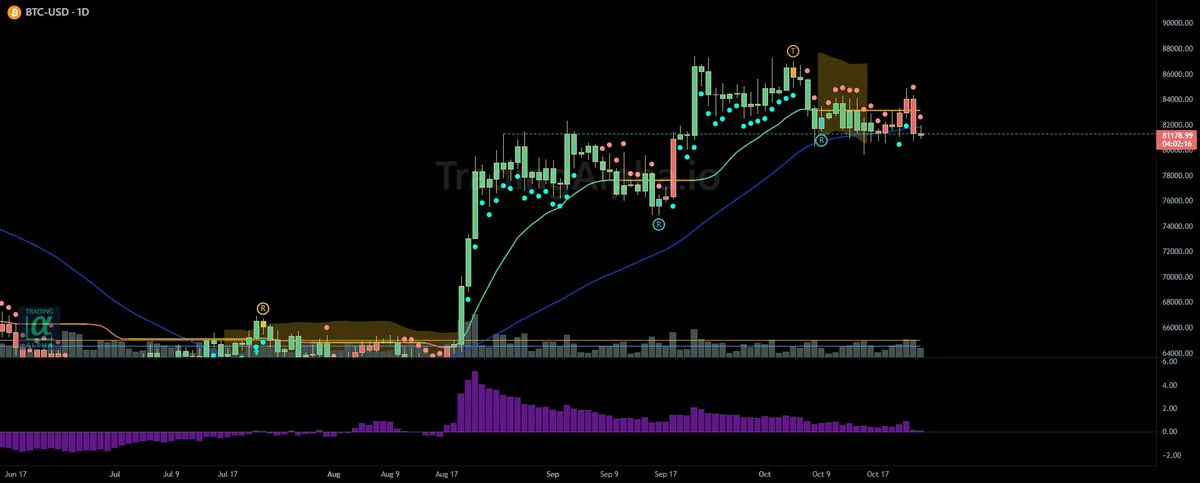
10.18 Weekend Morning Market Overview: BTC Range-Bound, Sell High and Buy Low
BTC formed a small bearish candle with a long lower wick this morning, marking two consecutive bearish daily candles
Yesterday, BTC hit a high of 81,700 and a low of 80,700, fluctuating by 1,000 points. It is continuing to consolidate near 81,700 during today's session
Looking at the chart, BTC's broad range is 82,700–80,700. The market maker has moved down from the 82,700–81,700 accumulation range to 81,700–80,700
81,700 is a pivotal horizontal level. Go long in the direction of the trend after a breakout and hold,
post-image
BTC+0.15%
  • 1
  • 1
Don't fall into the trap of self-justification,
Regularly ask yourself about your core position: if you didn't hold it today, knowing the information in front of you, would you still be willing to buy it?
post-image
#美股存储板块跌幅扩大 #ShareWeekly
U.S. Tech Selloff Deepens: Is the AI Boom Facing a Credit Reality Check?
The latest U.S. technology selloff is revealing a deeper problem than expensive stock valuations. Investors are increasingly questioning whether the enormous investment in artificial intelligence infrastructure can generate enough cash flow to justify its financing costs. This shift makes October’s correction fundamentally different from the July pullback.
1. July vs. October: Two Different Market Risks
In July, concerns centered on rising AI capital expenditure, crowded semiconductor positions,
QQQ-2.50%
SOXX-4.13%
SPX500-0.40%
US500-1.06%
CRWV-11.90%
Vance’s response says a lot. They asked whether he’d seen any corruption, and he pivoted to Trump’s business interests—basically, he didn’t answer. With this White House mess, the question was “What did you see?” and the answer was “What do you suspect?” Those are pretty far apart. Where should we set the stop-loss?
post-image
10.17$ETH
Last night's market action was like riding a roller coaster
Longs launched a fierce attack, then suddenly collapsed, smashing straight through 2400
Upside momentum faded; I cut losses decisively in time, exited at breakeven, and avoided a deep pullback
Price is now stuck in a narrow 2415-2425 range
Moving averages are converging near 2420, with bulls and bears evenly matched
Volatility is under 10 points—the calm before the storm!
The range is tightening and building momentum, with a major one-way breakout imminent
Watch the range closely; once volume expands and direction emerges,
post-image
ETH-0.51%
Gate square new creator Share to win red packet
post-image
Most people are watching silver and waiting for a breakout. I think it needs to take a dip first. That congestion zone from a year ago still hasn’t overlapped with anything, leaving a small gap in the structure. If it really moves up from here, that would be interesting. The iHnS on gold lines up too. The hardest part of trading isn’t calling the direction—it’s waiting for a signal you can actually understand. So what’s the takeaway? I haven’t figured it out yet either. If you’re keeping an eye on this, give me a follow.
post-image
XAG-0.12%
GLDX-0.12%
PAXG-0.17%
XAU-0.18%
Load More

Join 40 M users in our growing community

⚡️ Join 40 M users in the crypto craze discussion

💬 Engage with your favorite top creators

👍 See what interests you

Trending Topics

USSeptemberPPIBeatsExpectations

91.35k Views1.93k Discussing

US September PPI came in at 6.3% YoY, well above the 5.3% market expectation, pointing to renewed producer-side inflation pressure. Weekly jobless claims were 199K, broadly in line with forecasts. Could hotter inflation further reduce room for rate cuts, and what does it mean for $BTC, US stocks, and gold?

GateWCTCS9GlobalTradingCompetition

37.87k Views6.7k Discussing

GateBTCAndETHFuturesVolumeRanksTop3

53.8k Views1.82k Discussing

View More