





Square
Following
Hot
News
Profile
Share your thoughts
placeholder
Article
If I could leave just one note for $FIL today, it would be: don’t let +7.87% make the decision for you.
What’s really worth discussing is that $FIL remains strong, while the crowded trade is already out in the open. $FIL is currently at 1.172, up +7.87% over 24 hours. The 1-hour support is 0.9999, resistance is 1.1774, and current volume is 0.61 times the average volume of nearly 20 bars.
The 1-hour trend is strong, with RSI at 78; the 4-hour trend is strong, with RSI at 56. This combination makes me temporarily accept the following interpretation: I acknowledge that the trend is strong, but
post-image
FIL+8.61%
$CRCL Short Fades a Fresh Bullish MACD Cross Momentum Conflict
Pair: $CRCL /USDT
Direction: SHORT
Entry Zone: 77.89
Take Profit:
- TP1: 76.12 +2.3%
- TP2: 74.94 +3.8%
- TP3: 73.18 +6.0%
Stop Loss: 80.25
Chart Structure:
- CRCL declined steadily from ~86 through MA7, MA25, and MA99 to a low near 74.5, then recovered to current price, now consolidating just below the broken MA7/MA25 cluster
- MA99 (purple) remains above as declining resistance, not yet tested on this bounce
- RSI(14) recovered from the low-20s to the high-40s a decent, sustained recovery, not just a tick
- ⚠️ MACD has been d
CRCL+8.79%
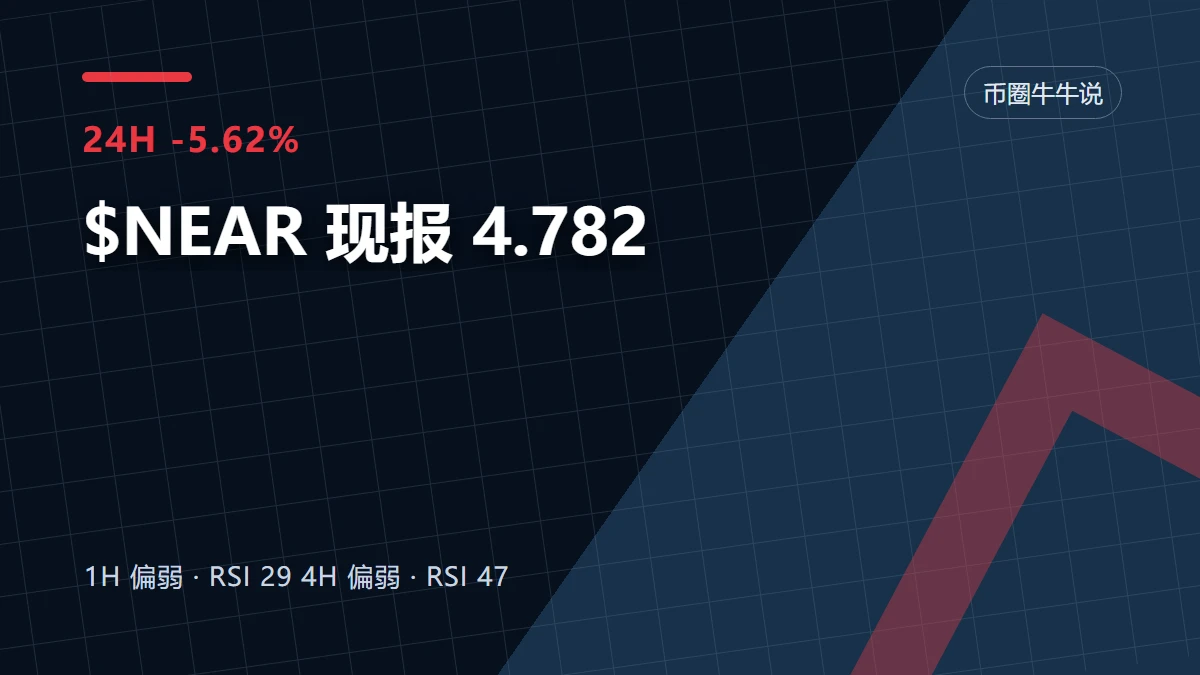
$NEAR NEAR Breaks Out of a 4-Year Descending Channel: TP1: $11
NEARUSDT
Weekly Time Frame:
NEAR (1W, log scale) is breaking out of the descending channel that has defined price action since the 2022 top, and the weekly candle is now pushing above the upper boundary.
What the chart shows:
After the 2022 high (~20.6), price spent years in a descending channel, bottoming around the 0.9 area in early 2026.
Since that low, price has risen sharply and is now trading at ~5.4, above the channel’s upper trendline.
The breakout is happening at the 2024 volume profile POC (~5.2), so the trendline and a h
post-image
NEAR+10.47%
$RENDER took decisive action, so the account performed better. This is a good reason to exit. Profits have been locked in. My daily watchlist: $BAT and $ETH .
post-image
RENDER+2.93%
BAT+28.31%
ETH+1.40%
Zero Hunters Crypto Lounge 🎯 | Historical Bangla Adda
live-cover
LIVE735
$SKY
SKY and LUNA look like they were cut from the same mold. Once the flywheel starts turning, SDEV follows, and they rise like dancing twins💃. But as soon as the wind shifts, the two immediately drag each other down, falling like conjoined twins. History has a way of delivering a sudden roundhouse kick when things are at their most euphoric; only after the bubble bursts do people slap their thighs and shout, “So that’s what happened”😅.
post-image
SKY+0.96%
Many people reflexively buy the dip as soon as they see a 15% drop in 24 hours, while ignoring broader market sentiment and sector correlation—this is the most typical trading misconception. The Fear and Greed Index is 53, neutral but leaning cautious. There has been neither panic selling nor greedy capital stepping in, so looking at a coin’s decline in isolation is meaningless at this point.
$AV Down 15.18% today, with a trading volume of only 6.2M USDT, a typical low-volume sharp drop. However, the technicals have not deteriorated: MA5=0.27448 remains above MA20=0.26686, so the medium-term
post-image
XPL+7.13%
On October 16 $ETH , the ETH strategy is actually very similar to the BTC view; both are headed in the same direction, as discussed during the livestream.
Currently, 2545 is the resistance level. After the decline from the October 7 starting point, there was a natural rebound high when the price fell to 2545. This high, 2586, is tentatively set as an anchor point. From the price action, 2545 was broken and reclaimed twice. The second time, the price did not touch the area above 2545, so we will enter short in the area of selling pressure here, taking shorts in the 2500–2530 range.
The hard sto
post-image
ETH+1.29%
  • 1
If you had put $10,000 into Richard Heart’s Hex token at the 2021 all time high you would only have $11 left and be down over -99.9%.
post-image
SOL oscillated downward from the earlier high of 124.99, with the intraday low dipping to 100.51 before a slight rebound, reaching a high of 106.49. This rebound is merely a minor corrective bounce during the decline; the overall broader downtrend channel remains intact, and a rebound to resistance presents an opportunity to enter short.

From the chart, the daily highs have been gradually moving lower, and the bearish trend structure remains intact. This rebound is only a brief pause amid the decline. MACD remains weak and trending downward, while heavy pressure from previously trapped posit
post-image
SOL+1.14%
With the same 1000U, some people are holding the bag at $WAL 0.0677, while others who bottom-fished at 0.0502 are already laughing. It is now 0.0512, down 15.7% in 24 hours, with a 565M trading volume—what does that indicate? Panic sellers are fleeing, but with selling this fierce, who is taking the other side?
Round one: the volume showdown. A 565M trading volume at this market-cap level means the turnover rate has been pushed to the limit. Rising volume during a decline either means the main players are unloading or that the market is shaking out and rotating holders. What is the difference
WAL-21.09%
$QNT
A steady grind lower all the way, with longs liquidating longs—everyone trying to catch the falling knife got buried.😤 A rebound to 213.7 is the window to escape; if 201.8 breaks, it will head straight down. Don’t wait until the waterfall comes to run.
post-image
QNT-0.02%
I can't be the only one 😭
post-image
Range-bound SKHYNIX is about to break out and most traders are positioned the wrong way.

$SKHYNIX /USDT - SHORT

Trade Plan:
Entry: 971.37 – 978.79
SL: 1010.69
TP1: 948.37
TP2: 930.56
TP3: 903.85

Why this setup?
Why now? The daily trend is range, but the 1h ATR of 14.839521 signals a squeeze is building inside that range. The 15m RSI at 58.85 shows momentum is not yet exhausted, so a short entry near 975.08 is valid as long as we stay below 978.79. TP1 at 948.37 and TP2 at 930.56 define the first two targets on the path down, while the invalidation level of 1156.63 is the hard line that w
SKHYNIX-4.76%
Are you tired of watching me win yet?! 🏆
We are just getting started! ✅️
Let's go make that money! 💰
Structure, no smoke! 🔥🐶🔥
Many people see the funding rate turn positive and MACD turn green and automatically assume “the bulls are back,” then chase in with oversized positions—this is the most common position-sizing mistake: treating indicator direction as an entry signal while ignoring the moving-average structure and volatility levels. $BERA is a textbook example of this trap.
First, the structure: current price 0.2284, MA5=0.2311 remains below MA20=0.231595, and the short-term moving average has not crossed above, meaning the bearish alignment has yet to be repaired; RSI=47.3 is stuck in the neutral-to-weak zone
post-image
BERA-6.12%
elysium will be a lot of fun
you can already invest in elysium by accumulating kinetiq:native and nest-2:native
post-image
1016 $DOGE Recent entry position for DOGE—just look at the daily chart. Every time the broader market makes any move, DOGE starts falling in advance.
I've bought at 0.06888 many times before and played the August range quite a bit. The last time, I held DOGE until it started moving at 0.083 and then exited. I haven't really watched DOGE since, because I think DOGE can sometimes be difficult to trade short-term.
We'll continue placing long orders around 0.06888 and 0.07, with a stop loss at the bear-market low of 0.067. Keep the stop-loss range slightly wider. Leave this long-term lottery orde
post-image
DOGE-0.55%
$HYDX looks great here. The market caused lot of quality RH plays to fall a bit but despite that holding pretty good strength overall. Many projects bouncing so I expect HyperDex too here eventually.
post-image
CPI Comes in Hotter Than Expected
live-cover
LIVE88
Load More

Join 40 M users in our growing community

⚡️ Join 40 M users in the crypto craze discussion

💬 Engage with your favorite top creators

👍 See what interests you

Trending Topics

USSeptemberPPIBeatsExpectations

91.35k Views1.88k Discussing

US September PPI came in at 6.3% YoY, well above the 5.3% market expectation, pointing to renewed producer-side inflation pressure. Weekly jobless claims were 199K, broadly in line with forecasts. Could hotter inflation further reduce room for rate cuts, and what does it mean for $BTC, US stocks, and gold?

DrLinHanSpeaksAtOxfordUnion

135.63k Views1.86k Discussing

JapanAndKoreaStocksPlunge

47.27k Views1.76k Discussing

View More