Share your thoughts
placeholder
Article
I did nothing—just went to the restroom, and when I came back, the candlestick chart had already done the work for me. A few days ago, I glanced at $SKHYNIX before bed. The price was right around 1202.67; the key level held, the pullback stabilized, and funds were quietly flowing in—not being advertised to you with one huge bullish candle. While everyone else was running, I instead felt it had an opportunity. When I opened the chart today, it had clearly moved above 1283.25, and +476.57% had simply landed in my account. This profit feels great—staying up late was worth it. Take 80% off the tab
post-image
SKHYNIX+0.26%
ZEC+20.11%
SNDK+0.79%
#GateTops7DayNetInflowsGlobally
💰 CAPITAL FLOW IS SPEAKING — BUT BTC STILL HAS TO CONFIRM THE MESSAGE
One of the biggest mistakes traders can make is watching only the price chart.
Price tells us what is happening.
But capital flow can sometimes tell us where market participants are positioning themselves.
That is why Gate’s latest net-inflow data has caught my attention.
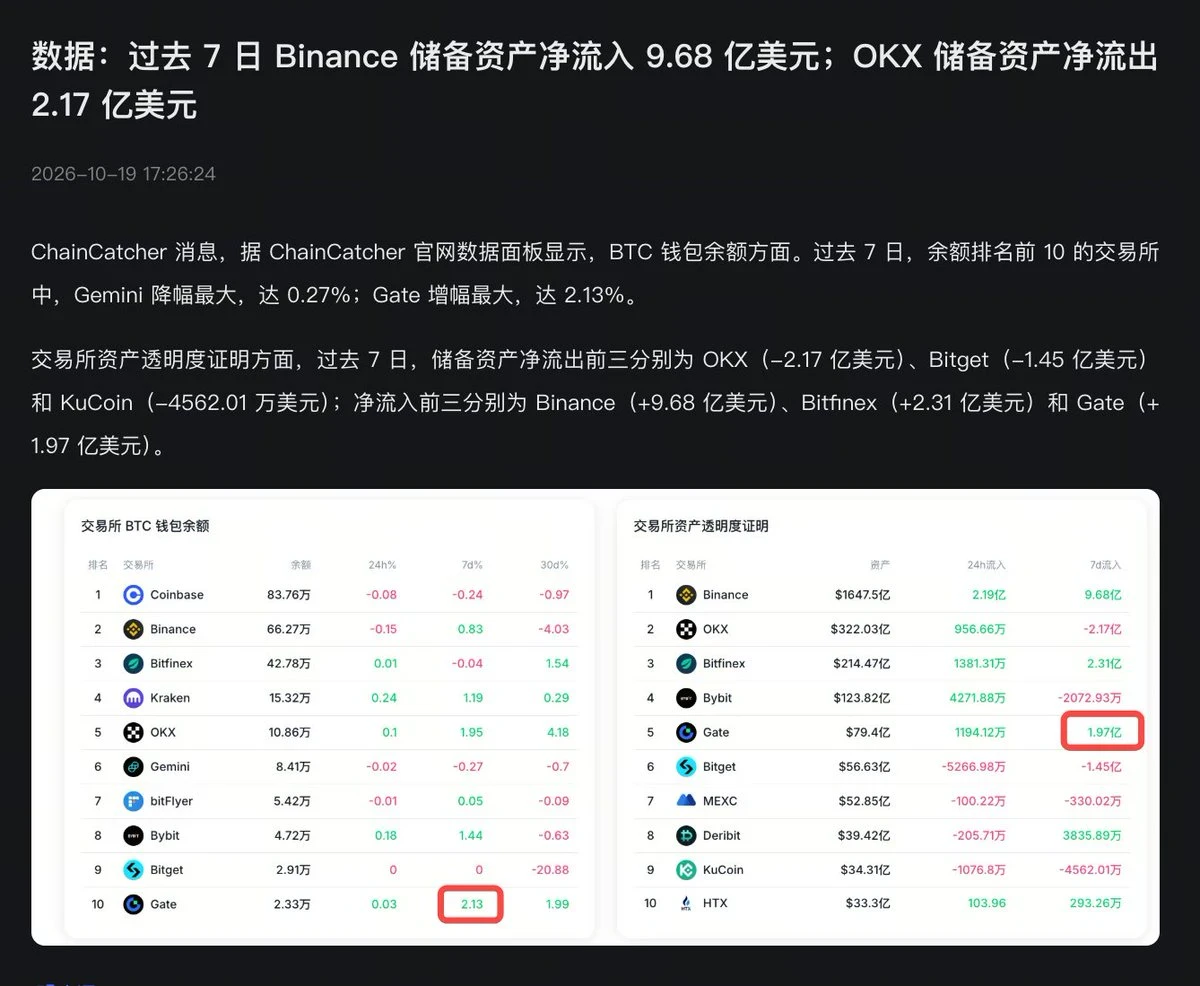
According to recent DeFiLlama-based data reported by Gate, Gate recorded approximately $520.45 million in net inflows over the past month, placing it #3 globally among centralized exchanges.
Earlier August data also showed
BTC+0.50%
ETH-2.49%
Rewards are being distributed! Open your mystery box now and win up to 100 USDT worth of tokens! https://www.gate.com/referral/earn-together/invite/UFRFAQ0M?ref=UFRFAQ0M&ref_type=103&utm_cmp=rXJBDjtJ&activity_id=1788357807948
post-image
  • 2
Everyone’s staring at TAO’s 260.5, but the real trap is the range you’re ignoring.

$TAO /USDT - SHORT

Trade Plan:
Entry: 259.2 – 261.8
SL: 276.3
TP1: 248.7
TP2: 240.8
TP3: 229.0

Why this setup?
Why now?
- 1D trend is *range*, not trend—so the 77% SHORT bias is a mean-reversion play, not a breakout.
- 4h structure pins entry at 260.5 with tight 1h ATR (5.05)—volatility is compressing, which precedes a snap.
- RSI 15m at 54 shows no exhaustion yet, but price is stalling under range highs; TP1 at 248.7 is a 4.5% drop, not a gamble.

Debate:
If range holds, do you fade the first touch
TAO+12.35%
Important Reminder❗
The US stock market will be closed on Monday for the Labor Day holiday.
Here is a brief overview of the practical impact on the market:
1. With the US stock market closed, there will be no movement in US market trading on Monday night, macro news flow will be relatively light, and liquidity will decline significantly.
2. Although gold and crude oil will not be closed for the entire day, they will close early. Liquidity will shrink late at night, increasing the likelihood of slippage and sudden price spikes. Try not to leave large positions open until late at night.
3. Some
post-image
CL+0.31%
XAU-0.14%
  • 1
I was just about to go to the forum and rant, but then I saw my balance and thought, forget it—the market is always right. 😂
A few days ago, it was still barely holding on before bed. Every rebound seemed to lack that final push, while volume quietly shrank. At a level like this, not opening a short position would have been hard to justify. Entry reference: 0.17647. When I opened the chart this morning, the price had plunged straight to 0.04593, and the short position was already showing +1457.07% unrealized profit. This profit feels great. 🔥
Take profits steadily; don't get greedy for the l
post-image
SOL+3.10%
LAB-3.68%
This drop in $HEMI essentially completed the short thesis. My entry wasn’t ideal—I only confirmed resistance around 0.016097—but I still entered when the second rebound failed to break the previous high. My judgment at the time was that the center of gravity at the highs kept moving lower, so it would eventually choose a direction.

After entering the short, I initially took a small floating loss and felt somewhat uneasy. But seeing key levels continue to rise, and comparing that with the heavy selling pressure above, I still chose to hold on a little longer. When the market truly began break
post-image
HEMI+4.31%
ETH+1.32%
SNDK+0.79%
Everyone’s eyeing BNB at 750—but the 4h chart is silently screaming “trap” while the daily range holds its breath.

$BNB /USDT - SHORT

Trade Plan:
Entry: 749.30 – 751.40
SL: 760.45
TP1: 742.77
TP2: 737.72
TP3: 730.14

Why this setup?
- Price is pinned at 750.35 with a 1D range, yet the SHORT bias (conf 55) targets a clean drop to 742.77 first.
- RSI on the 15m is only 56.1—no overheated bounce fuel, while ATR (4.2) shows volatility is compressed, priming a snap.
- Why now? The “waiting” status means the entry zone (749.30–751.40) is the exact battlefield; a rejection here flips momentu
BNB-1.65%
I wasn't even expecting to break even, but it ended up putting me straight into profit. This service is seriously on point.😂$DOT has been grinding back and forth at the highs this time. When it plunged intraday, I watched the chart and noticed that every push higher looked staged—the volume couldn't keep up, and buy orders were sparse. Classic lack of support. If I didn't short this kind of market, I'd feel I was letting my position down.😏
The short opened at 1.193—just checked, and the current price is 0.971, with +1314.43% secured. This profit feels great, guys. Those still on the train mu
post-image
DOT+6.10%
DOGE+0.97%
BTC+0.51%
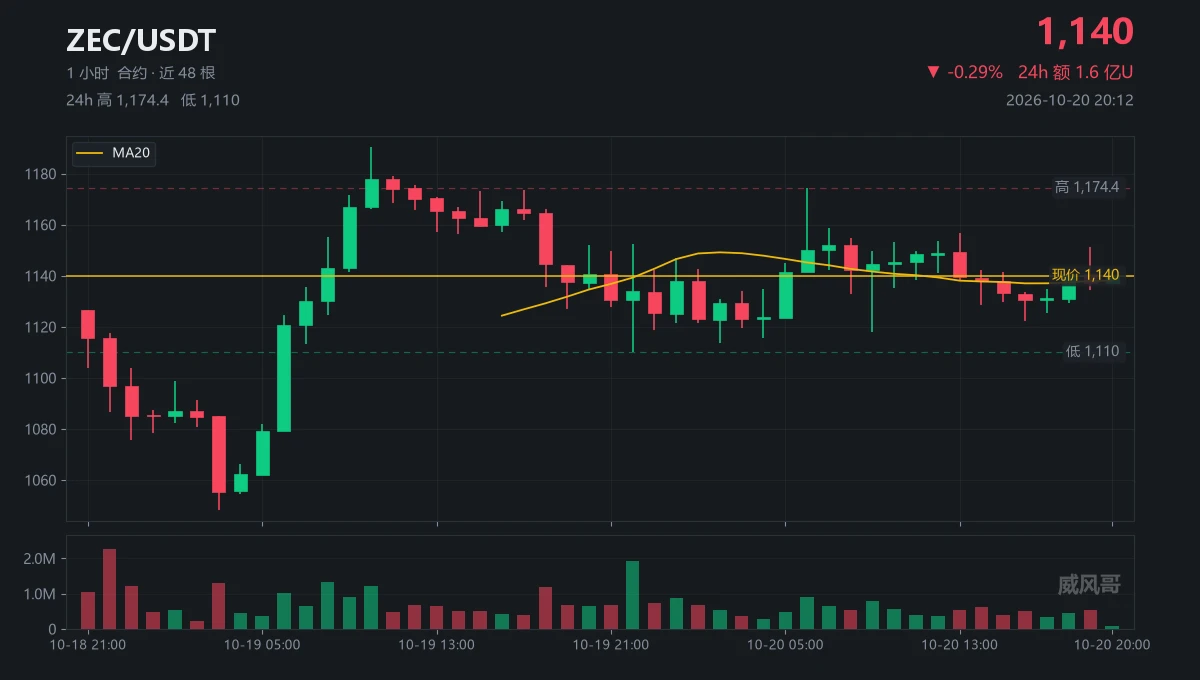
Privacy leader #ZEC pumped again 🥲 The good news is that it’s up 6x since we entered ✌️ The bad news is that the short grid entered at 10XX is at an unrealized loss 🥲 You really can’t short it even a little! Market maker, are you still pumping because you want to surpass Bitcoin? $ZEC
post-image
ZEC+20.11%
  • 1
This is a problem—I ended up with a Heaven-and-Earth lock, and there’s no way to unlock it.
post-image
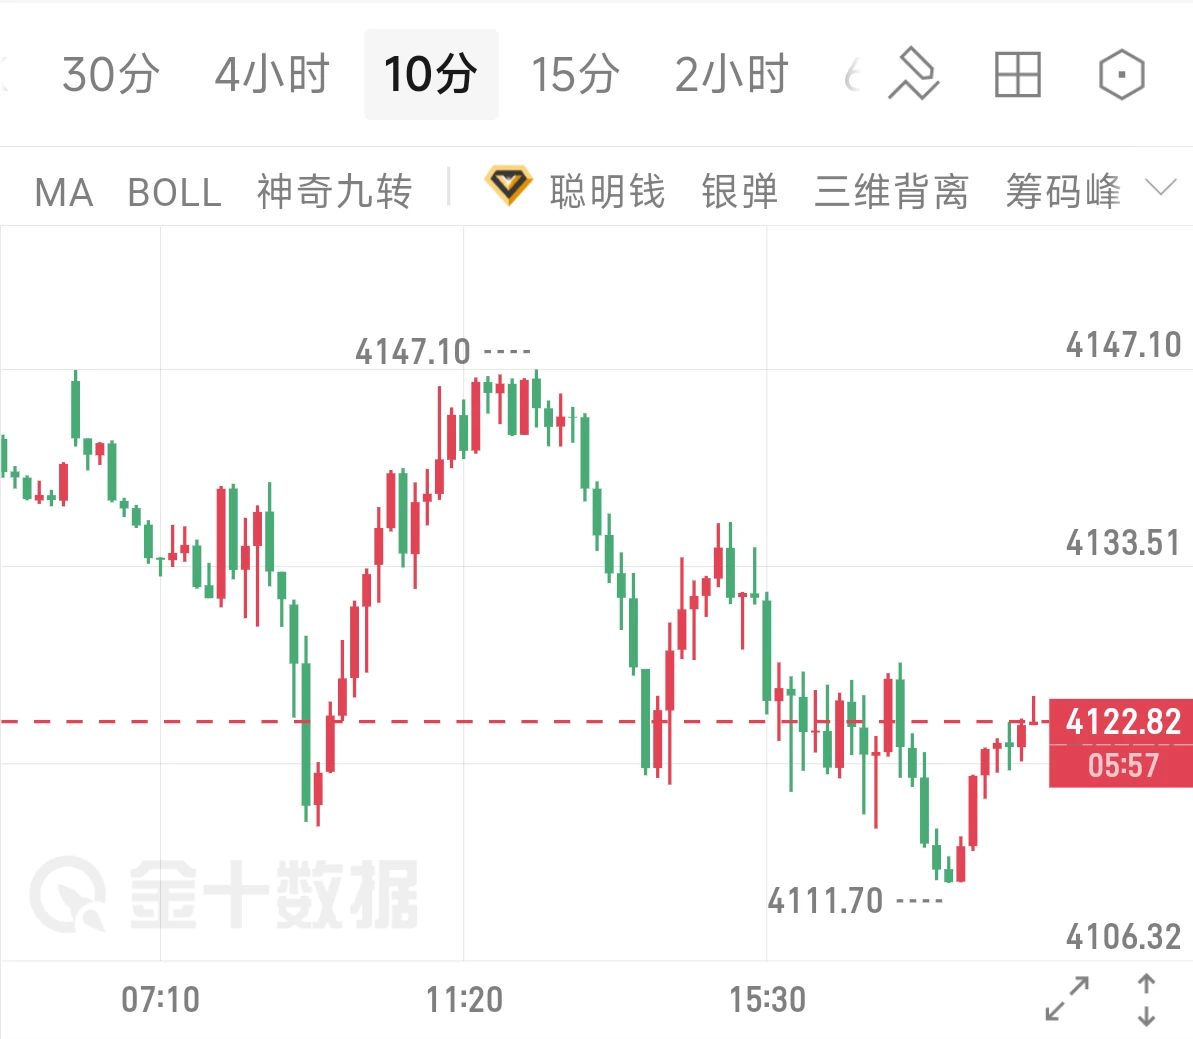
Gold Pulls Back to Build Momentum, Awaiting a Breakout Amid Rate-Hike Expectations
The four-hour chart shows that gold prices pulled back after touching a high of $4,696 and are currently trading near the middle Bollinger Band. The RSI is in neutral territory, indicating that buying and selling forces are temporarily balanced, with the short-term direction awaiting breakout confirmation.
At the news level, the market is closely focused on the Federal Reserve’s September interest-rate decision, with expectations of whether to raise rates repeatedly shifting. Various U.S. economic data continue
post-image
XAU-0.14%
Show me your folder. 📁👇
Drop the 1 coin that's been in every cycle with you.
🟠 BTC?
🟣 ETH?
⚫ SOL?
🐶 DOGE?
💧 something nobody's heard of?
#BiconomyCom #Crypto #BullRun #Web3 #Altcoins
BTC+0.50%
ETH+1.33%
SOL+3.11%
DOGE+0.96%
  • 1
$JASMY held the horizontal support + the 50 daily moving average like a pro.
I can’t wait for tomorrow to explain how bullish this is 😊📈🚀
post-image
JASMY+0.36%
$ARB Signal】1H pullback to EMA20 + 4H bullish continuation
$ARB 1H pullback to EMA20, current price 0.18475; the 4H MACD histogram at 0.0032 is narrowing. Order book imbalance is -4.41%, 1H RSI 55.35 is neutral, funding rate is 0.0065%, OI is stable, and short-term leverage is not crowded. The 1H MACD negative histogram is contracting, with price consolidating between 0.1805-0.1850.
🎯Direction: Long
⚡Entry/Limit Order: 0.1841957 - 0.1847500
🛑Stop Loss: 0.1755125
🚀Target 1: 0.1986063
🚀Target 2: 0.2055344
🛡️Trade Management:
- Execution Strategy: After reaching Target 1, reduce the positio
ARB+6.67%
This return has me feeling nervous, worried the market might come to its senses tomorrow and blacklist me.
With the screen glowing green, $SNXX consolidated around 13.489. No matter how I looked at it, it seemed ready to break down. But I noticed that every dip was met with buyers, while volume was quietly cooperating; it was moving sideways at the bottom without breaking down—this structure wasn’t bearish, so I should be watching for longs instead. Once the market stabilized a little, I opened a long.
I didn’t expect it to surge straight to the current 18.223, with unrealized gains of +1693.
post-image
SNXX+1.85%
ETH+1.32%
LAB-3.68%
XRP just faked a breakout—the 4h chart is screaming SHORT at 1.417.

$XRP /USDT - SHORT

Trade Plan:
Entry: 1.415 – 1.419
SL: 1.438
TP1: 1.401
TP2: 1.390
TP3: 1.374

Why this setup?
The range-bound 1D trend is your tell. Price sits at the upper lip (1.419) with RSI 15m at a limp 50—no momentum to push higher. ATR 0.0088 shows volatility is compressed, meaning a snap back to TP1 (1.401) is the path of least resistance. Why now? The entry zone is tight, and the "Waiting" status means the trap is set before the next candle.

Debate:
Are you fading this push to 1.419, or waiting for a close ab
XRP+0.60%
solana:FtHCpYdjVx8WR6vc4zqe6iXqHydZcKhNnmSNF2NXKfy1 big pump coming
10x
TcnKFgDZc6RhAz83JHHbWeZ5wLc2at8iHK6FhsxkTLh
Keep buying the dip
#crypto #memecoin $sol $btc
post-image
SOL+3.11%
MEME-1.39%
BTC+0.50%
Load More

Join 40 M users in our growing community

⚡️ Join 40 M users in the crypto craze discussion

💬 Engage with your favorite top creators

👍 See what interests you

View More