


Share your thoughts
placeholder
Article
No big-picture thinking, can't hold on, the profits on this move are paper-thin, but I love it to death.

A few days ago, I took one last look before bed and $PONS had already reached around 0.4775. Support underneath was becoming increasingly evident, clearly showing that funds were quietly entering. I didn't overthink it—I placed the order, set the stop-loss, turned off the light, and went to sleep. When I opened my eyes the next morning, the market had indeed not disappointed.

The market is won by waiting, and profits are made by holding on. Panic comes from having no plan; losses come
post-image
PONS-1.55%
XRP-1.91%
BTC-2.13%
Guys, today is day 30 of earning living expenses with 30U, and my total assets are currently 29U
Put down another 30U
But don’t panic
Already positioned, waiting for Monday
post-image
I’ve already accepted that some of my friends have mediocre alcohol tolerance.
But every now and then, they still want to test their drinking tolerance against mine🤡
post-image
Bitcoin News | Bitcoin rebounded $3,255 from a low of $76,046 following the CPI release, breaking pa
live-cover
LIVE1,636
Could a big bro tip me a little? u, wish me a return to the top.
Dao Lang’s team’s “Folk Songs Across Ten Thousand Miles” concert has ended after 2 hours. It was amazing, receiving 490 million likes in 2 hours—truly incredible. The next stop of the tour will officially begin at the Shenzhen Sports Center Gym from October 2 to 3🐷🐷🐷
post-image
#GateMeme
#每周来晒
The collective pullback of popular Memes on Robinhood Chain (such as PONS and MEME) is essentially the combined result of short-term profit-taking, cooling market sentiment, and capital rotation. This pullback contains an element of shakeout, while also genuinely reflecting declining market hype.
I. Analysis of the Pullback: Shakeout and Cooling Sentiment Coexist
1. Profit-Taking and Cooling Sentiment (Primarily Cooling Sentiment)
Profit-taking: Previously popular Memes posted substantial gains, and some investors chose to take profits after prices reached highs, increasing
post-image
ThisIsTranslateContent:
#GateMeme The collective pullback of popular Memes on Robinhood Chain, such as PONS and MEME, is essentially the combined result of short-term profit-taking, cooling market sentiment, and capital rotation. This pullback reflects both some degree of shakeout and a genuine cooling of market enthusiasm.
I. Analysis of the Pullback: Shakeout and Cooling Sentiment Coexist
1. Profit-Taking and Cooling Sentiment (Primarily Cooling)
Profit-taking: Popular Memes posted massive gains earlier, and some capital chose to take profits after prices reached highs, increasing selling pressure and directly triggering the pullback.
Sentiment ebbing: Meme coins are highly dependent on market sentiment and capital inflows. As the earlier FOMO (fear of missing out) sentiment faded, market sentiment began to cool, and some momentum-chasing traders exited, causing prices to fall.
Capital rotation: Market hotspots rotate, with capital flowing to other chains, such as BSC and Solana, or to new projects, leading to a decline in localized enthusiasm for Robinhood Chain.
2. Changes in Market Structure and Shakeout (Some Shakeout Element)
Market clearing: The Meme market follows the “80/20 rule,” and many “shitcoins” lacking real value support rapidly go to zero after enthusiasm fades. This pullback is a process of eliminating weak coins and shaking out speculative positions, while some higher-quality or strongly narrative-driven assets may recover after the shakeout.
Mechanism test: The pullback of some platform tokens, such as $PONS , also tests the actual support provided by mechanisms like “buybacks funded by transaction fees” after enthusiasm fades. The pullback itself is also a process of market repricing.
II. Outlook: Short-Term Volatility, Long-Term Divergence
1. Short-Term Risks Remain High; Bottom-Fishing Requires Caution
Sentiment-driven risks: Meme coins lack fundamental support, and their prices are highly vulnerable to short-term sentiment and whale activity. Further downside remains possible after the pullback. “Shitcoins” lacking a strong narrative may go directly to zero, so blindly bottom-fishing sentiment-driven coins should be avoided.
Broad-market correlation risk: The overall trend of the crypto market, such as Bitcoin’s price movement, will directly affect the performance of on-chain Memes. If the broader market continues to weaken, the magnitude of the Meme pullback may increase further.
2. Long-Term Value Divergence; Select Targets Carefully
Focus on assets with real support: Some assets with practical product logic and the ability to capture genuine on-chain trading volume, such as certain platform tokens, may have some recovery potential after the shakeout. However, investors should wait for market sentiment to recover and capital to flow back in.
Focus on ecosystem value: The pullback in Robinhood Chain is primarily a pullback in the Meme sector. Progress in its on-chain RWA (real-world assets) and DeFi ecosystems will determine the chain’s long-term value.
III. Recommendations: Primarily Wait and See, Strictly Control Position Sizes
Wait and see: For ordinary investors, it is advisable to primarily wait and see, and make decisions only after market sentiment has fully stabilized and the broader market trend has become clear, avoiding blindly bottom-fishing and becoming trapped in a downtrend.
Strictly control position sizes: Use only idle funds you can afford to lose, test the waters with small positions, and set strict stop-loss levels. Never take large positions to gamble on a rebound.$PONS ‌
repost-content-media
PONS-1.55%
new market update
live-cover
LIVE1,573
Technical Tutorial
Lesson 1 — How to Read Candlestick Charts
Candlesticks show the price movement over a specific period of time.
They contain 4 core data points:
• Open — opening price
• Close — closing price
• High — highest price
• Low — lowest price
Green candlesticks (bullish candles) — Buyers are in control.
Red candlesticks (bearish candles) — Sellers are in control.
Wicks represent price levels that were reached but subsequently rejected and pushed back.
Remember: A single candlestick reveals the battle between buyers and sellers. When multiple candlesticks are combined, they clearly t
China CITIC Bank is really coming through
Today I paid for Apple on someone else’s behalf, and they immediately raised my credit limit after the payment
On the other hand, SPDB is ridiculous—even with available credit, it still won’t let me make the payment
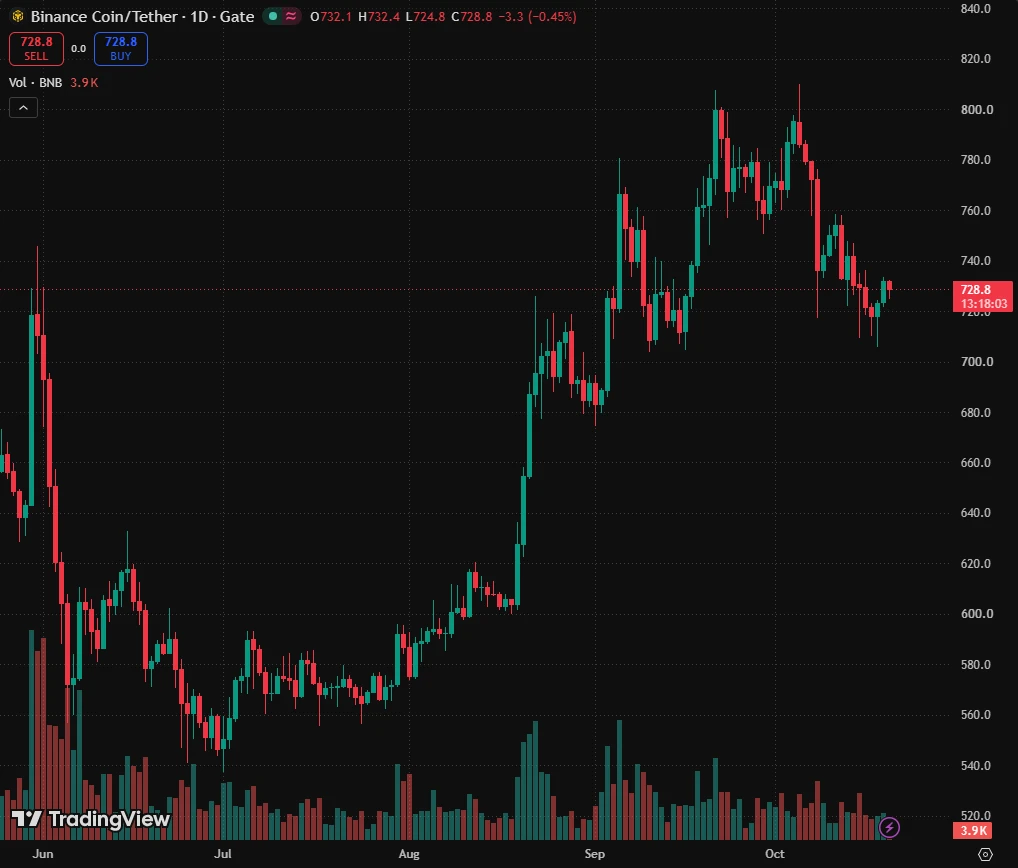
Why is everyone ignoring the SYMBOL signal that just flipped bullish on the daily?

$BNB /USDT - LONG

Trade Plan:
Entry: 733.74 – 735.76
SL: 725.04
TP1: 742.04
TP2: 746.89
TP3: 754.18

Why this setup?
Why now? The daily trend is bullish with a 95% confidence score, and the 1h price is sitting at 734.75 right inside the entry zone of 733.74 to 735.76. The 15m RSI at 54.59 shows room to run before overbought, while the 1h ATR of 4.047669 confirms enough volatility to push toward the first target at 742.04. A break above that opens the path to the second target at 746.89, but the trade is inv
BNB+0.40%
#WeeklyShare
CPI REACTION: WHAT IT ACTUALLY MEANS FOR CRYPTO AND STOCKS
THE TAPE
August CPI landed on 11 September and the first move was hawkish. Bitcoin opened Friday at $76,529, dipped to $76,040 within minutes of the print, then reversed hard climbing as high as $79,837 before settling the session near $79,007, a 3.24% gain. Equities followed the same shape: the S&P 500 had closed 0.58% lower at 7,591.70 the day before, its fourth straight decline, yet by Friday's close the Dow had added 622 points (+1.2%), with the S&P 500 and Nasdaq each up 1.1%.
THE THREE CHANNELS THAT ACTUALLY MOVE CR
post-image
  • 2
  • 1
For this $ETH long trade, I entered around 2394.32. The idea was simple: after the previous high broke out, the pullback held, so I followed the structure for a move. During the holding period, there were false breakouts and stop-loss sweeps, but the key level held throughout.

I’m now up +1066.94%. I’ll first take profit on 70% and stay long. I’ll watch whether the remaining position can reclaim and hold above the key level. If it holds, I’ll continue holding; if not, I’ll exit.

My biggest takeaway after entering is: don’t let short-term wicks push you around. If the structure hasn’t chang
post-image
ETH-2.57%
BTC-2.13%
DOGE-1.76%
*📰 TODAY IN HISTORY*
_📆 — September 12_
*📜 Events:*
* 490 BC — Battle of Marathon: Athenians and Plataeans defeat the Persians.
* 1297 — The Treaty of Alcanizes is signed, defining the border between Portugal and Castile.
* 1631 — The Naval Battle of Abrolhos takes place off the coast of Pernambuco.
* 1683 — Battle of Vienna: European forces defeat the Ottoman Empire.
* 1711 — The French fleet of René Duguay-Trouin attacks Rio de Janeiro.
* 1943 — Benito Mussolini is rescued by the Germans in Operation Oak.
* 2013 — NASA confirms that Voyager 1 has entered interstellar space.
*⭐ Births:*
*
post-image
XRP-1.90%
XLM-0.75%
#交易机器人 This trade doesn’t look right: placed a limit order at 0.145, filled at 0.137, take profit at 0.135, profit of $3?
post-image
Why is SYMBOL sitting at 2.3596 when the 1d trend screams bullish?

$NEAR /USDT - LONG

Trade Plan:
Entry: 2.3480 – 2.3712
SL: 2.2479
TP1: 2.4434
TP2: 2.4992
TP3: 2.5829

Why this setup?
Why now? The 1d trend is already bullish, but the 1h price is still hovering at 2.3596, meaning the big move has not yet arrived. The 15m RSI at 45.13 shows the short term is not overbought, leaving room for a clean push. The 1h ATR of 0.046531 tells us the next candle could easily span the gap to TP1 at 2.4434. If momentum holds, TP2 at 2.4992 becomes the real target, but the trade is invalidated the momen
NEAR-9.57%
$BTC After A is done, it is still crawling on the floor
But the 2 strong performers
$BNB $UNI have already returned to yesterday's high.
BTC-2.06%
BNB+0.36%
UNI+0.39%
$BNB TO $5,000? The Dip Everyone Should Be Watching!
#BNB remains super bullish above the 0.786 FIB support near $300. If price revisits this level, I would personally consider buying more for my long-term holdings.
The HTF chart shows years of consolidation, accumulation, and breakout development. As long as the broader bullish structure remains intact, deeper pullbacks may offer strategic accumulation opportunities.
My Long-Term Targets: $2,000 → $3,000 → $5,000
A decisive breakdown below the major $200 support region would weaken this bullish thesis. Until then, every meaningful dip could b
post-image
BNB+0.36%
  • 1
🚨 JUST IN: Robinhood Chain $HOOD hit a new all-time high of $531 MILLION in daily perpetuals volume yesterday.
post-image
HOOD-2.43%
🔥Before I knew it, the subscription has reached its 4th year; the year's lowest 5.5gt half-price offer ends tonight‼️ Both longs and shorts made money this month‼️ Click 👇 to close positions
————————————————
🎉https://www.gate.com/zh/profile/Clear spring flows beneath the stones
————————————————
🔥 Last week, longed at 62800/1865 and 76500/2355, then 82250/2565, making over 1 million
🔥 Last night's CPI wick: longed at 75900/2435, rode the rise to 79850/2640, and took profit at resistance📈
🔥 Switched to a precise short at 79850/2640; today, took profit at 76850/2505
🔥 Shandi: longed at 14
  • 10
Load More

Join 40 M users in our growing community

⚡️ Join 40 M users in the crypto craze discussion

💬 Engage with your favorite top creators

👍 See what interests you