

Square
Following
Hot
News
Notifications
Profile
Share your thoughts
placeholder
Article
#Ethereum
Ethereum (ETH): Can the Market Recover?
Ethereum (ETH), the world's second-largest cryptocurrency, is currently trading around $1,627.68, down approximately 7% over the last 24 hours.
ETH is facing selling pressure due to broader market weakness and investor uncertainty. However, Ethereum's strong blockchain ecosystem, DeFi adoption, smart contracts, and institutional interest continue to support its long-term potential.
Price Prediction: If ETH holds the $1,550–$1,600 support zone, a recovery toward $1,700–$1,800 could become possible. However, losing support may expose ETH to furth
ETH-1.26%
  • 3
rotated more cash into my ETFs yesterday
trend is your friend, no individual stocks for now
$SPX $NASDAQ
SPX+0.33%
Trenches
FIONA
F
bade
b
FIONA
B34n...pump
Market Cap
$.
Change
.
24h Vol
$.
Holders
.
PIEVERSE
P
bade
b
PIEVERSE
0x0e...25a9
Market Cap
$.
Change
.
24h Vol
$.
Holders
.
mihao
m
bade
b
mihao
4Cxj...pump
Market Cap
$.
Change
.
24h Vol
$.
Holders
.
CLAUDIA
C
bade
b
CLAUDIA
2j5S...W2ZM
Market Cap
$.
Change
.
24h Vol
$.
Holders
.
IDOL
I
bade
b
IDOL
0x3b...ab07
Market Cap
$.
Change
.
24h Vol
$.
Holders
.
BTC MARKET PREDICTION
live-cover
LIVE1,780
BTC-0.67%
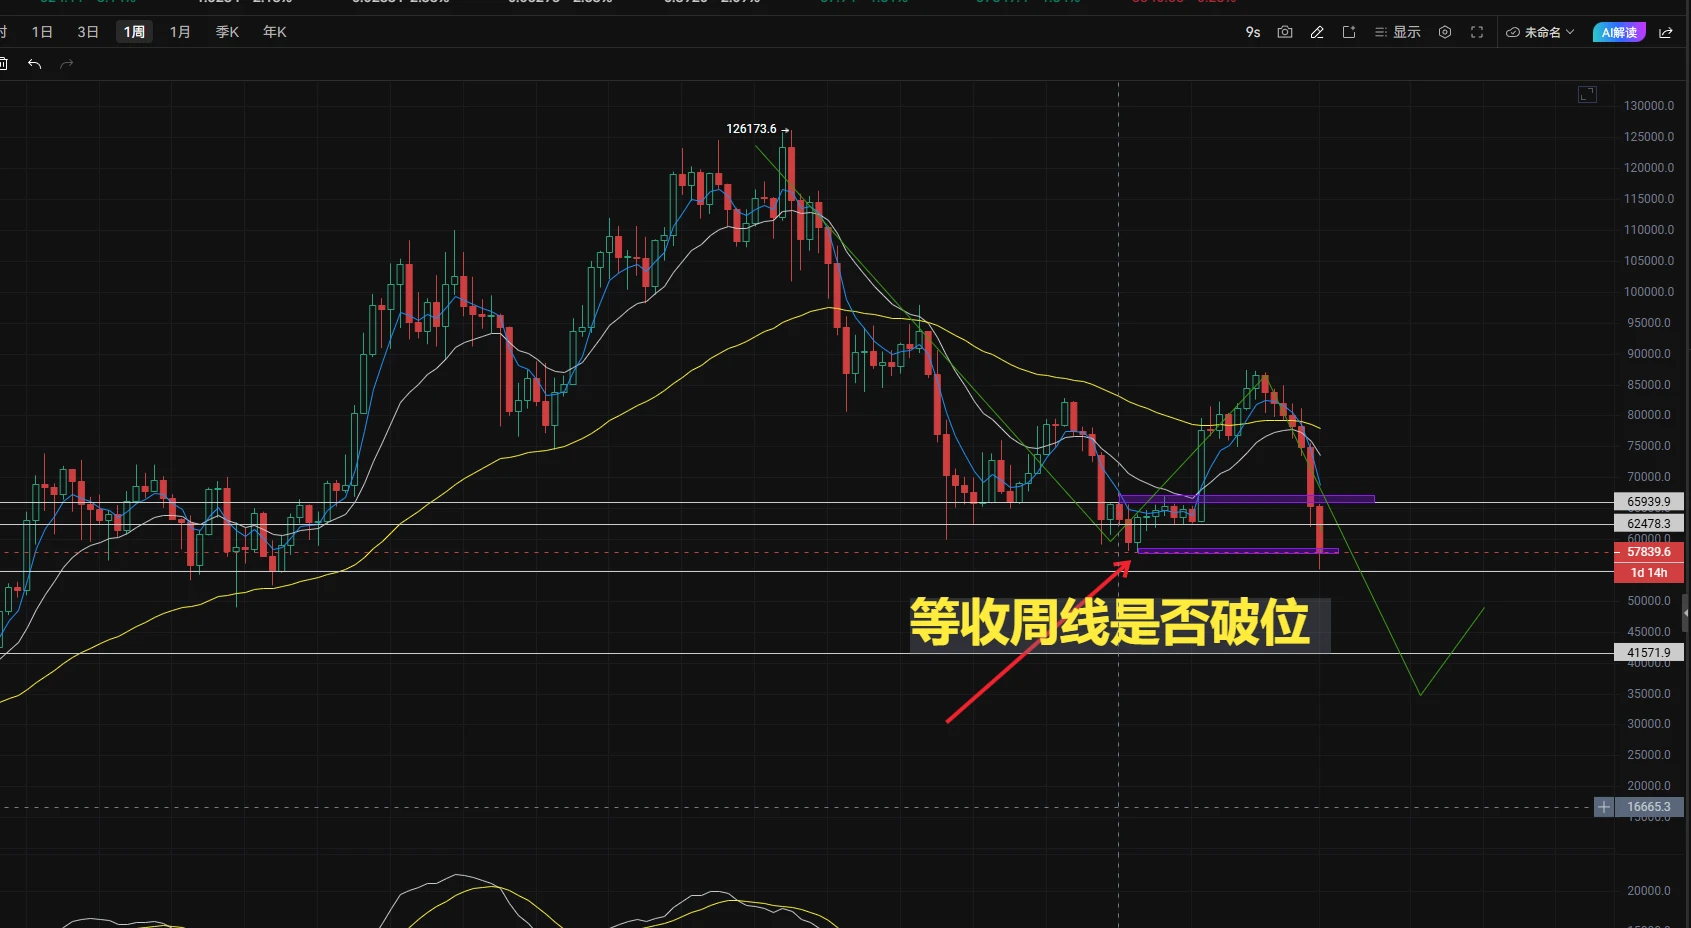
Bitcoin November 21 evening outlook:
As mentioned in the previous video, once spot reaches 5.5, add another tranche. Then add one tranche for every 5,000 or 8,000 points it drops. It has now rebounded to the daily-chart structure zone, the 587–578 range. Watch for bearish candles to form here. The weekly candle closes on Monday; let’s see if price can break below this zone. A break below would set the stage for the weekly chart to continue lower in a larger structure. Wait patiently for the close. Over the past nearly three years, whenever the weekly chart breaks a key level, it has continued
post-image
BTC-0.65%
ETH-1.23%
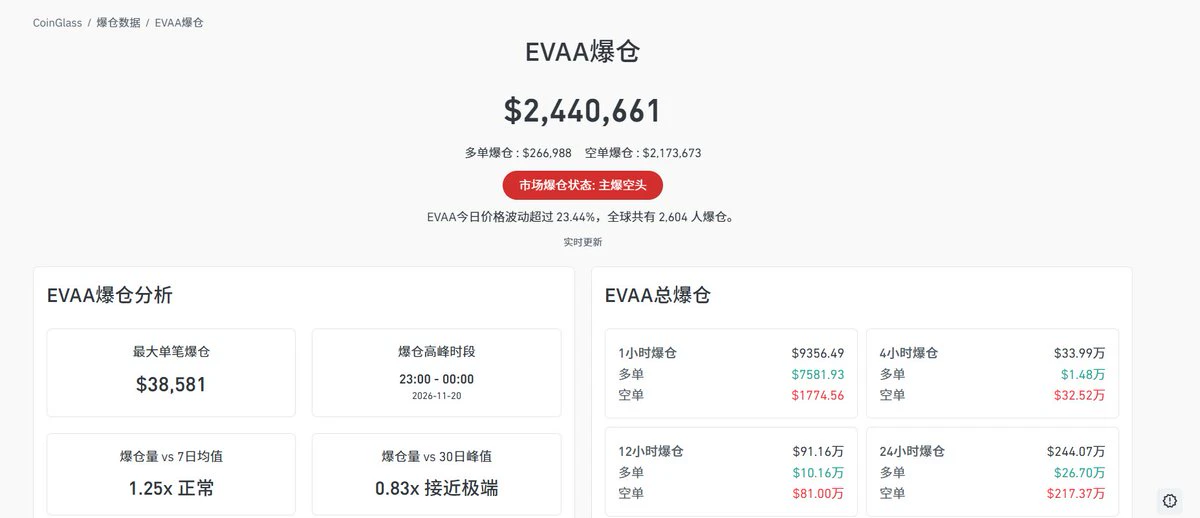
$EVAA It’s still pumping—this is getting ridiculous! The broader market is falling, but it keeps climbing and is already at 6.5.
With price action like this, I really don’t dare open a short casually. Hesitate for even a moment and it’ll reverse and squeeze you out. Feels like the whales won’t stop until they’ve completely shaken out the shorts.
But the more it keeps rallying like this, the more wary you need to be of a pullback from the highs. Chasing longs now doesn’t offer a great risk-reward ratio, and you definitely shouldn’t blindly open a short either.
post-image
EVAA-0.42%
  • 1
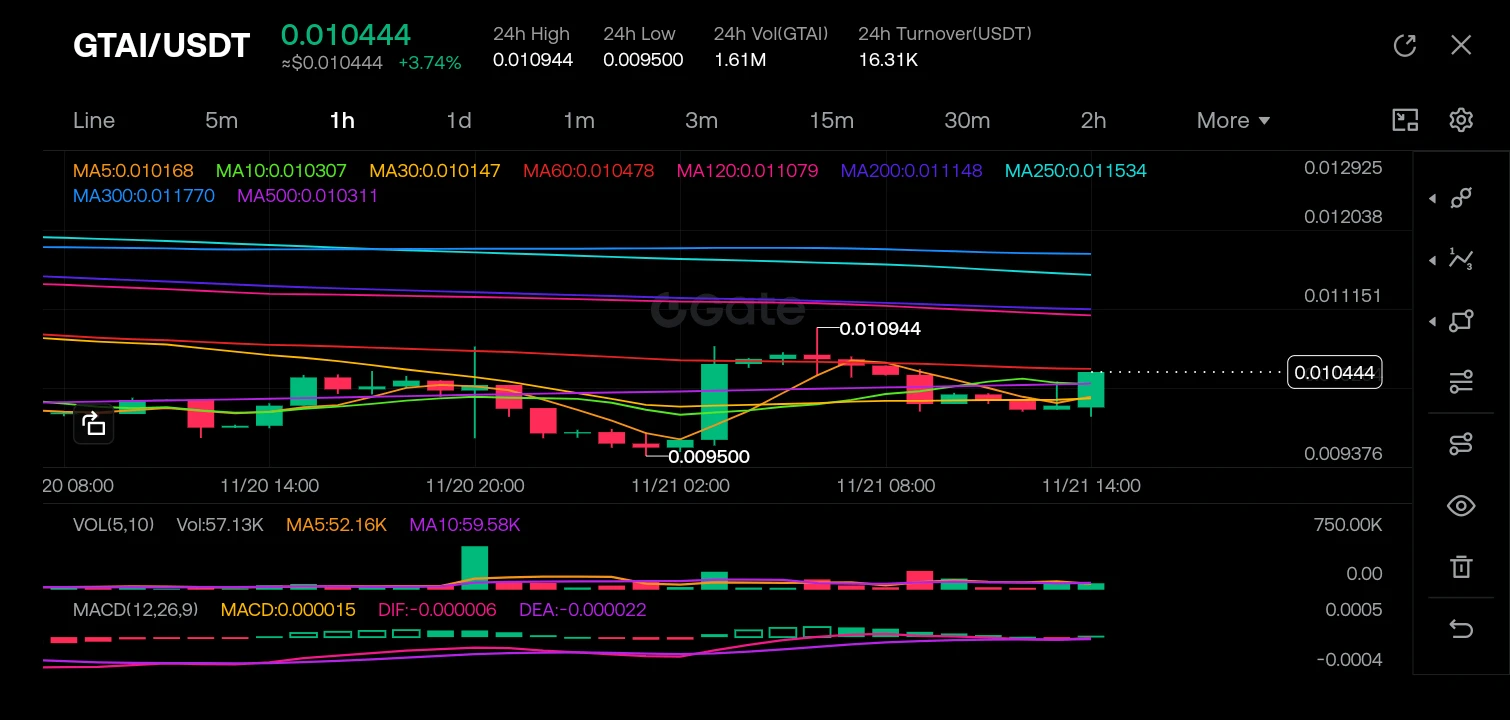
The Asymptotic Oversold Bounce: Decoding GTAI’s
$GTAI ‌

#GateAnnualGala #weeklyshare
In the realm of trading, capitalizing
on market extremes requires a confluence of momentum oscillators and on-chain liquidity flows. Traders exploit overextended conditions—where the Relative Strength Index (RSI) breaches mathematical boundaries of >70 (overbought) or <30 (oversold)—because markets are mean-reverting. Simultaneously, tracking whale wallet accumulation/distribution reveals the underlying volume delta before it reflects on the retail order book. By mapping structural supports and analyzing m
post-image
GTAI-4.43%
  • 2
  • 1
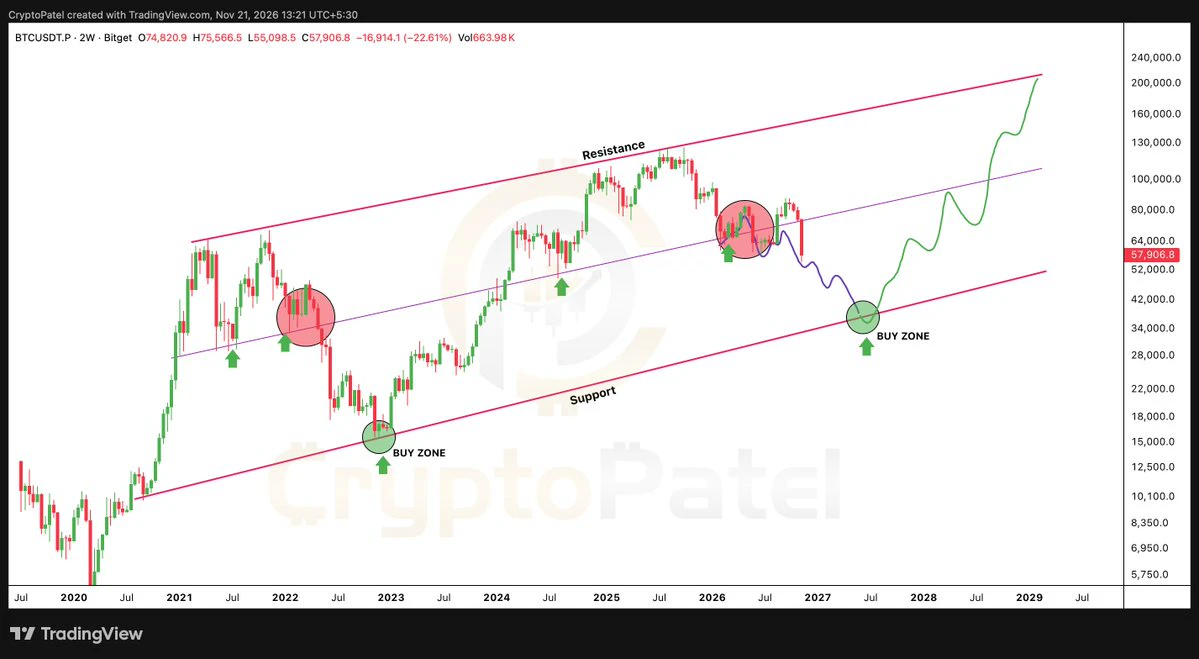
Bitcoin to $35K before $200K?
Most people aren't ready for another 50% crash.
But the long-term ascending channel says $35K–$40K could be the ultimate BTC accumulation zone.
The next bull run could make today's panic look stupid.
post-image
BTC-0.67%
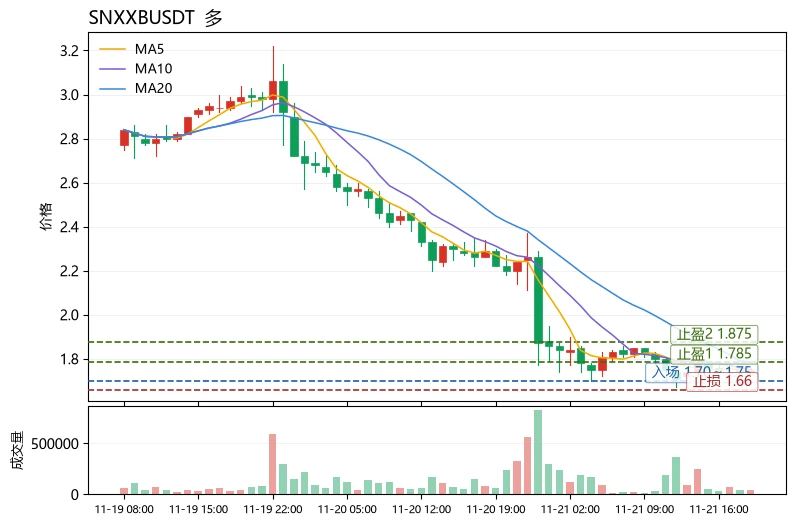
$SNXXB$SNXXB Conclusion first: This is an oversold bounce, not a trend reversal, and is only suitable for light-position short-term longs, not trend longs. The reason: The current price of 1.75 is still below MA20 (1.785). Although MA5 (1.744) is now close to the price, the moving averages have not yet formed a golden cross, and the medium-term trend has not recovered. However, the MACD histogram has turned positive (+0.02363), the price is near the lower Bollinger Band at 1.69478, and the RSI is only 32.0, in oversold territory. Combined with the extreme fear reading of 12 on the Fear & Greed
post-image
KERNEL-7.76%
BNB-0.76%
Although AI can now create images and videos, making covers and posters is no problem.
But highly professional assets are still needed, as they can greatly improve the rate of usable AI-generated outputs and their professionalism.
These 3 sites are all free for commercial use and don't require attribution:
1. Unsplash
High-quality photos, ideal for cover images and poster backgrounds

2. Pexels
Offers both photos and videos, with clear categories and easy downloads

3. Pixabay
Offers images, videos, illustrations, and music, with more options
post-image
We found out why this car wash went viral!!
The owner’s move is a top-tier strategy.
post-image
While trying to guess the item, Yang Chaoyue insisted it could be used to make soup—but in the end, she lost because she knew too much.

Huang Tingting said she’d never had that kind of soup, and Yang hurried to explain that you could also make it with chicken. When the answer was revealed, a guest beside them quipped, “You lost because you know too much,” making everyone laugh.
I won’t let my brothers keep losing money after seeing my posts. I publish my market outlook in advance every day, and the market keeps validating it.
Black Friday shorts got absolutely crushed. BTC plunged nearly 10,000 points in two days, with no hesitation in the downtrend. Yesterday morning, I marked out the short entry zone, stop-loss, and two target levels. The rebound barely reached resistance before turning sharply lower, breaking through both targets. #BTC跌破6万美元关口 #BTC
Alronbit
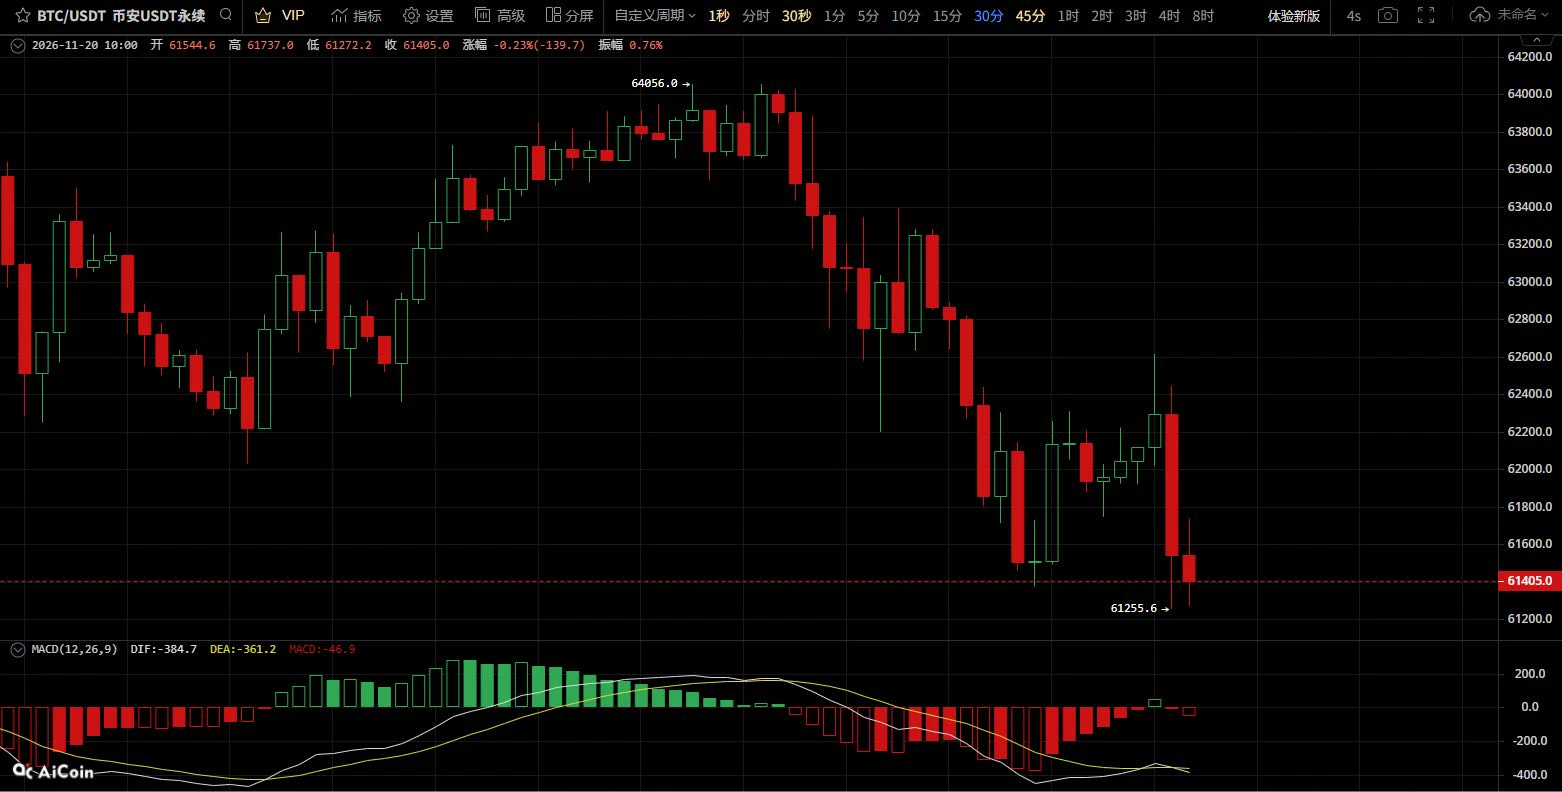
Longze | November 20 BTC stair-steps lower to a new low for the current phase; rebounds face resistance, favoring trend-following short positions
【Trading Strategy】
Short entry zone: Enter on a rebound to 61800-62100
Stop-loss: Above 63000
Take-profit targets: First target 61200-61000; second target 60800-60600
【Technical Analysis】
On the 30-minute chart, the price has stair-stepped down from a high of 64056, setting a new low for the current phase at 61255.6 this morning. The overall descending channel remains intact, and the bearish trend is clear.
The current price is consolidating weakly around 61400, representing an oversold recovery after the breakdown. Rebound volume is insufficient, and the MACD lines remain below the zero line, with no reversal signal for now.
The 61800-62100 zone above is a resistance band where a dense trading area converges with the trendline, with concentrated selling pressure. Short-term support below lies at 61200-61000; a decisive break below the prior low would open up further downside.
The broader bearish structure remains unchanged, and the rebound recovery is limited. Shorting into strength around the resistance band offers better risk-reward.#BTC #BTC跌至9月以来新低
repost-content-media
BTC-0.65%
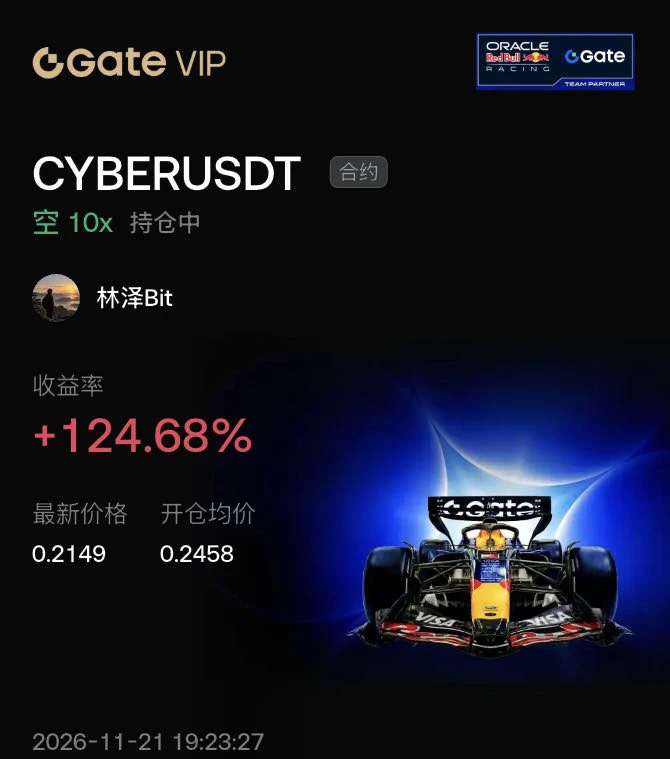
Yesterday, everyone online was still shouting that $CYBER had broken out of a descending wedge. The 4-hour RSI surged to 83, and I saw just one word: overheated.

That +31% bullish candle wasn’t the start of a rally—it was an entry price handed to short sellers. Short at 0.2458 with 10x leverage; now it’s at 0.2149, for a +124.68% gain. This rally had a very weak foundation—futures trading volume was 4 times spot trading volume, open interest surged, and forced short liquidations drove the price up. It wasn’t spot buying that pushed it higher.

Once the short squeeze is over, it’s time to see
post-image
CYBER-5.14%
AKE+6.39%
BTC-0.65%
  • 1
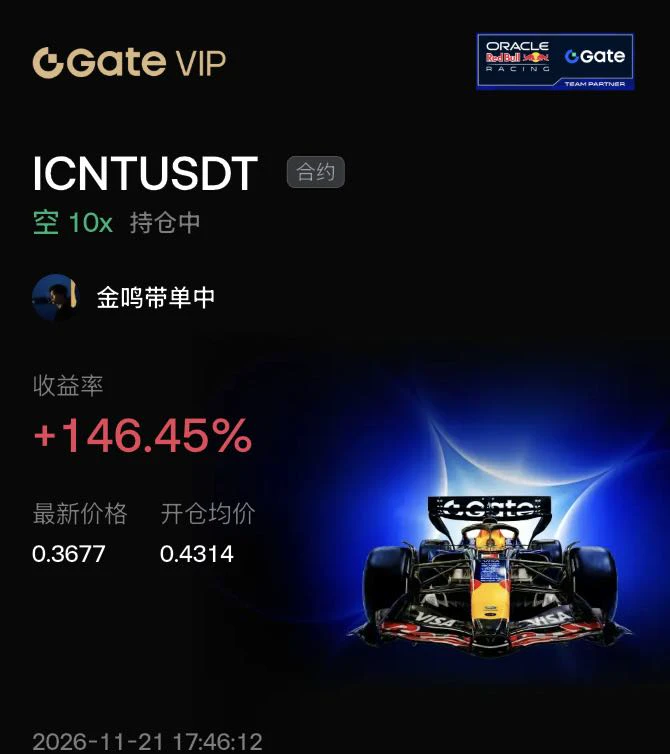
A detail: 60% of accounts are short, so this $ICNT trade was actually on the majority’s side.

Data from the 20th: 39% of accounts were long and 61% were short. The funding rate was positive, at an annualized 7.6%, so shorts were collecting payments. Of the 870,000 in liquidations, 40% were long positions.

As the price rose, more people kept shorting it. That’s countertrend shorting, usually not a good sign. But once it couldn’t climb any further, those short positions became a hand pressing it down.

Entered at 0.4314, closed at 0.3677. A small part of the 146% return came from collecting f
post-image
ICNT-10.47%
ETH-1.23%
AKE+6.39%
  • 1
#CookBacksFurtherRateHikes
#weeklyshare
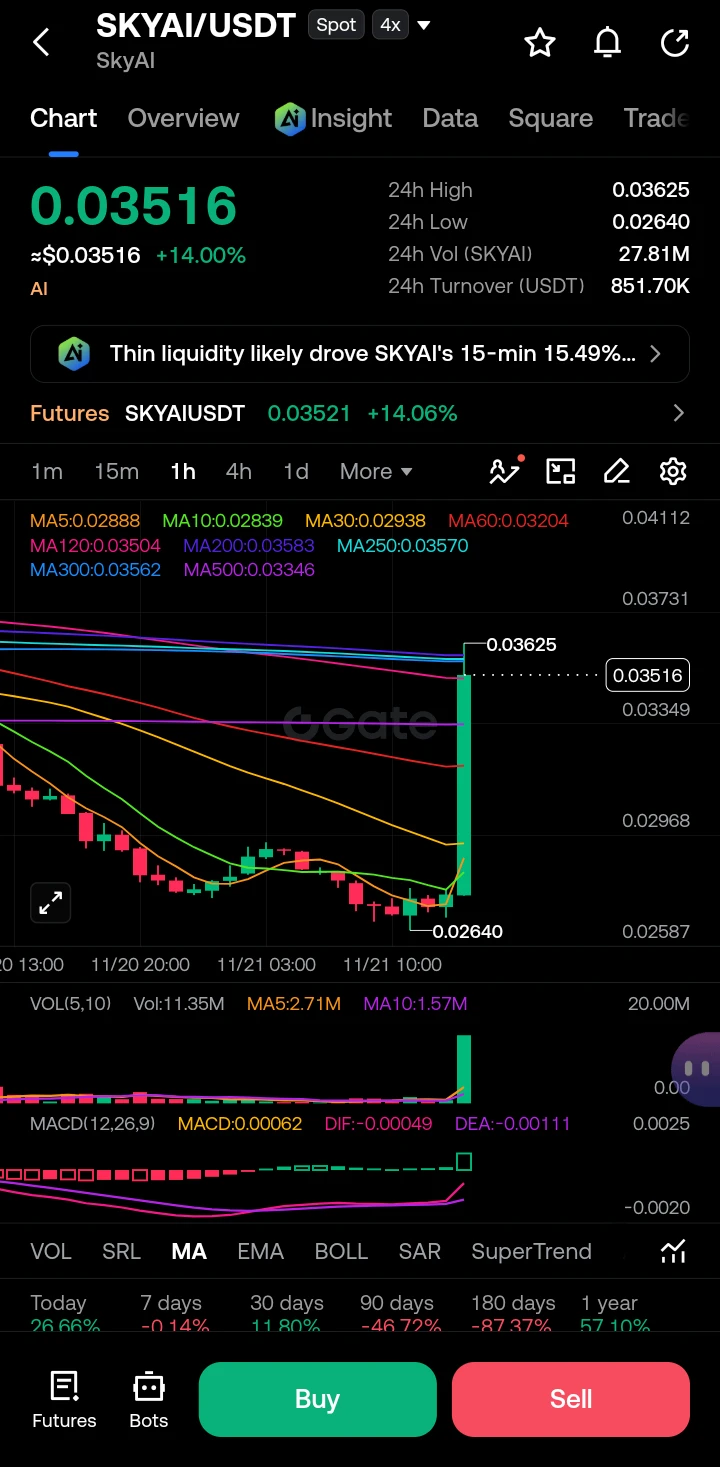
$SKYAI ‌
The Liquidity Vacuum: Catching the SKYAI Breakout While Respecting the Macro Bear

Markets do not move in straight lines; they move in fractals of fear and greed, driven by liquidity. The chart in front of us is a textbook example of a "Low Float / Thin Liquidity" pump. While the 1-hour chart shows a parabolic +14% surge, the macro trend remains deeply bearish. This analysis will bridge the gap between micro-momentum (the 1-hour breakout) and macro-structural flow (the 90-day -46.72% drawdown), providing a mathematical framework to trade the
post-image
SKYAI-7.58%
  • 4
  • 2
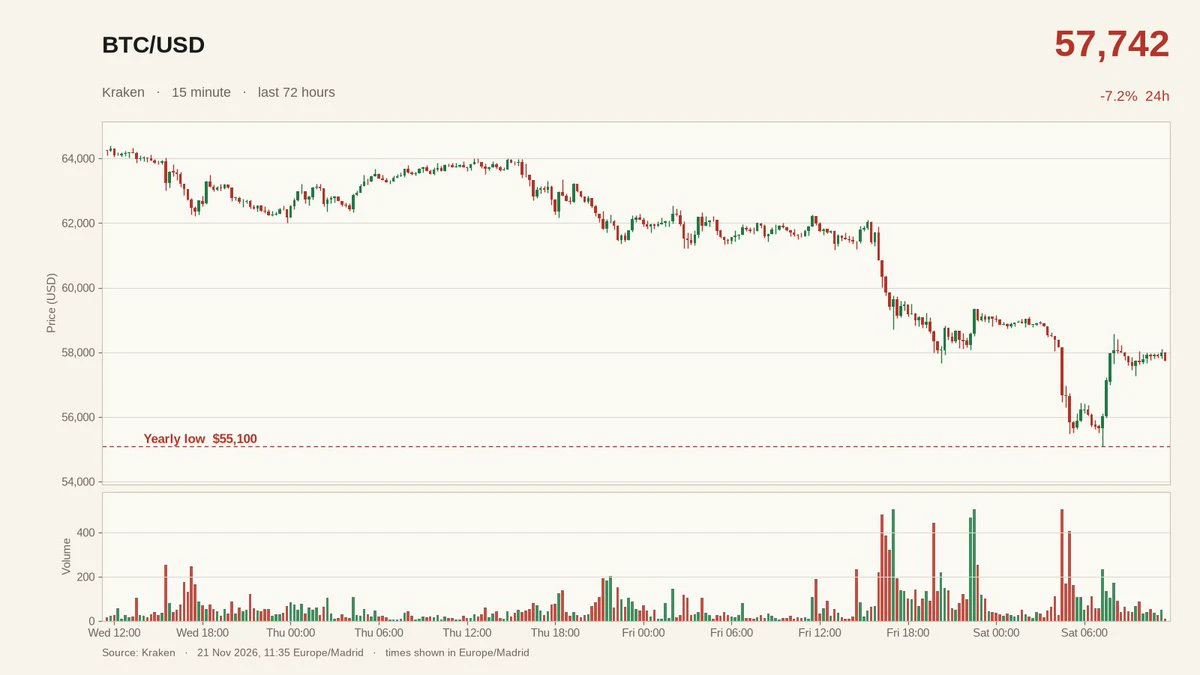
#Bitcoin just printed a new yearly low at $55,100.
It already bounced back toward $58,000 this morning. Weekend tape is brutal.
post-image
BTC-0.67%
ANT CFD LAUNCH EVENT: UP TO 1,000 USDX IN REWARDS AND TRADING SUBSIDIES

🔍 THE INTERESTING PART IS NOT JUST THE REWARD

Imagine discovering a new trading opportunity and finding that the launch comes with more than access to a new market. There is also an incentive designed to encourage participation.

That is the idea behind Gate's ANT CFD Launch Event. The campaign introduces trading subsidies and offers participants the opportunity to receive up to 1,000 USDx in rewards.

At first glance, the reward figure may attract the most attention. But there is another part worth understanding: the c
post-image
ANT+0.00%
  • 4
  • 1
BTC PREDICTION MARKET UPDATE
live-cover
LIVE1,812
BTC-0.67%
ETH-1.26%
SOL-0.77%
XRP-1.15%
GT-2.41%
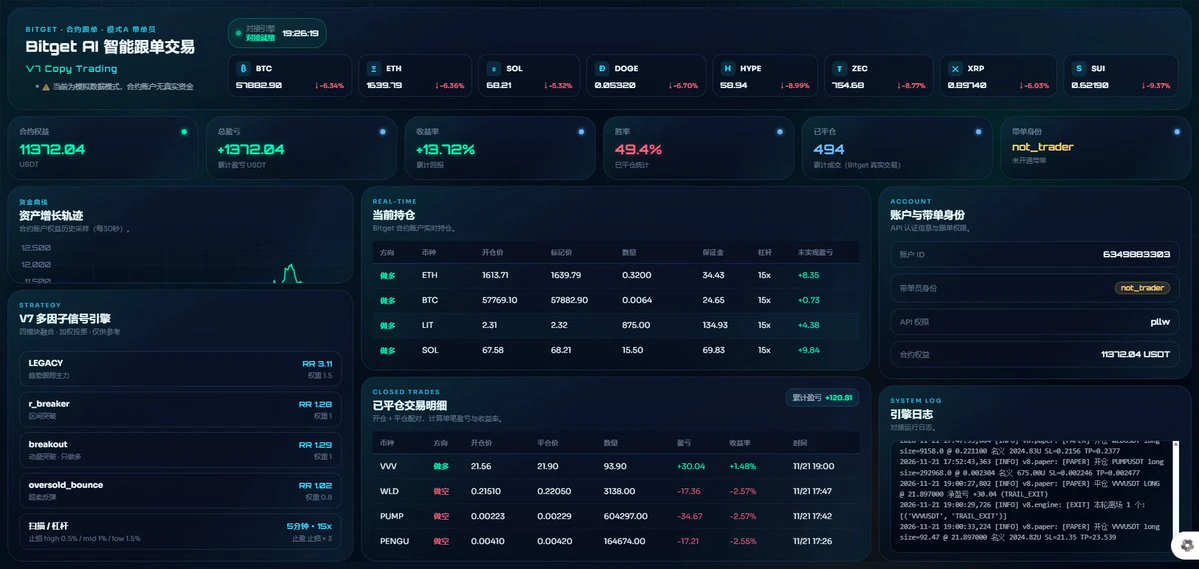
Crypto prices plunged, and many KOLs got wiped out and liquidated. My AI trading strategy is currently generating steady profits. I’m not afraid of a drop—I’m only afraid of the market moving sideways.
That’s why the current market conditions are favorable for my strategy!
#ai交易 #BTC
post-image
BTC-0.65%
Load More

Join 40 M users in our growing community

⚡️ Join 40 M users in the crypto craze discussion

💬 Engage with your favorite top creators

👍 See what interests you

Trending Topics

BTCBreaksBelow60K

2.1M Views29.4K Discussing

BTC fell below $60,000 on November 20 for the first time since July, alongside a tech stock selloff and broader pressure on risk assets. Will $60K become resistance, or can BTC quickly reclaim it? What price or volume signals would convince you that selling pressure is easing?

GateDirectIPOPhase3ANTAllocates92100Shares

754.6K Views4.8K Discussing

NvidiaDropsNearly14Percent

316.8K Views7.5K Discussing

View More