




Share your thoughts
placeholder
Article
Layout for Bitcoin, Ethereum, and Dogecoin
live-cover
LIVE1,704
On September 2, I took a heavy position in 30 shares of SanDisk. I made 900 but didn’t sell, and ended up selling for a profit of only a few dozen. There was nothing I could do since it didn’t surge. Yesterday I placed orders for three or four shares, but it didn’t wick down even once to let me buy in. Well, today it rose to over 1,700, and I missed it.
I’ve found that once you figure out U.S. stocks, they’re more fun to trade than BTC and ETH: the volatility is higher, making them suitable for swing trading; you can also easily get trapped, and they’re suitable for studying cycles and sectors
post-image
SNDK+11.88%
Everyone’s still barking up the wrong tree on DOGE—the 4H chart just whispered a secret the crowd missed.

$DOGE /USDT - SHORT

Trade Plan:
Entry: 0.08449 – 0.08497
SL: 0.08707
TP1: 0.08297
TP2: 0.08181
TP3: 0.08005

Why this setup?
Why now? The 1D trend is *range*, not bull—so longs are playing hopscotch in a minefield. RSI on the 15m is at 44.19, losing upside steam. ATR (1h) at 0.000975 shows volatility is compressing, but the short setup is "Armed" with entry at 0.08473. TP1 (0.08297) is a clean 2% drop, and TP3 (0.08005) is a 5.5% slide. The invalidation at 0.08551 is tight—only 0.9% a
DOGE-4.93%
✨Those who missed the move will only become more numerous; the Bitcoin bull market has just begun.
Short-term fluctuations do not mean the trend has ended.
The market has repeatedly absorbed known negative factors such as rate hikes and bills, and these factors are unlikely to change the larger cycle.
At worst, there will only be sporadic rate hikes, after which the market will still return to the path of easing.
The monthly and quarterly bullish structures remain intact.
In the remaining three months of this year, there is a chance of pushing into the 90,000–100,000 range.
The real major corr
post-image
BTC-2.39%
ETH-2.37%
I was just about to go rant on the forum, but then I saw my balance and thought, never mind—the market is always right. During the repeated intraday swings, $SKR fell just short every time it tried to push higher, and the volume never followed through. It clearly had a strong bull-trap vibe. My thinking was crystal clear at the time: follow in directly around 0.012992, no hesitation. Now at 0.021592, +1304.32% secured—the timing was just right. The early phase was genuinely sluggish, but the breakout feels genuinely sweet. Take 70% off first; don't get greedy for the last bit. Move the stop-lo
post-image
SKR+11.64%
BTC-2.39%
SNDK+11.75%
A few days ago I was still calculating how to afford instant noodles; this morning I was already wondering whether to add sausage. When the early-session sell-off first hit, $ONDO looked like it was about to rebound, but sell orders kept pressing it down from start to finish. Trading volume was pitifully low, and there was simply no one to buy into the rise. I’ve seen this kind of market action many times—a typical low-volume grind downward. My judgment at the time was simple: don’t catch it; let it run. Later, it ground from 0.3997 all the way down to 0.3529, securing +565.07%. It was truly s
post-image
ONDO-2.08%
BTC-2.39%
BNB-0.53%
$DRAM notable breakout
post-image
DRAM+6.50%
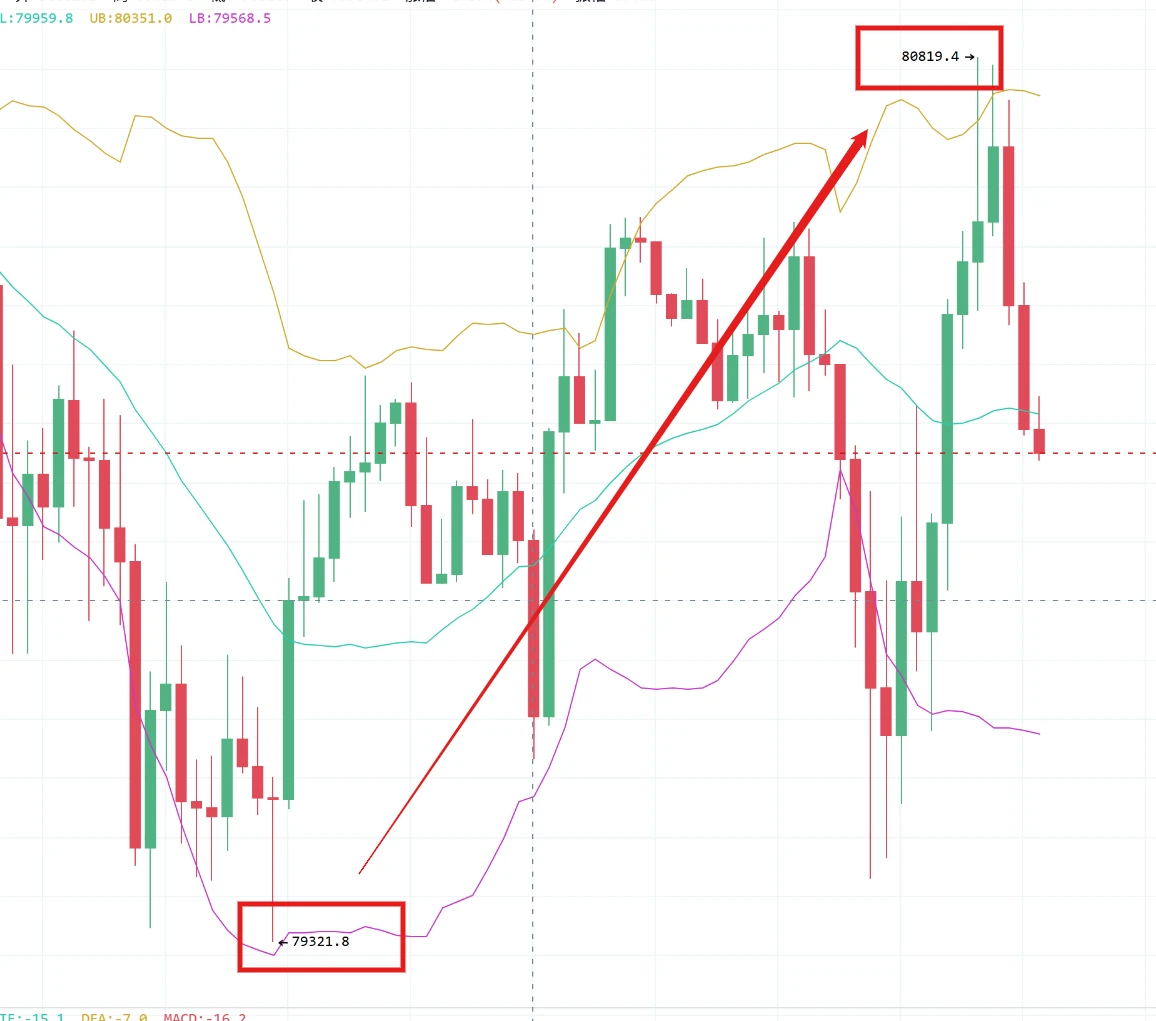
Once the data came out in the evening, the market saw a wave of wicks, with over $200 million in longs liquidated within an hour. It was indeed terrifying! Actually, the price swing was not that large, falling from around 812 to around 786, a 2,000-point move. It was not even as exciting as an ordinary Thursday's volatility yesterday! For so many longs to be liquidated, all I can say is that those who opened such large positions during a data-driven market move were truly brave. As the saying goes, the brave enjoy the time first!
Looking at the chart, Bitcoin's hourly chart shows signs of bo
post-image
BTC-2.39%
ETH-2.43%
GN CT 🌃
It’s been a good day.
Hope you all have an amazing weekend.
Time to rest and enjoy your night.
post-image
#Gate事件合约晒单挑战
ETH FLASH MOVE: 3.12% DROP IN JUST 15 MINUTES NFP RISK REPRICING TAKES CENTER STAGE
ETH experienced a sharp short-term sell-off on September 4, 2026, falling 3.12% between 12:30 and 12:45 UTC, from 2,530.29 USDT to 2,435.89 USDT. The move produced a 3.73% amplitude, showing just how aggressively price reacted within a very short window. This was not a normal gradual decline; it was a concentrated liquidity-driven move that immediately brought the upcoming U.S. August NFP report back into focus.
THE ORDER BOOK TOLD THE STORY
The most important detail behind the speed of the move
post-image
ETH-2.43%
No big-picture thinking, can’t hold on—the profits on this move are paper-thin, but I absolutely love it. 💸
When the market plunged intraday, I chased a short at 0.7915. The selling pressure was too strong, so the rebound couldn’t hold at all; every move back into the green was just fuel for the shorts. In this kind of market, hesitation means losing—only those willing to follow the move get rewarded.
Now at 0.2368, +1380.15%, those aboard should be laughing themselves awake. 😏 Nothing matters more than getting the timing right. From entry to taking profit, everything went smoothly, with not
post-image
ZEC+7.15%
ETH-2.37%
An ant-sized position is fine 😂 [short-selling trainee], got cut in half.
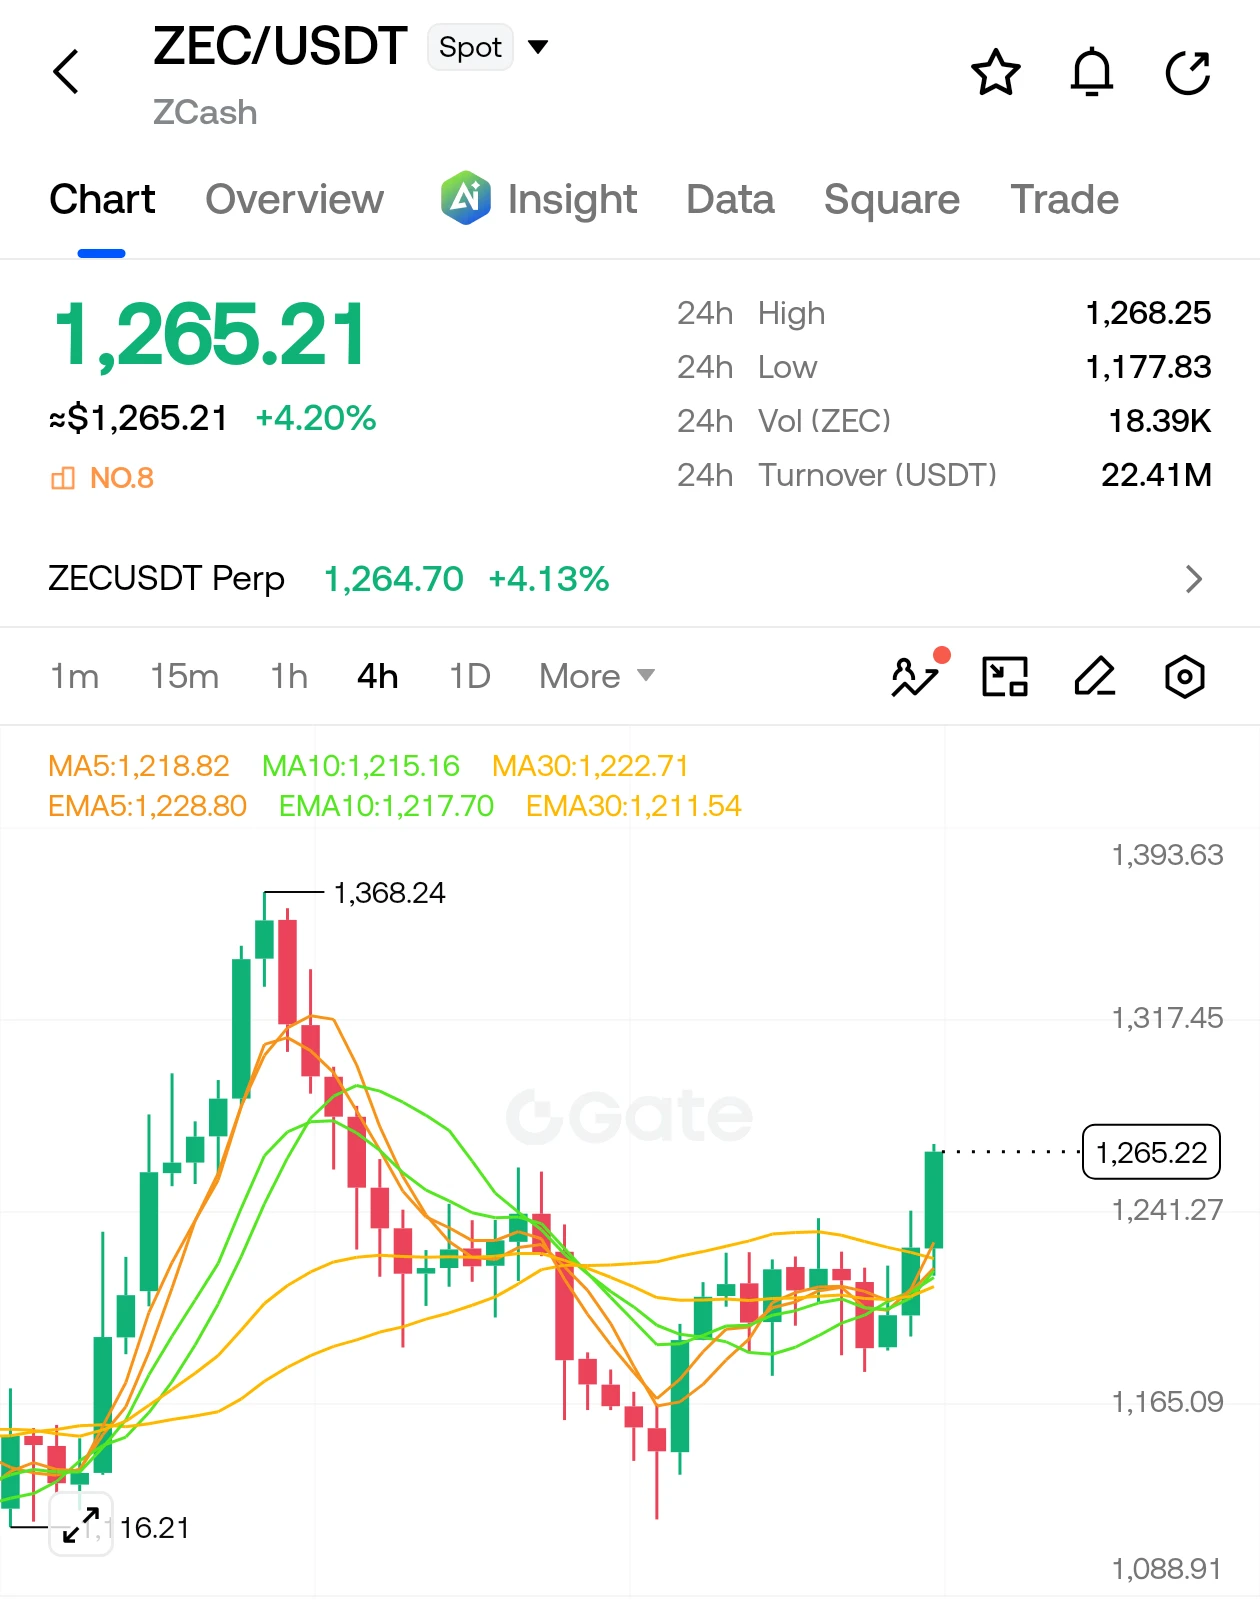
Everyone’s bragging about ZEC’s 1D trend—but my 4h chart just whispered a secret that 84% of traders missed.

$ZEC /USDT - SHORT

Trade Plan:
Entry: 1018.21 – 1032.15
SL: 1112.14
TP1: 959.96
TP2: 916.48
TP3: 851.26

Why this setup?
- The daily trend says “bullish,” yet the 4h setup is screaming SHORT with 84% confidence.
- Price is stalling near 1025.18, right under the 1h ATR of 27.87—a classic squeeze zone.
- RSI on the 15m (60.45) shows fading momentum, not a breakout spark.
- Why now? The “Waiting” status means the trap is set: a drop to TP1 (959.96) is a 6.4% move before the dail
ZEC+7.15%
$USDJPY $EURJPY $GBPJPY ‌The Japanese Yen (JPY) remains at the center of global currency markets, influenced by the Bank of Japan's (BoJ) monetary tightening path, rising inflationary pressures, and speculation surrounding the asset allocation strategies of the GPIF, the world's largest pension fund. The BoJ's continued focus on further interest rate hikes as inflation approaches its 2% target is accelerating the exit from years of excessively loose monetary policy, while the rise in Japanese bond yields is directly impacting global capital flows.
BoJ Policy Axis and Dilemmas in the Japan
USDJPY+0.30%
EURJPY+0.19%
GBPJPY+0.25%
When the tide rises, the returning ripples will come; only when the waves are calm do you recognize the ferryman✨
$BTC $ETH
Many of you who trade have probably experienced such agonizing moments.
You identify a support level and safely enter a long position, convinced that the market is about to move higher.
But the market shows no mercy. A sell-off comes without warning, prices plunge in a straight line, and your position is suddenly trapped.
Before entering, you have carefully thought through the price level, logic, and timing. But no one can predict the moves of large capital in advance, a
post-image
BTC-2.39%
ETH-2.37%
Everyone’s watching SLX pump—but the 4h chart just whispered a different secret.

$SLX /USDT - SHORT

Trade Plan:
Entry: 0.06872 – 0.06914
SL: 0.07098
TP1: 0.06739
TP2: 0.06637
TP3: 0.06483

Why this setup?
Why now? The 1D trend is *range*, not breakout.
- RSI (15m) at 53.84 = zero momentum, just noise.
- ATR (1h) at 0.000854 shows tight coils—squeezes snap hard.
- My entry zone (0.06872–0.06914) is a magnet, but invalidation at 0.06921 is only 0.4% away.
We’re not early; we’re *precise*.

Debate:
If SLX fakes above 0.06921, do you flip long or wait for the short to re-load?

⚠️ P
SLX-0.37%
$1000 to $100,000 Crypto Trade Challenge Today
live-cover
LIVE458
I just casually tapped refresh, and it dropped on its own, putting me in a really passive position. With $OP moving like this, I don't even need to think—the account is dancing by itself.

When it plunged intraday, I kept watching the market and repeatedly confirming around 0.11747. The rebound was weak, the bull trap was obvious, and volume didn't follow—there was simply no one to buy into the rise. With this structure, not shorting it would have been letting this plunge go to waste.

Now at 0.09692, +842.46% is already safely in the bag. Those on the ride should have woken up laughing. Nai
post-image
OP-4.37%
ETH-2.37%
LAB+0.66%
Everyone’s long silver, but the 4h tape just whispered something else about $XAG /USDT.

$XAG /USDT - SHORT

Trade Plan:
Entry: 65.82 – 66.08
SL: 67.17
TP1: 65.04
TP2: 64.43
TP3: 63.52

Why this setup?
Why now?
- 1D is range—no hero trend to save you.
- 15m RSI at 41.94 shows momentum already rolling over, not exhausted.
- ATR ~0.50 on 1h gives room to breathe, but entry 65.95 sits right under invalidation 67.01.
- Short targets stack cleanly: TP1 65.04, TP2 64.43—a 2.3% drop from ref before SL risk.
- Conf 55 is not a scream, it’s a lean—range tops get sold, not bought.

Debate:
XAG-1.21%
Gm everyone ☀️
post-image
Load More

Join 40 M users in our growing community

⚡️ Join 40 M users in the crypto craze discussion

💬 Engage with your favorite top creators

👍 See what interests you

View More