
Square
Following
Hot
News
Profile
Share your thoughts
placeholder
Article
Taking a look at Bitcoin's heatmap, there's something that really catches my attention.
The largest concentration of liquidity is above, especially at $85,000 and $87,000.
Below, there is barely any significant liquidity beyond $79,000–$80,000.
This doesn't mean BTC has to rise, but it does give us interesting levels to watch.
BTC+0.48%
I just posted my first market update in weeks!
I sat down with expert trader @_FabianHD to break down the macro picture, $BTC , AI stocks & more.
Watch now 👉
post-image
BTC+0.48%
Trenches
STONK
S
bade
b
STONK
6GmA...UNgx
Market Cap
$.
Change
.
24h Vol
$.
Holders
.
BTC
B
bade
b
BTC
C5xp...pump
Market Cap
$.
Change
.
24h Vol
$.
Holders
.
CNPY
C
bade
b
CNPY
0xc6...ddd2
Market Cap
$.
Change
.
24h Vol
$.
Holders
.
ZIG
Z
bade
b
ZIG
0x8c...1145
Market Cap
$.
Change
.
24h Vol
$.
Holders
.
Q
Q
bade
b
Q
0xc0...0589
Market Cap
$.
Change
.
24h Vol
$.
Holders
.
Many people who lose money never understand one thing:
They all buy Bitcoin, so how can others make big money in one market cycle while they come in just to hold the bag?
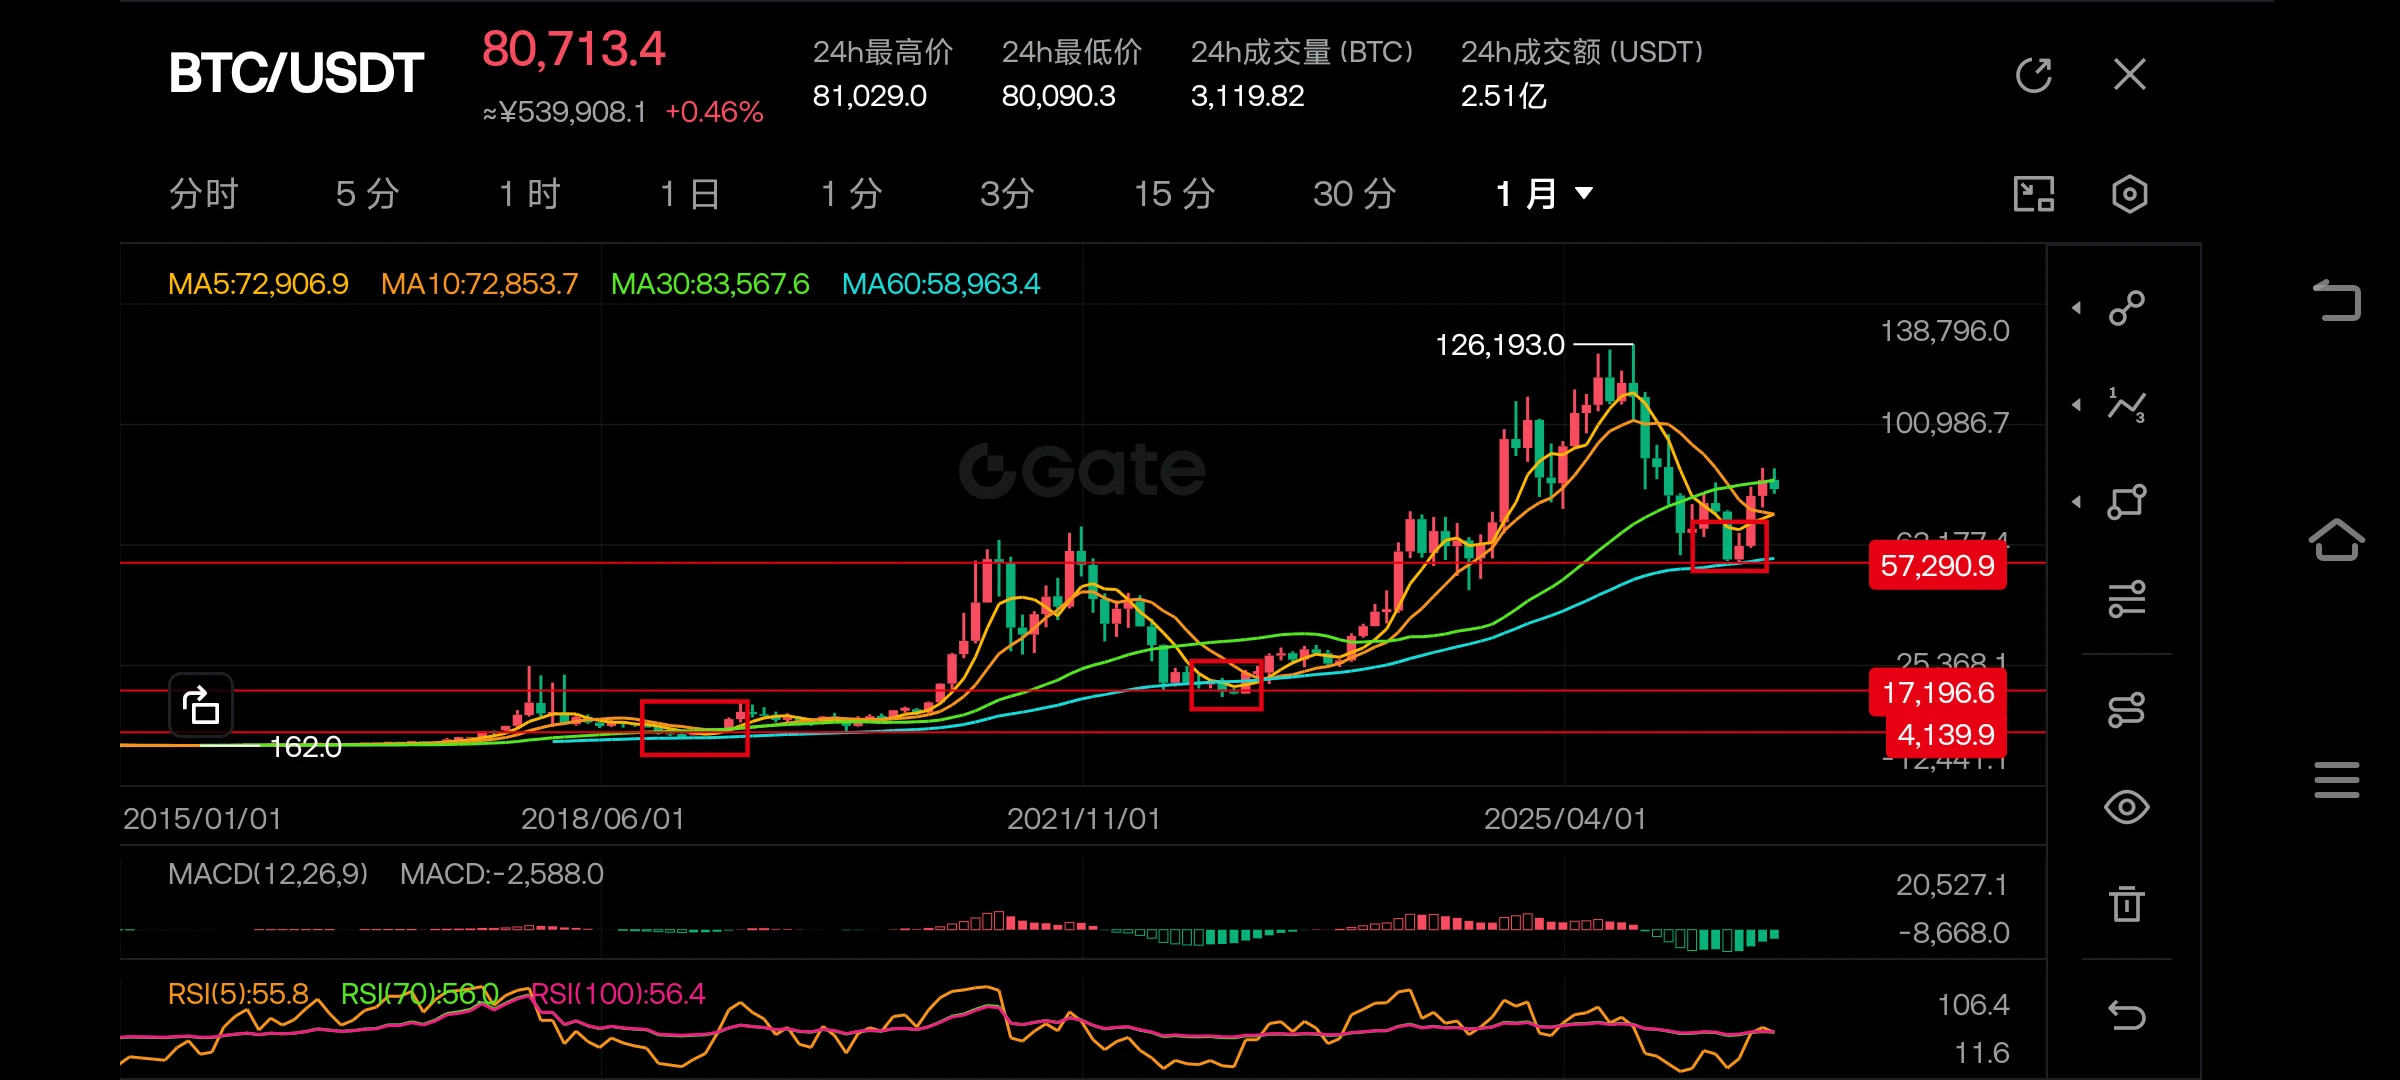
You think the difference is news, technical skills, or insider information? Look at this monthly chart and the answer is obvious.
The red boxes on the chart mark the rare bottom accumulation zones in each bear market.
Seasoned players quietly and gradually build their positions when everyone is panicking and no one dares to speak.
When the market surges, everyone online is showing off their profits and shouting that the bull
post-image
BTC+0.48%
ETH+1.08%
  • 2
The price has sharply retreated from the 24-hour high of 0.062010, and strong selling pressure is forming an immediate top. The 1-hour RSI is as high as 85.09, in severely overbought territory, signaling severe market momentum exhaustion and an imminent mean-reversion pullback. Short on $T .
Entry range: 0.0602 - 0.0615 Take-profit 1: 0.05550 Take-profit 2: 0.05122 Stop-loss: 0.06396 Popular coins: $JC : Current price 0.006874 - 24-hour change: +14.91%
$ZEC : Current price 1,212.12 - 24-hour change: +4.79%
post-image
ZEC+3.91%
yo @slingoorio u okay brotha?
post-image
#DataCentersMayFaceOversupplyBy2028
Data Centers May Face Oversupply by 2028: Is the AI Infrastructure Boom Approaching a Turning Point?
The global data center industry is experiencing one of the biggest infrastructure investment waves in modern technology. Artificial intelligence (AI), cloud computing, advanced chips, and growing demand for digital services have pushed technology companies to invest hundreds of billions of dollars in new facilities, computing capacity, and energy infrastructure.
However, a major question is emerging: Could the industry build more data center capacity than th
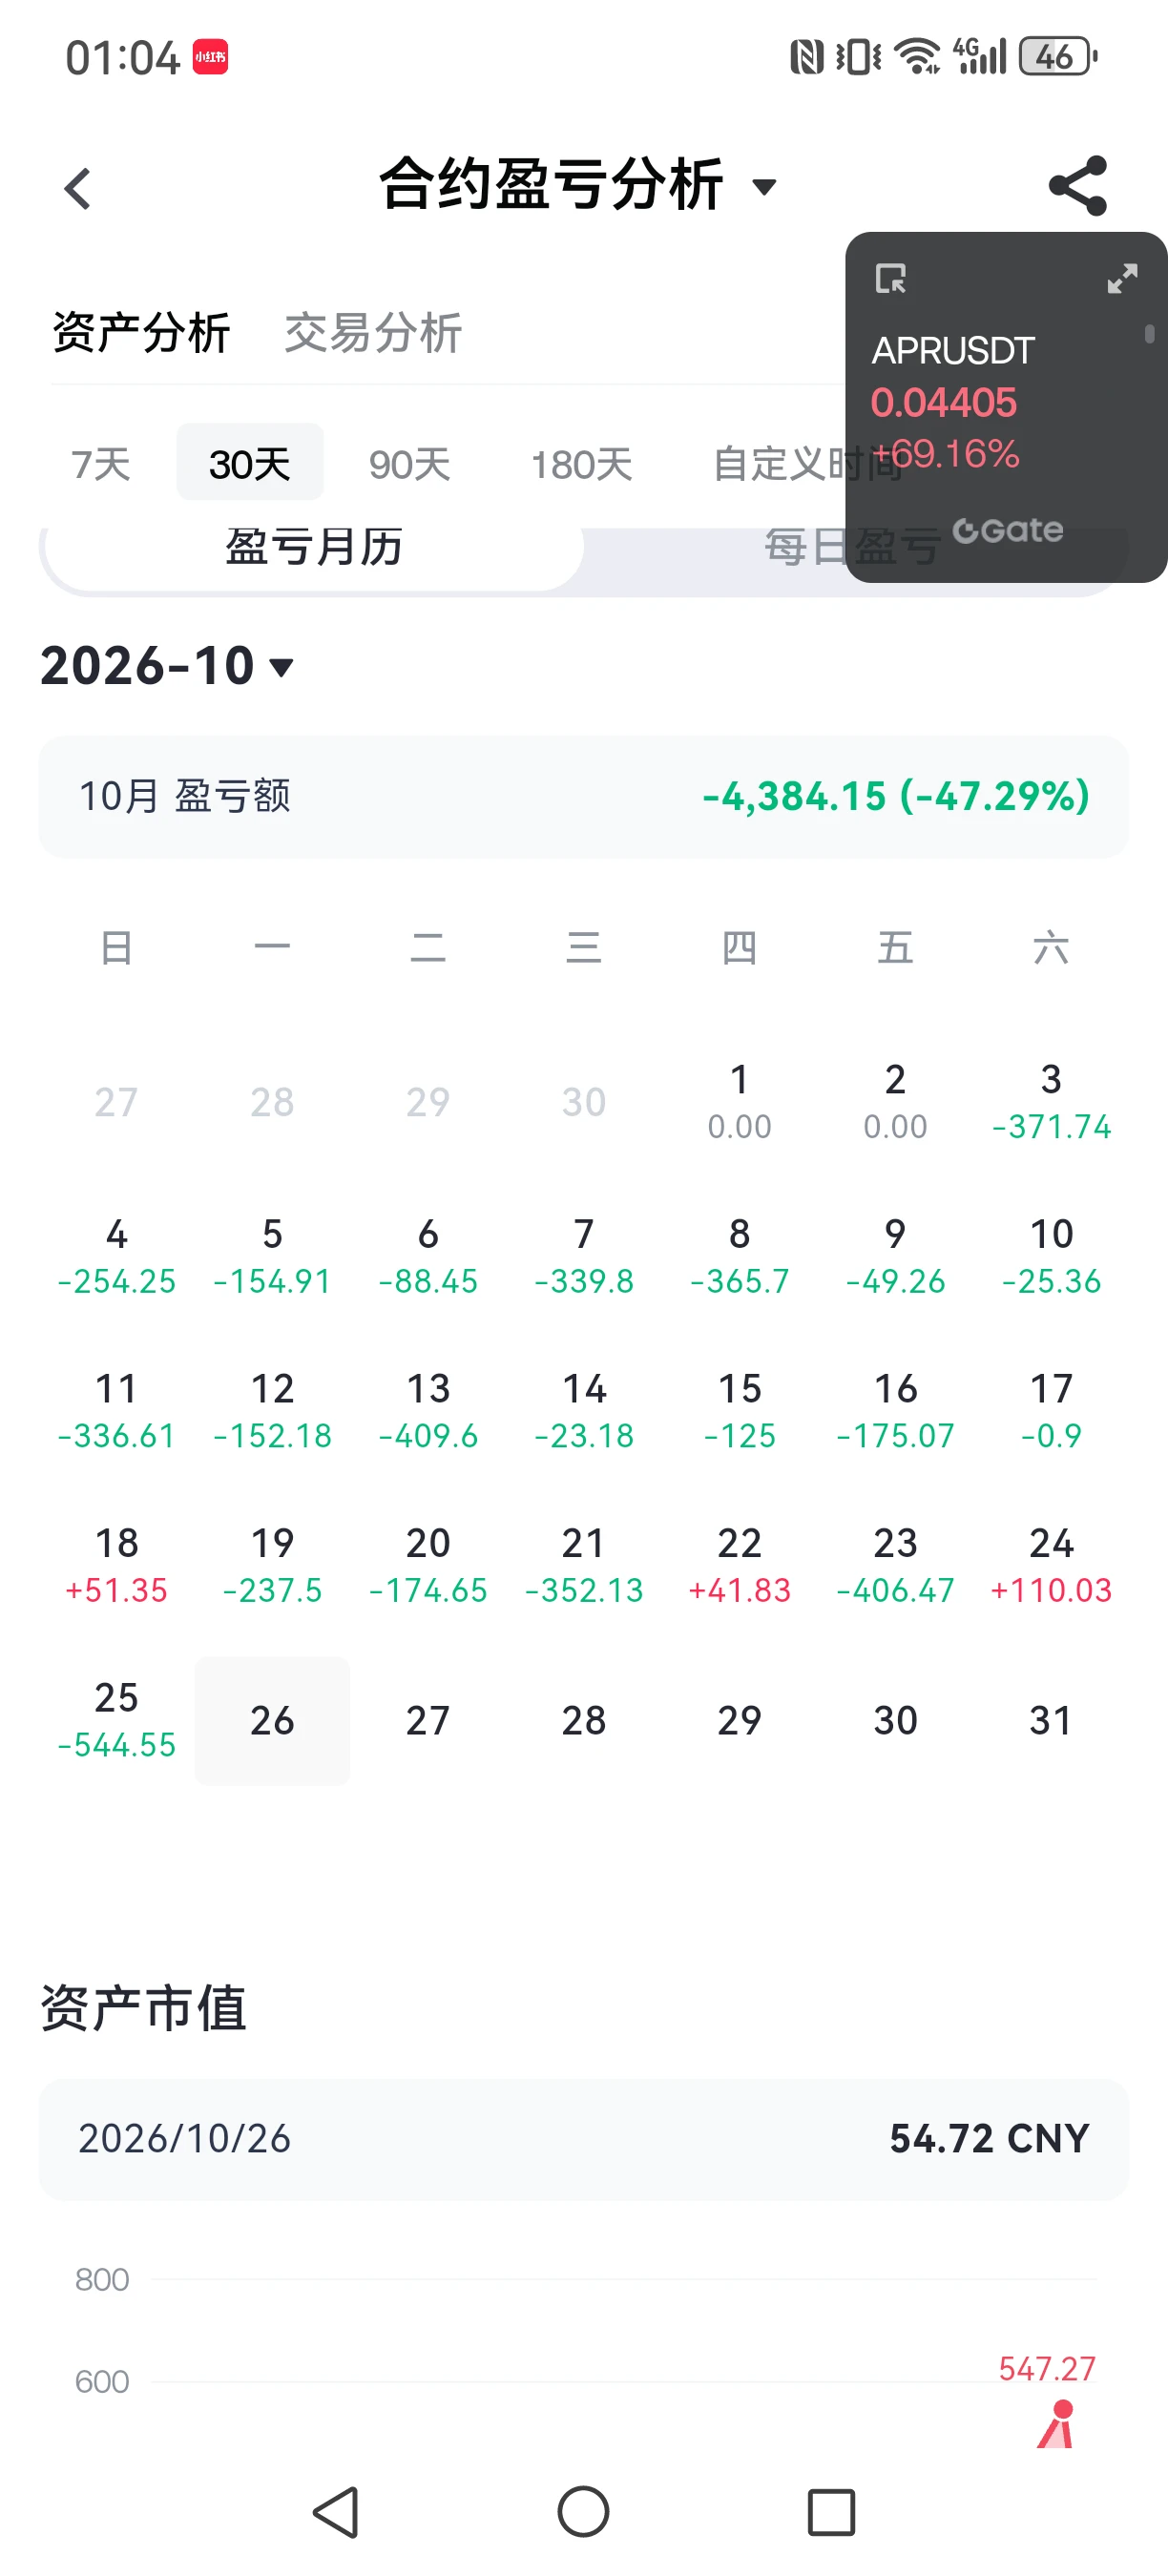
$APR The stop-loss has been moved up. I’ll exit this trade if it loses 5%, though of course I’m still hoping it keeps rallying. Going forward, I plan to stop closing trades manually and let the stop-loss close them automatically. When going long, I’ll only move the stop-loss up, never down—once you move it down, it’s easy to start holding a losing position. Get away with it once, and wishful thinking takes root; then you hold on a second time, a third time, and there’s only one destination: liquidation.
My XP points will probably hit zero tonight, but I opened a long position with U to hedge.
post-image
APR+68.06%
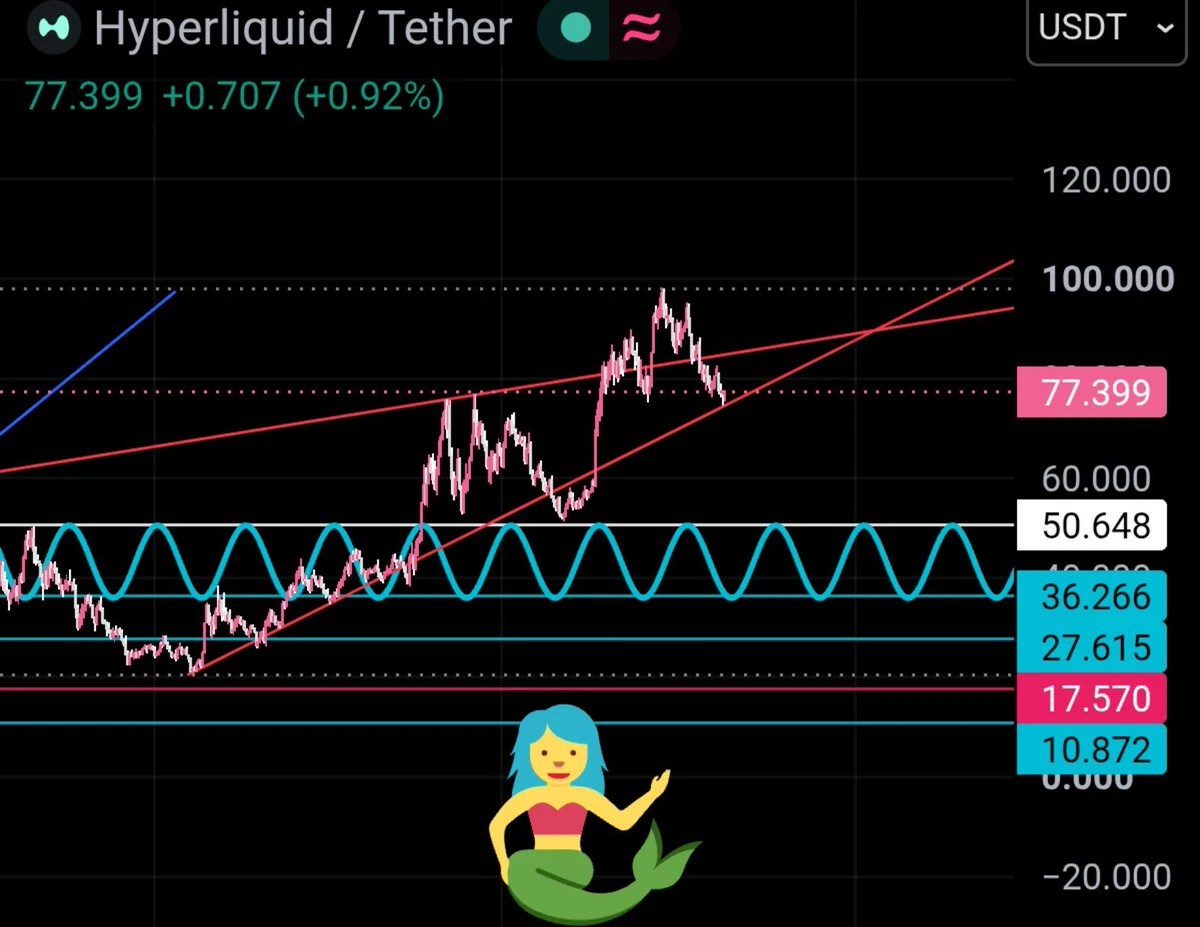
Nuke the $hype bros
post-image
HYPE+1.93%
Eth market update
live-cover
LIVE1,372
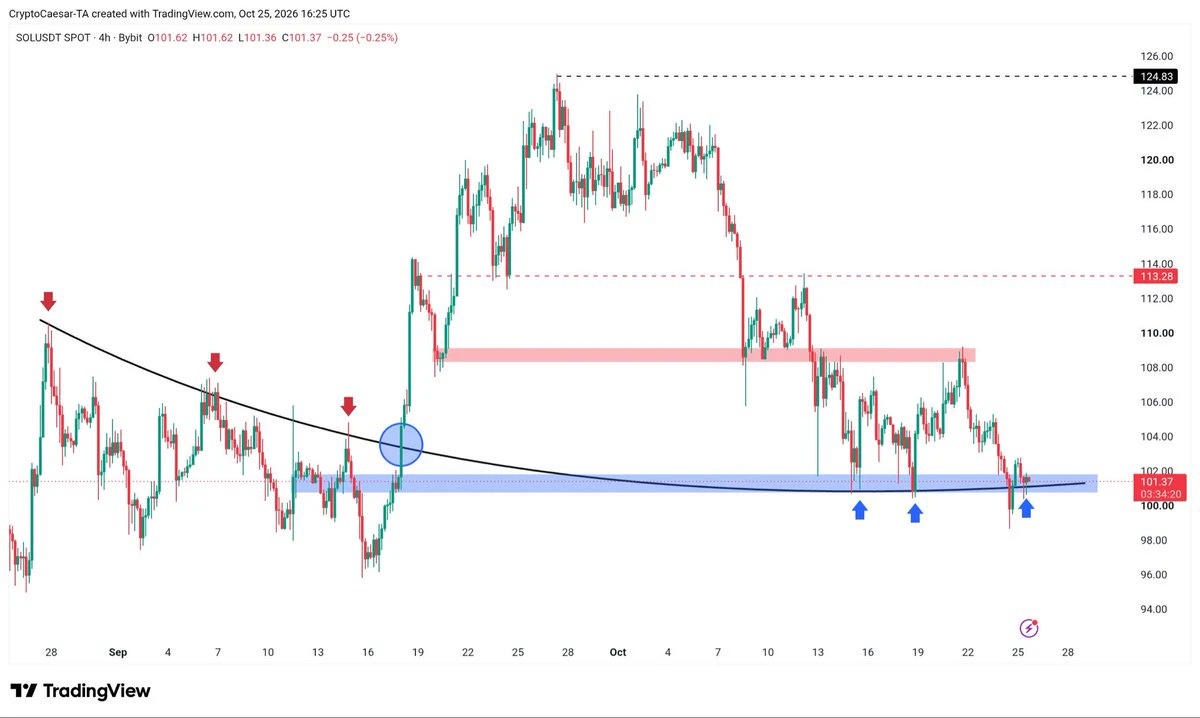
$SOL testing support on the 4H chart right now. Not a bad buying zone imo.
post-image
SOL+1.00%
Night session, in line with the early morning analysis (your choice; personal opinion)
2375 faces resistance and fails to break through
Continue to short
Targets: 2300-2285-2240
A firm hold above invalidates the short-term bearish outlook
BTC faces resistance at 81500-82400 and fails to break through; short for a T trade
Targets: 79700-78800; broader target 76300
A breakout and firm hold above invalidates the short-term bearish outlook
post-image
Market update BTC
live-cover
LIVE811
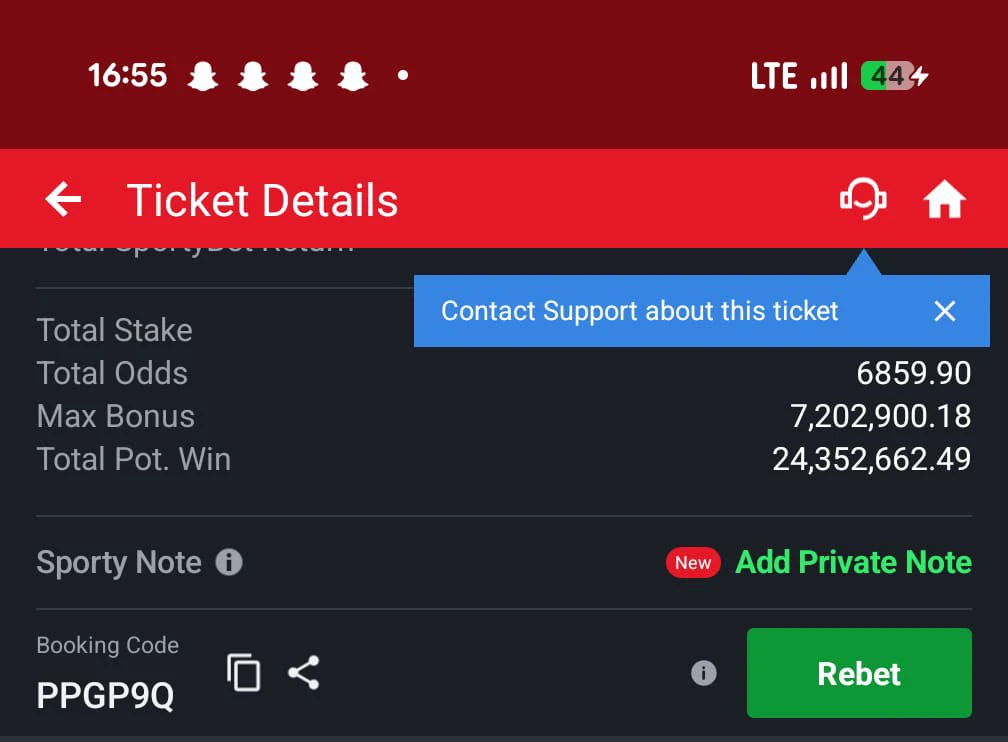
6.8k odds basketball 🏀 picks
post-image
$IRYS My losses have me heartbroken—any kind-hearted big shots willing to take me under your wing
Wishing everyone lots of prosperity
post-image
IRYS-17.90%
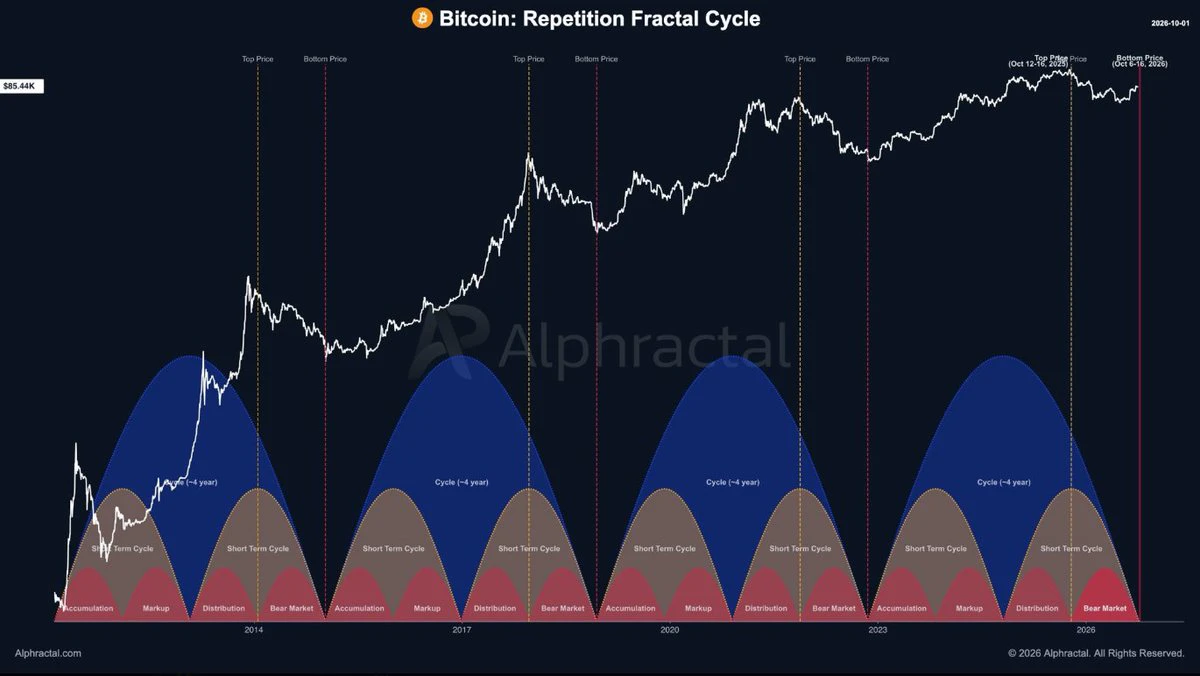
🐋 WHALE WATCH : The exact cycle theory had a clean run. It broke.
Whether the bottom is in depends on what comes next not what already happened. Declaring it confirmed from price action alone is how traders get trapped in the next leg down.
Watch the structure not the narrative.
post-image
📊 US Earnings Season: The Ultimate Test of Corporate Strength, AI Growth, and Global Market Confidence
The US earnings season is entering the spotlight as investors closely examine corporate financial results, future growth expectations, and the economic signals emerging from some of the world's largest publicly traded companies. Every earnings report provides another piece of the puzzle, helping market participants evaluate whether business performance can support current valuations and sustain confidence across global financial markets.
In today's rapidly changing economic environment, earn
post-image
BTC+0.48%
Satoshi Nakamoto: i created Bitcoin to give people financial sovereignty.
what we did with the technology:
post-image
BTC+0.48%
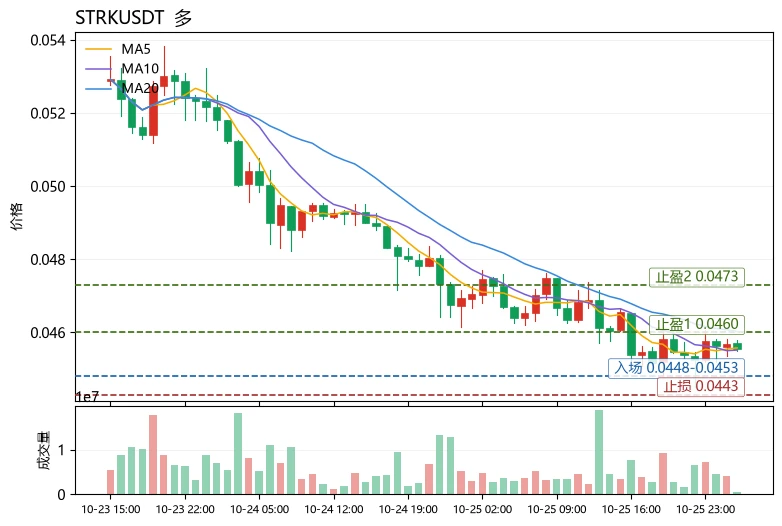
When the moving averages have not formed a bullish crossover, should you buy the pullback? The answer is yes, but only if the pullback leaves the structure intact—use moving averages to determine direction, RSI to determine position, and MACD to determine momentum; all three are essential. Take $STRK
as an example: the current price is 0.04554, and MA5 is below MA20, indicating that the short-term trend has not yet recovered. However, the price is still above the Bollinger lower band at 0.0447048, and the MACD histogram is positive, so momentum has not turned bearish. This is a “trend awaitin
post-image
HYPE+1.93%
$BTW
Four hours into holding the position, it took another hit🔥 Prices are falling and positions are shrinking too; the long liquidation cascade hasn’t let up. Retail traders are still accelerating their pursuit of long positions, eagerly trying to catch falling knives. This move is clearly baiting longs; every spike is just handing money to shorts. A breakdown is imminent—get out fast😤
post-image
BTW-2.81%
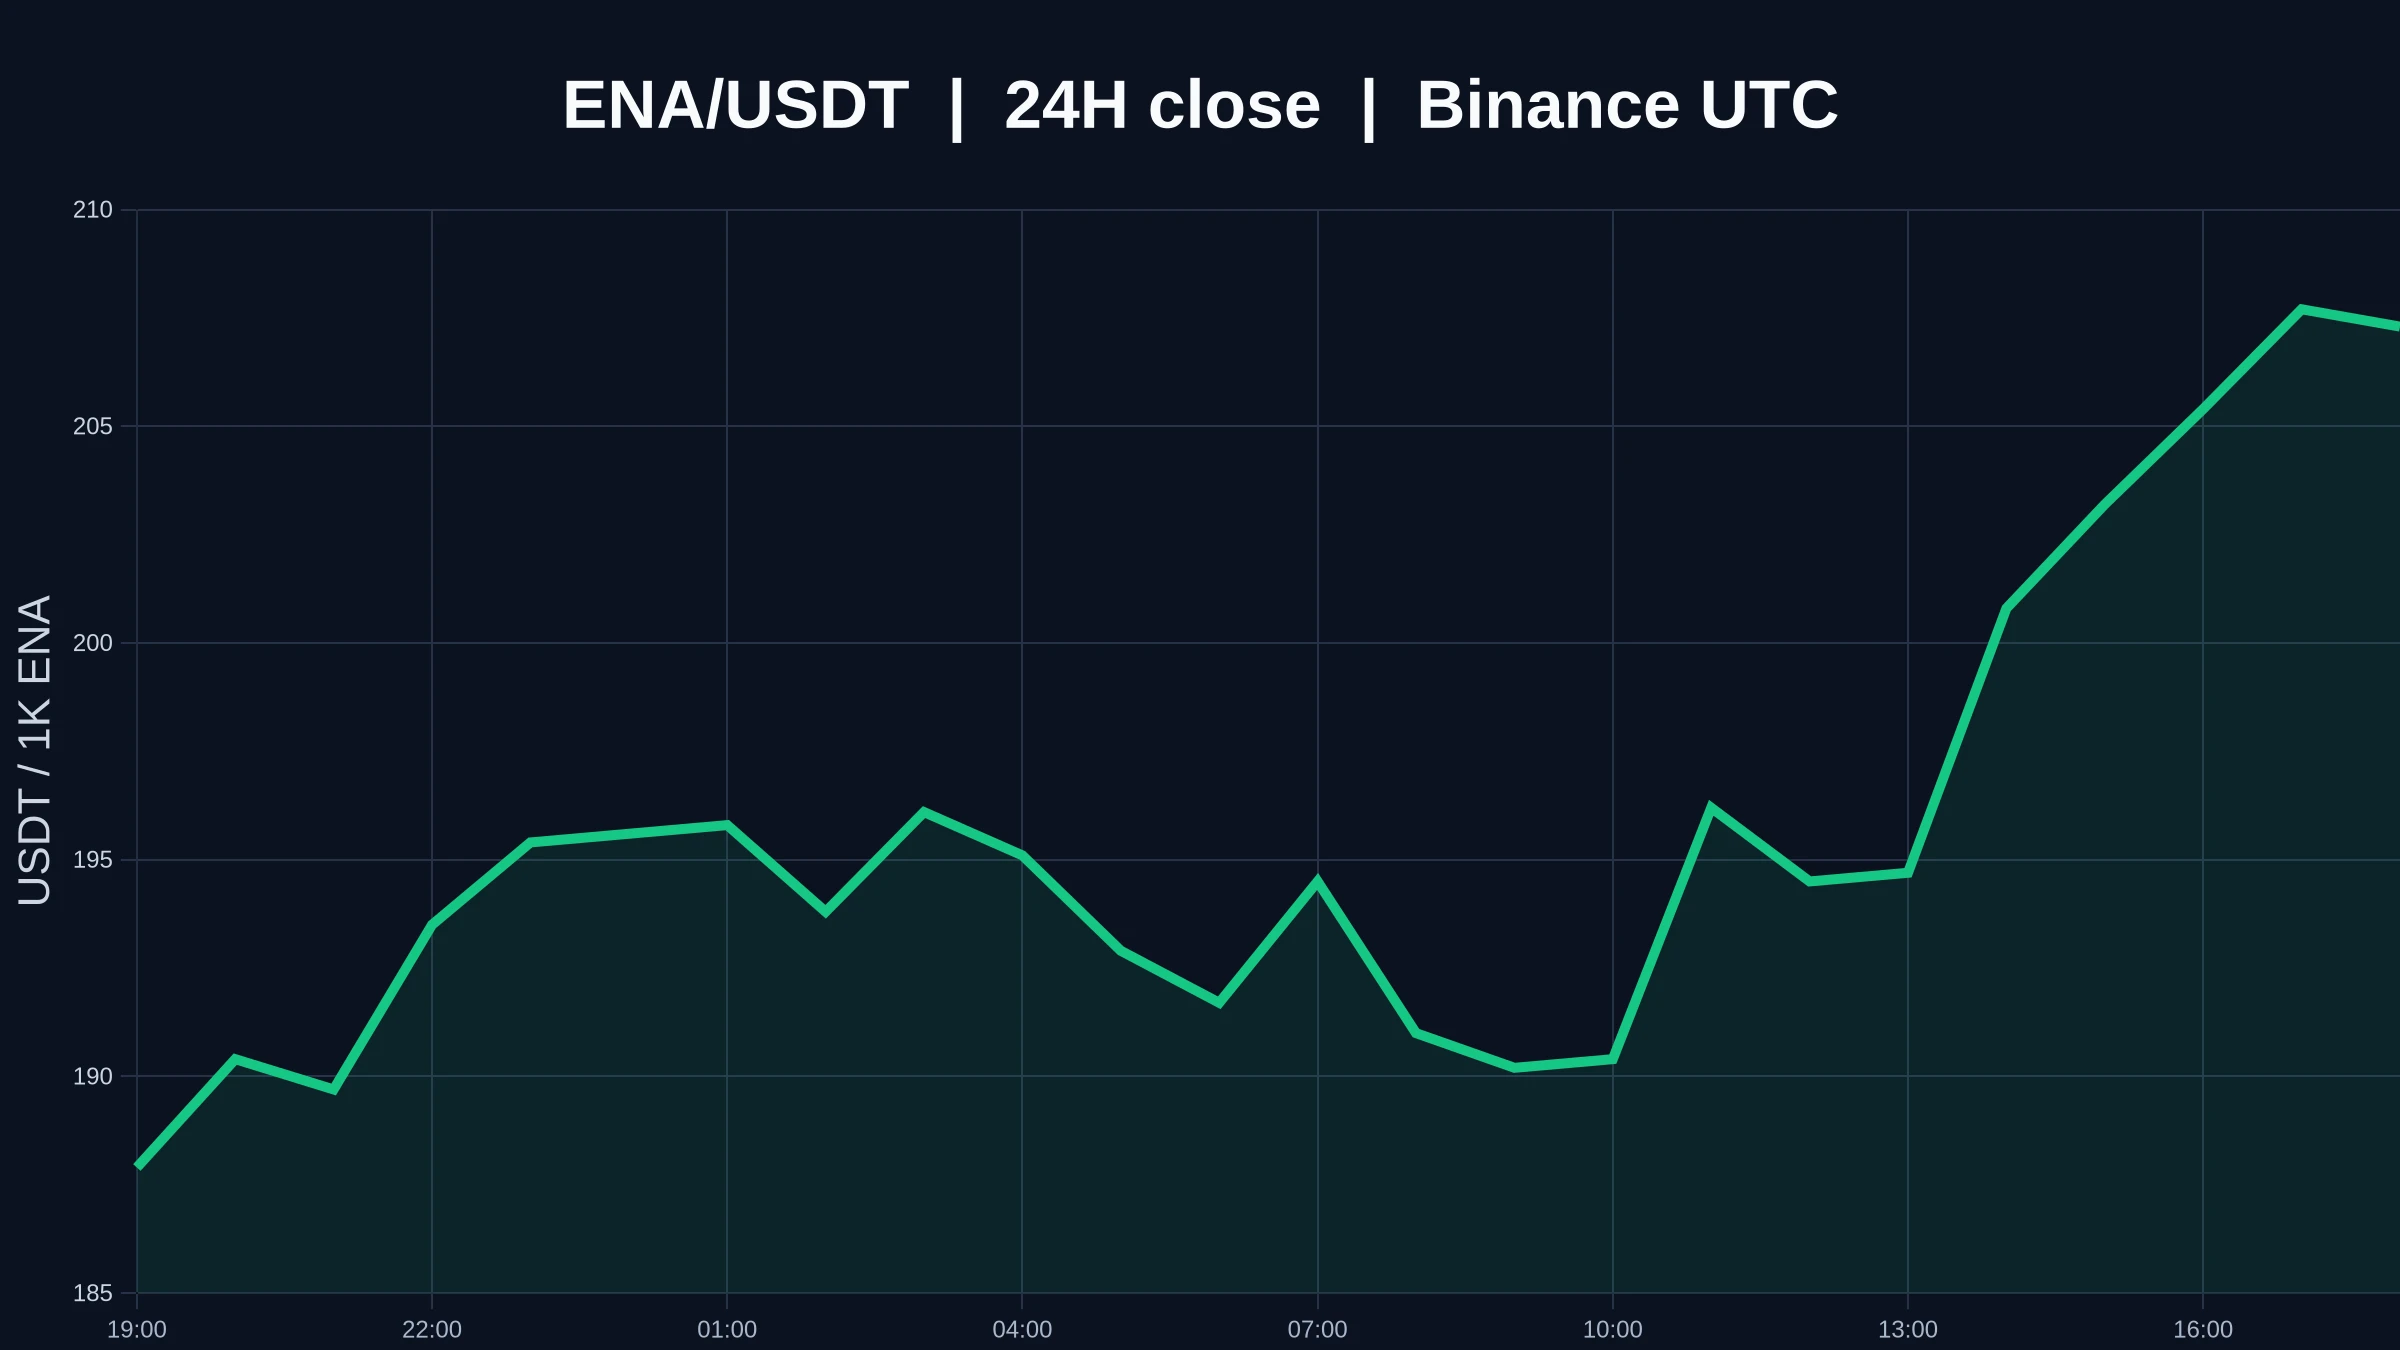
$ENA 24-hour change: +11.61%, currently at 0.2077. The 1-hour chart is leaning bullish, and the 4-hour chart is too. Whether both charts are telling the same story matters more than the gainers and losers list. The key here is whether the move continues after a sharp swing. A big 24-hour gain or loss describes what has already happened. Whether the next leg continues depends on whether key levels and trading volume continue to confirm the move. The gainers and losers list records the past; what is most likely to mislead is treating the past as the next move.
The distances on the chart are cle
post-image
ENA+11.31%
Load More

Join 40 M users in our growing community

⚡️ Join 40 M users in the crypto craze discussion

💬 Engage with your favorite top creators

👍 See what interests you

Trending Topics

USEarningsSeason

101.1k Views3.53k Discussing

The U.S. Q3 earnings season is in full swing, with major tech companies including Tesla and Meta reporting results. Market focus is shifting beyond revenue and profit toward AI spending, capital expenditure, margins and forward guidance. Which company’s earnings are you watching most closely?

GateWCTCS9GlobalTradingCompetition

725.41k Views8.09k Discussing

USConsumerSentimentNearRecordLow

12.39k Views299 Discussing

View More