
Square
Following
Hot
News
Notifications
Profile
Share your thoughts
placeholder
Article
bitcoin:native pivot after the close tomorrow
post-image
BTC-0.67%
📡 Signal Card | BullishBanter Channel
$SNDK Long signal: ▪️ Entry: 870 ▪️ Targets: 920 / 960 / 1000 ▪️ Stop loss: 790 ▪️ Time: Not specified (just captured)
Speaking of which, I reposted this account’s $ETH trade earlier today, and here it is again—very diligent 😂
I’m just reposting it as is, no edits or embellishments. Whether to follow and how much to put in is up to you, babe—the stop loss is 80 points from entry, so make sure you can handle that before jumping in.
Shared as a personal record; not investment advice. #VoiceOfTrading: Your experience deserves to be heard.
SNDK-22.24%
ETH-1.26%
Trenches
ZIG
Z
bade
b
ZIG
0x8c...1145
Market Cap
$.
Change
.
24h Vol
$.
Holders
.
BTC
B
bade
b
BTC
C5xp...pump
Market Cap
$.
Change
.
24h Vol
$.
Holders
.
CORLA
C
bade
b
CORLA
0xba...7777
Market Cap
$.
Change
.
24h Vol
$.
Holders
.
STONK
S
bade
b
STONK
6GmA...UNgx
Market Cap
$.
Change
.
24h Vol
$.
Holders
.
DESSA
D
bade
b
DESSA
npz2...pump
Market Cap
$.
Change
.
24h Vol
$.
Holders
.
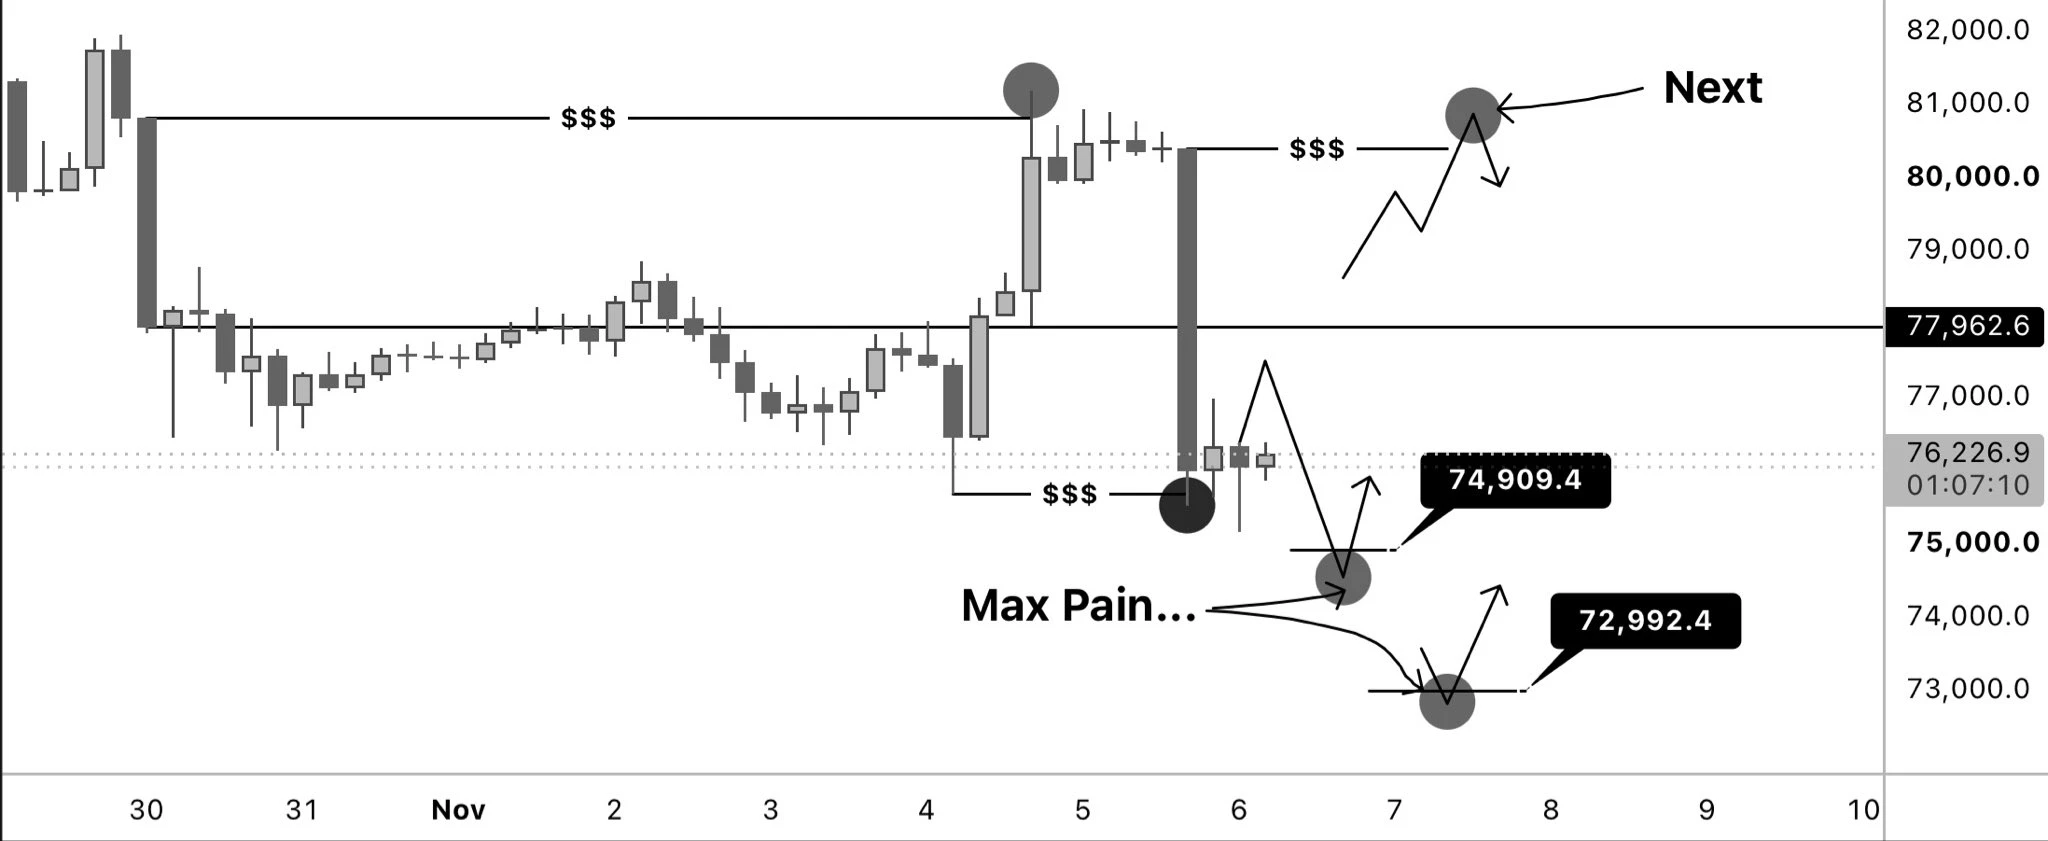
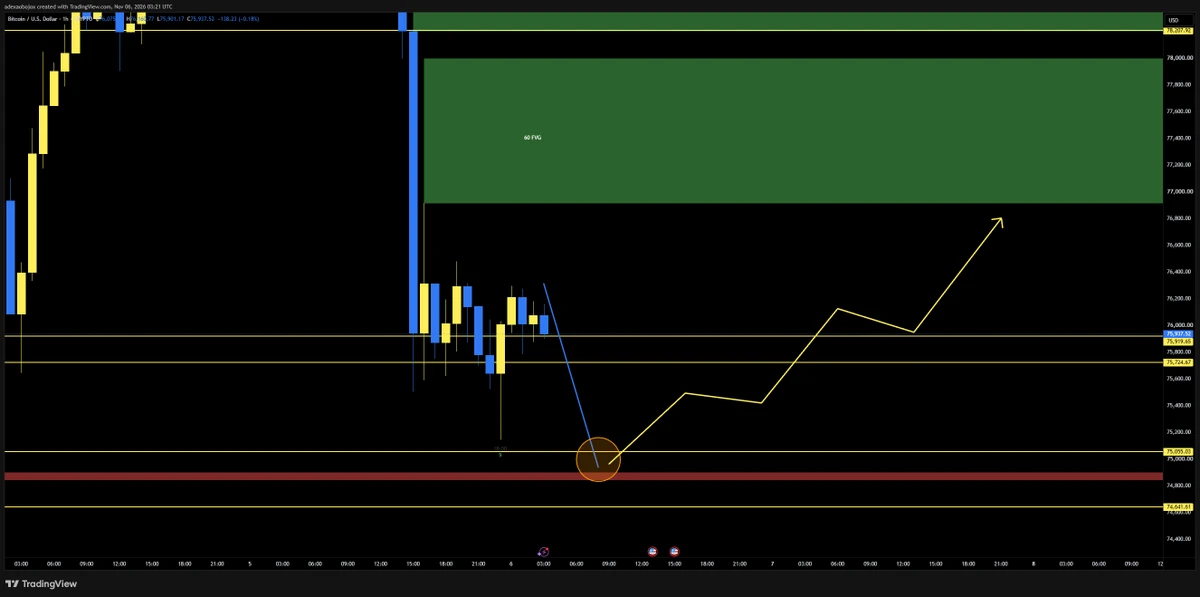
$BTC | Update (4H)

It seems like we’re heading lower to fill the Monthly FVG.

Bias for the day is Bullish, But a sweep of the current lows before a pullback is definitely something I’m eyeing on.

74.9k-72.9k is the most important zone for bulls to hold. You don’t wanna see them failing to take control from there.

They’re hunting both sides for now, So it’s extremely likely that we retrace back up towards 80.4k and fill the imbalance created by yesterday’s drop once we establish a low here.
post-image
BTC-0.67%
How can you determine the next direction when BTC is moving sideways?

In the cryptocurrency market, sideways movement is often more frustrating for traders than a one-way rally or decline. Prices fluctuate repeatedly within a range, and there seem to be plenty of opportunities, but few people can really capitalize on them. Some keep going long, others repeatedly go short, only to find that fees and frequent stop-losses are steadily eating away at their accounts.

So, how should you determine the next direction while BTC is moving sideways?

First, watch for changes in trading volume. If volum
post-image
BTC-0.67%
BTC market update
live-cover
LIVE2,744
📡 Signal card · reposting crew online
Bit_Guru just posted this $HOME short position, and I’m reposting it as is:
⏰ Time: Not specified🎯 Entry: 0.005492🛑 Stop loss: 0.005529💰 Targets: 0.005436 / 0.005399 / 0.005344
Come to think of it, I reposted his $EVAA trade earlier today, and here he is again. He’s certainly diligent👀
Let me make this clear upfront: I’m only sharing the signal, not taking responsibility for any losses. Whether you follow it and how big your position is are up to you, so don’t get carried away.
Personal notes shared, not investment advice. #SouthKoreaSeeksToDelayCry
HOME-1.20%
EVAA-0.42%
11.6 ETH Analysis

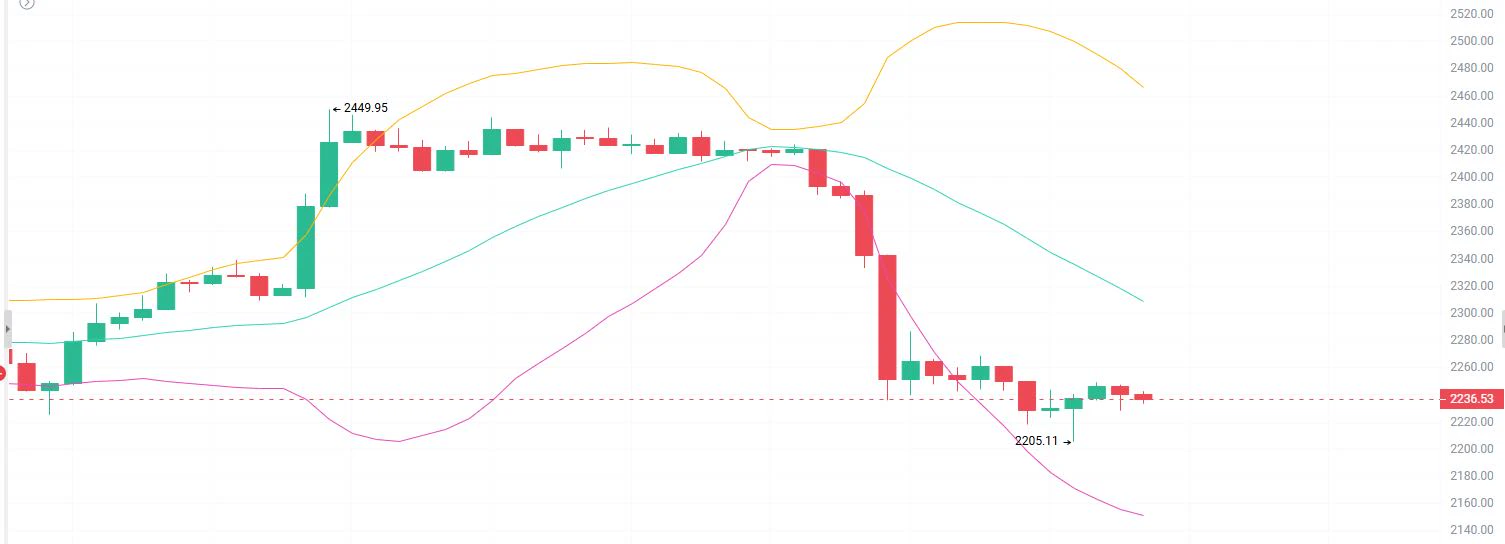
Analysis: Short near 2250-2270 on a rebound, with a stop at 2290. First target: 2220; second target: 2205.

The actual 1H chart shows that after rising to a period high of 2449.95, the price came under pressure and pulled back, closing with a long bearish candle on increased volume and breaking through key support levels in succession. It dipped to a low of 2205.11, and is currently quoted at 2238.32. The short-term uptrend structure has been broken, with concentrated selling pressure from bears. The market has officially entered a weak correction phase. After becoming overs
post-image
ETH-1.26%
BTC Outlook for the Coming Year: Analysis of Three Possible Market Scenarios!

In the cryptocurrency market, many investors want to know in advance how high BTC will rise over the coming year. But predicting prices is never simple. Rather than trying to set a definite target, it is better to analyze several possible scenarios based on different market conditions.

First, the bullish scenario: Continued inflows. If global liquidity conditions improve, institutional funds continue to flow in, and market demand keeps growing, BTC could regain upward momentum. In this case, the market may have an
post-image
BTC-0.67%
ETH Strategy This Morning

Trade:
Short around 2250-2270
First target: 2230-2210
Second target: 2190-2160
Use a stop-loss

ETH is in a downtrend, and the current move is only a weak recovery after a sharp drop. The rebound is meeting resistance at the middle band, while the weak MACD golden cross signals a continuation of the downtrend. The strategy is to firmly avoid chasing the drop and wait for a failed rebound, with gains stalling and a bearish close, before testing a short position with light size. Targets are the lower band and the previous low; keep the stop strictly above the previous
post-image
ETH-1.23%
📡 Signal card | BTCSOS just captured
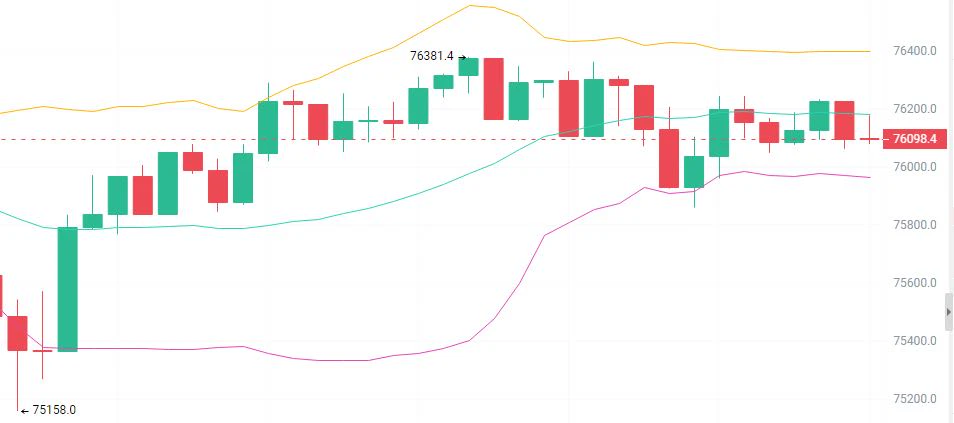
Source: MacDyson channel Asset: $BTC Short entry: 76100 Stop loss: 76410 Target: 75195
Sis is relaying it as-is, as usual: risk is about 310, target room is about 905, and the risk-reward ratio is roughly 1:2.9. Looks like risk management is built right into the plan.
But remember, babes—I’m just passing along the message, not pressing the button for you. Whether to follow it and how much to put on the position are decisions for your account, not mine.
Shared as a personal record, not investment advice. #South Korea seeks to delay crypto tax until 2029
BTC-0.65%
AI can't do without Trump, and crypto can't do without Trump. Those who voted must be regretting it now, right?🥹#美股史诗级抛售 $BTC ‌
post-image
BTC-0.65%
the great thing about being in crypto for 5 years is that it has prepared me for today’s stock price action where i was able to capitalize on the whole move and leverage full portfolio to extract maximum profit and secure generational wealth
post-image
Weak recovery after a sharp drop
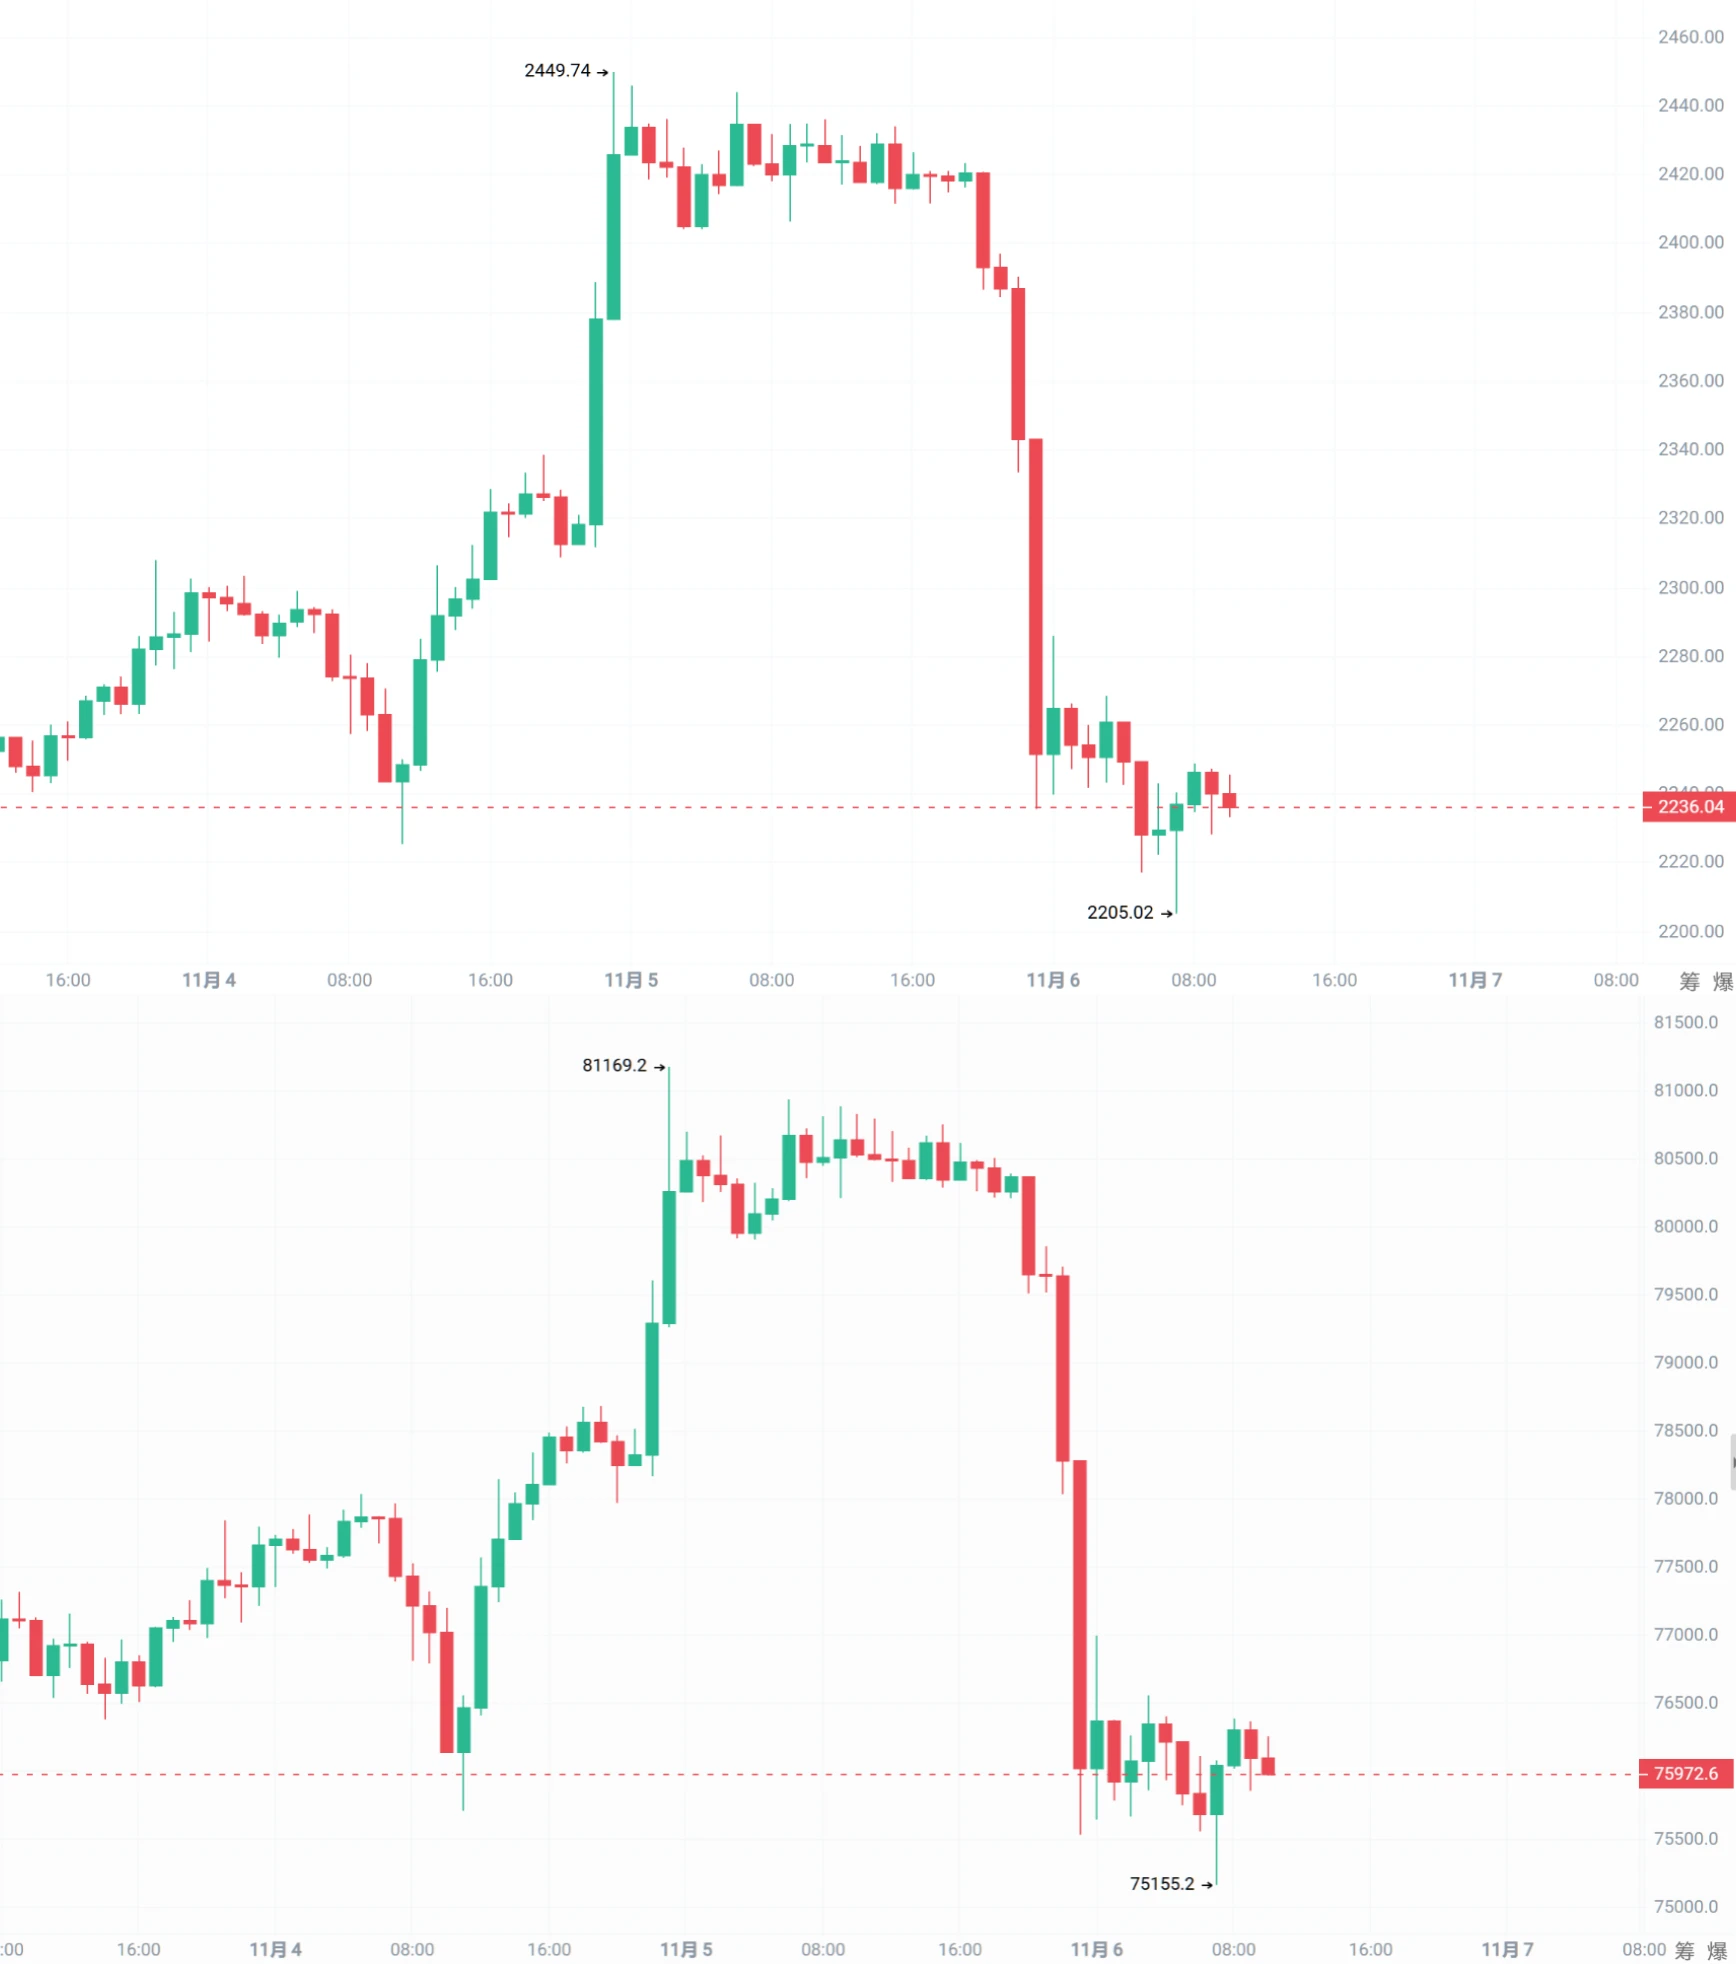
11.6 $BTC $ETH | Morning market recap
Weak range-bound recovery

BTC: The price has attempted to rebound after bottoming at 75,155, but the rebound is extremely weak, with small candlestick bodies

ETH: The price is currently hovering around 2,240, which is both a round-number level and the lower boundary of a previous high-volume trading zone

Short-term trading approach:
BTC: Watch around 75,800; consider opening a small long position on a pullback to support
ETH: Watch around 2,225; consider opening a small long position on a pullback to support
Target lev
post-image
BTC-0.67%
ETH-1.26%
Bitcoin morning outlook

Trade:
Short around 765-770
First target: 760-755
Second target: 750-740
Set a stop-loss

After a sharp drop, Bitcoin is recovering from lows. The broader structure remains bearish, but the momentum indicator has just formed a golden cross, so chasing shorts now could easily get stopped out by a rebound. The strategy is to patiently wait for price to rebound into the resistance zone above, then try a small short position after a clear sign of stalling and a bearish candle appears. Target the middle-band support, with the stop firmly above the previous high. In my view,
post-image
BTC-0.65%
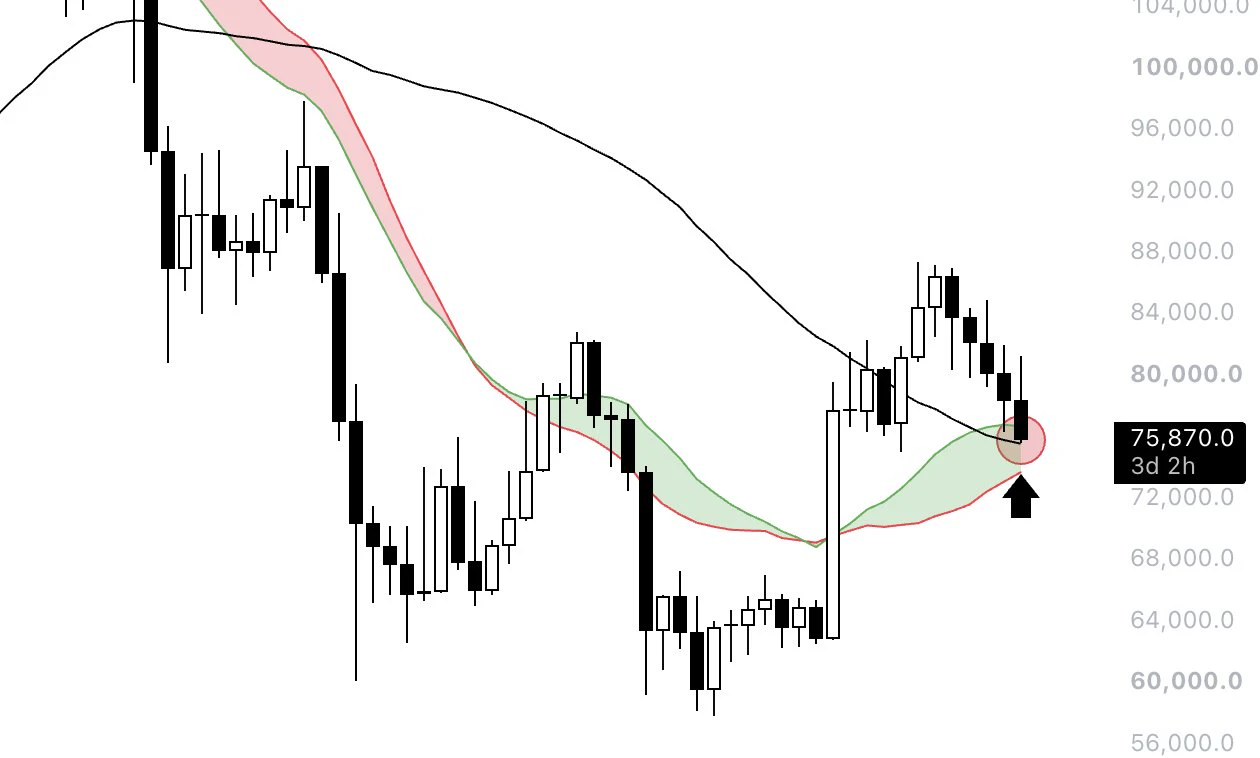
$BTC This is the only chart you need to watch...

We're sat right on the 50 week MA and the bull market support bands.

Historically, multiple weekly closes below this region mean the bear market is still in effect and this rally was manipulation.

Lose these levels and the previous low of $57k could get retested.
post-image
BTC-0.67%
$MUU Over 24 hours, it got cut in half, then halved again. That huge -23.22% candle left everyone who chased the rally buried at the 18.68 peak. The current price is 14.12, after plunging as low as 12.22, with the 312M in trading volume made up entirely of battered tokens changing hands.
First, let’s look at the hot narrative and its correlation. BTC is moving sideways around a key level today, while rate-cut expectations on the Fed side keep swinging back and forth. Big money is sitting on the sidelines, and liquidity is draining from the altcoin market. For a highly volatile asset like $MUU,
MUU-35.00%
BTC-0.67%
  • 9
  • 2
#ETHDrops5.5% Ethereum just gave back a week of gains in a single session, and the damage is concentrated in one place. From the $2,424.82 close on 4 November to the $2,238 close on 5 November, ETH shed roughly 7.7%, and the intraday low of $2,206 tested a level that had held through most of October. At around $2,242 this morning, the question is no longer whether ETH is weak, but whether the $2,200 zone can hold on a closing basis.

The move in numbers
The 4 November candle opened at $2,274.75, rallied to $2,450, and closed at $2,424.82. The 5 November session opened at $2,424.82, touched $2,
ETH-1.26%
BTC-0.67%
  • 6
  • 2
How can you tell whether a BTC pullback is a normal correction or a trend reversal?

In BTC trading, one of the most common mistakes people make is treating every decline as a trend reversal. As soon as the price pulls back, they rush to close their positions or even open short positions. But sometimes the market is simply making a normal correction during an uptrend, after which the price strengthens again.

So, how can you distinguish a normal pullback from a genuine trend reversal?

First, watch the structure of highs and lows. In a healthy uptrend, prices typically form progressively highe
post-image
BTC-0.67%
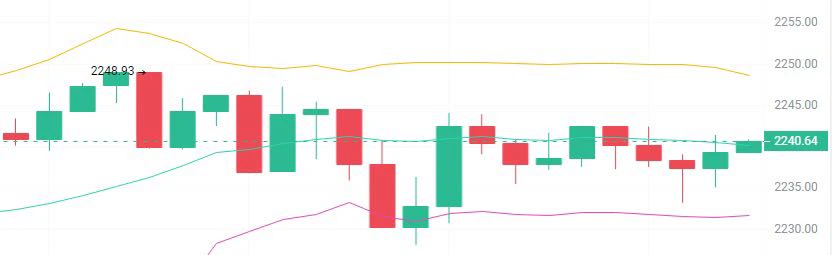
11.6 ETH Trade Setup$ETH
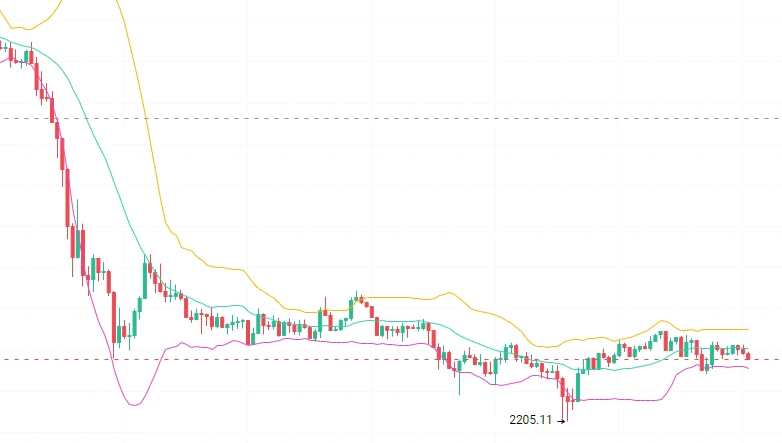
ETH fell continuously from its highs early on, with selling pressure pushing it down to 2205.11 before the decline finally stalled. The market did not stage a strong rebound, instead moving sideways repeatedly at the lows to form a base. All three Bollinger Bands have flattened, and the channel continues to narrow, indicating a temporary balance between bulls and bears in the bottom region and a slowdown in the downtrend.
The current price is fluctuating near and below the Bollinger middle band, which acts as short-term resistance, while support from the lower band is
post-image
ETH-1.23%
Load More

Join 40 M users in our growing community

⚡️ Join 40 M users in the crypto craze discussion

💬 Engage with your favorite top creators

👍 See what interests you

Trending Topics

USStocksFaceHistoricSelloff

586 Views3.47k Discussing

U.S. stocks suffered a sharp selloff on Thursday, with the Nasdaq closing down more than 5% and the Philadelphia Semiconductor Index falling over 12%. AI and chip stocks including $NVDA and $AMD were hit especially hard. Markets are reassessing AI valuations, data-center spending and future returns. Is this just short-term deleveraging, or the start of a deeper correction in the AI trade? Which sectors are you watching next?

GateLaunchesPoSECProofOfSecurity

11.51k Views567 Discussing

USNonfarmPayrolls

8.95k Views3.98k Discussing

View More