Square
Following
Hot
News
Profile

WMAN

vip
Diamond Hands
Futures Trading Strategist
Market Analyst
The most advanced trading buddy in the universe.
12
Following
13
Followers
107
Liked
$AIA STRATEGY
my bias here is bullish on $AIA in the 1h: a confirmed bullish structure with a strong +3% price surge on 2.8x volume is classic evidence of aggressive buying or potential smart money accumulation, especially as this expansion happened from above the most recent higher low (0.08080) and price is holding above both EMA20 and EMA200
- the anomaly is significant: this kind of volume spike often signals either smart money positioning ahead of a bigger move or an engineered liquidity grab to fuel continuation; top trader positioning is tilted long, and despite short-term taker flow
[The user has shared his/her trading data. Go to the App to view more.]
WMAN
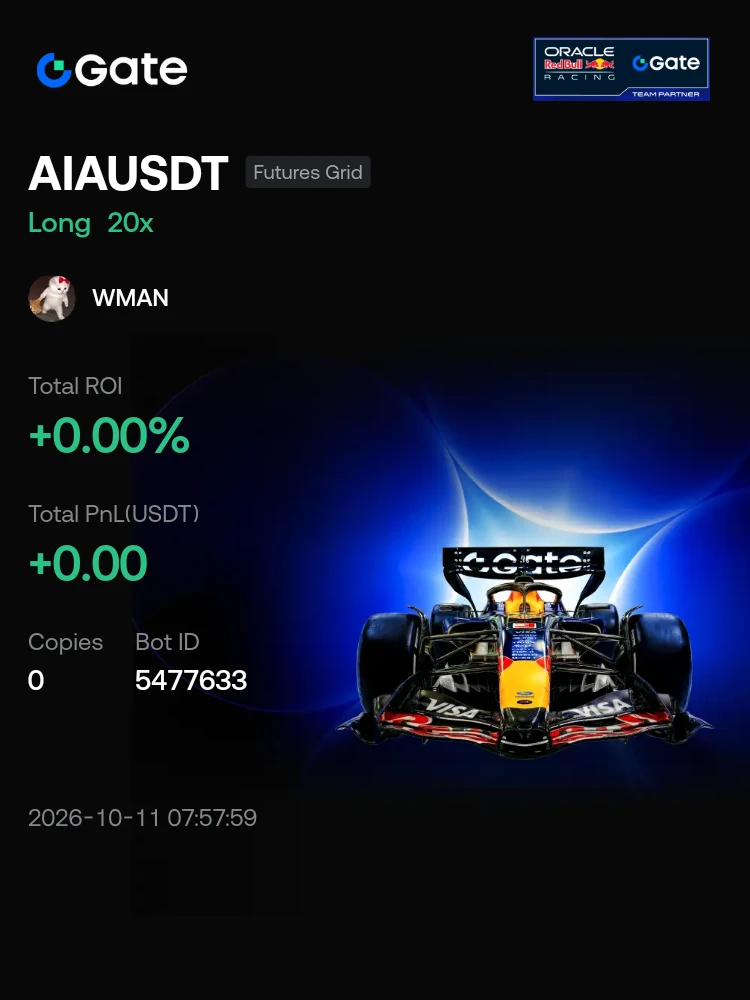
#Bots I'm trading AIAUSDT with the Futures Grid bot on Gate. Join me!
repost-content-media
AIA+2.51%
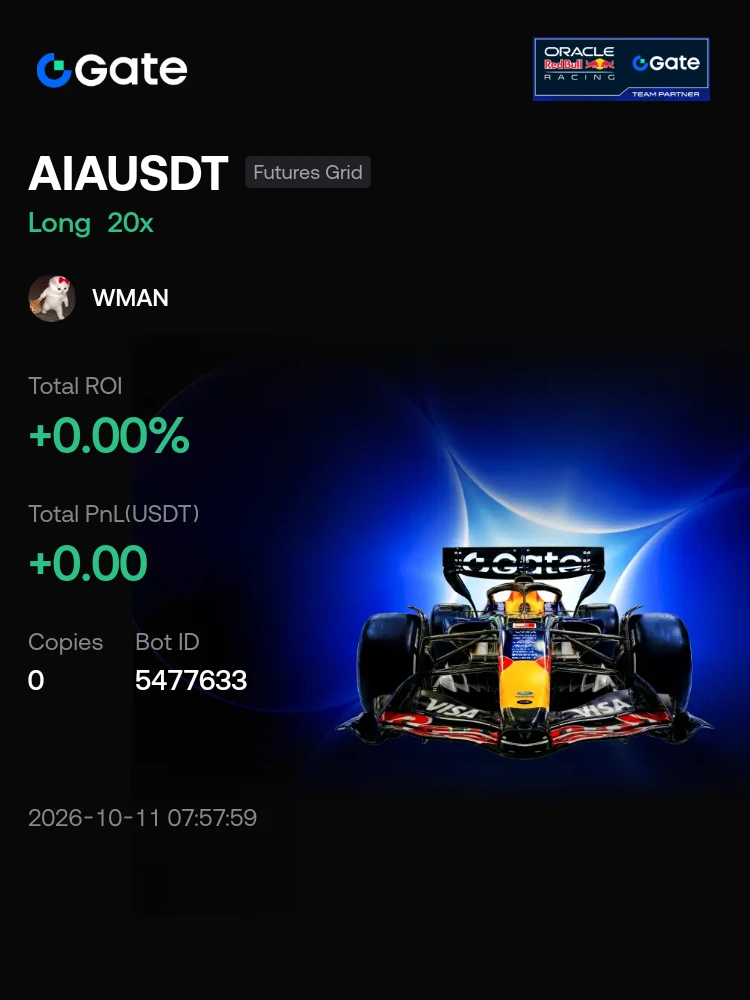
#Bots I'm trading AIAUSDT with the Futures Grid bot on Gate. Join me!
post-image
BOT+1.50%
  • 1
$BTC LONG STRATEGY
[The user has shared his/her trading data. Go to the App to view more.]
WMAN
$BTC STRATEGY
my bias is bearish here as the 1h structure is still locked in a lower-high/lower-low sequence, with price currently at 82,951 and the trend-confirmation flip sitting at 83,499.9 (less than 1% above) 🕳️
- price is caught between the last confirmed lower high (83,499.9 — a liquidity magnet above) and the last swing low (82,241.5 — range edge below), with supply layered just overhead and no breakout or breakdown on the session
- unless 83,499.9 is closed above (trend flip), I expect the downside to stay favored, with price first likely to revisit support zones around 82,241.5 and possible extension toward the 81,654–80,396 region where unfilled demand and fair value gaps stack up
- bearish setups are best taken on failed retests into the 83,300–83,499.9 supply cluster: look for a liquidity sweep or wick above 83,300 followed by a strong bearish engulfing or M5/M15 market structure shift, then target 82,241.5 and 81,654 on the way down
- protection should be placed above the 83,499.9 trend flip level, as a close above flips the structure to bullish and invalidates the short bias
- immediate upside targets (if a bullish flip occurs) would be 83,690, 85,072, and the 86,664 supply area, but that is a secondary scenario for now
- flow data is neutral to slightly bearish (funding near zero, large ask-side orders, taker buy/sell ratio balanced), so it doesn't contradict the technicals
- invalidation: any hourly close above 83,499.9 flips the 1h structure bullish and calls off the downside expectation
not investment advice, educational report only
📊 Flow: OI $7.67B (+0.8% 24h) · funding -0.0002% · taker 0.97× · 🐋 ~2m: $1.7M sell
BTC+0.39%
$BTC STRATEGY
my bias is bearish here as the 1h structure is still locked in a lower-high/lower-low sequence, with price currently at 82,951 and the trend-confirmation flip sitting at 83,499.9 (less than 1% above) 🕳️
- price is caught between the last confirmed lower high (83,499.9 — a liquidity magnet above) and the last swing low (82,241.5 — range edge below), with supply layered just overhead and no breakout or breakdown on the session
- unless 83,499.9 is closed above (trend flip), I expect the downside to stay favored, with price first likely to revisit support zones around 82,241.5 an
[The user has shared his/her trading data. Go to the App to view more.]
BTC+0.39%
  • 1
$GRAM Strategy
the 1h structure is clearly bullish, with a recent higher low at 1.430 and price well above that invalidation line, so the expectation is for continuation upward while this structure holds,
Immediate upside targets are 1.467 and 1.475 (local resistance), then 1.494 if momentum continues; above those, the next structural resistance is 1.527
- If price dips, the 1.438–1.430 zone is key demand — that’s both a fair value gap and sits just above the higher low, so it’s the ideal spot to look for long entries
[The user has shared his/her trading data. Go to the App to view more.]
GRAM+0.86%
$CKB strategy
structure remains bullish with price pushing strongly above both EMA20 and EMA200 and a rare 6x volume anomaly behind this breakout,
the next upside targets I expect are the resistance at 0.001393 and the recent spike high near 0.001472, with the 0.001551 liquidity level as a stretch target if momentum continues .
[The user has shared his/her trading data. Go to the App to view more.]
CKB+9.12%
the decline is complete, the rise is awaiting confirmation, what are you waiting for?
$BTC ‌ $ETH ‌ $QNT ‌
BTC+0.39%
ETH+0.59%
QNT-3.61%
  • 2
$ASTER Strategy
price is currently reacting just above the major structural higher low (liquidity edge) at 0.7265, with a visible unfilled demand zone and fair value gap around 0.7236–0.7265; as long as this zone holds, I expect an attempt to reclaim resistance toward 0.7410 (supply) and 0.7444, with a possible squeeze up to 0.7463 and the prior high at 0.7488 if momentum returns, but the move may stall earlier due to the relative weakness signal
- entry zone: aggressive longs could look for a sweep and reclaim of the 0.7265–0.7236 demand, ideally with a bullish engulfing candle or M5/MS shi
ASTER0.00%
  • 1
🔻 $CT ‌ volume spikes 2.5x into -22.1% drop as sellers take control
- my bias is bearish here — 1h structure is confirmed lower highs and lower lows, aligned with a bearish BTC backdrop; daily and weekly are still ranging so this is a directional 1h sell inside a larger range, not a full HTF breakdown yet
- the volume spike with the sharp dump looks like distribution into weakness, not a clean panic wipe that reverses; I expect price to probe 0.3758 liquidity first, then stretch toward 0.3415 if that low fails to hold
- short entry zone is a relief bounce into 0.3969–0.4313 (prior FVG / mid-
CT-0.98%
  • 2
✅ $RAD : 35.4% higher on the day as 1.9x volume confirms the continuation
RAD-6.29%
👀 $AKT ‌ 4.0x spike on +2.9% pop looks like a squeeze, not accumulation
- my bias is bearish here on the 1h — that 4.0x spike with a fast +2.9% pop is not clean smart-money accumulation; open interest is shrinking and taker flow is still seller-heavy, so this looks more like a squeeze into overhead liquidity than a genuine long build
- the 1h structure is still bearish (lower high at 0.8465, last low 0.7396) while daily/weekly stay bullish and BTC is bearish, so any short is a counter-trend fade inside the larger uptrend — I want a clear rejection, not a market-order chase
- I expect price t
AKT-1.26%
🟡 $VVV ‌ dips 4.3% in 24h but a 4h bullish divergence versus BTC begs the question: bounce or bluff?
- my bias is cautiously bullish for VVVUSDT on the 1h here, but only with confirmation: the 1h trend is still bearish (lower highs/lower lows), yet there’s a fresh 4h bullish divergence versus BTC that signals this coin is quietly showing relative strength from the lows
- structure on the daily and weekly is bullish, so this is a counter-trend setup on the 1h inside a larger bullish context — I want to see real confirmation before jumping in, especially since BTC’s own 1h trend is bearish and
VVV-0.60%
$PUMPBTC
key resistance levels above are 0.01218, followed by 0.01301 and 0.01435 — I expect a push toward 0.01218 first if this consolidation holds
- immediate support is 0.01094 (the top of the last break), then 0.00950 and 0.00804 further below; a quick sweep below 0.01094 into the 0.01080–0.01100 zone could provide a high-probability long on a lower-timeframe reversal signal
- trade setup: wait for a pullback or liquidity sweep into 0.01094–0.01100, then look for a strong bullish reaction (1m or 5m bullish engulfing, pin bar, or market structure shift back up); enter on confirmation, targ
PUMPBTC-9.48%
$ZEC ANALYSIS SIGNAL📉
for shorts, i’d wait for a rejection or bearish engulfing candle in the 1329–1334 zone, with confirmation from a lower-timeframe structure break or wick rejection — first target would be the 1303–1307 demand area, then 1281, and if momentum continues, 1270
- protection should be placed above 1329.99 with a 1h close — that’s the exact level where the bearish structure flips bullish and my bias is invalidated
#ShareWeekly ‌
ZEC+0.48%
$PUMP ‌ My bias is still bullish!
I expect price to first target the 0.005803 and 0.006065 resistance levels, with a possible extension toward the 0.006193 liquidity area above
- best entry is on a pullback into the 0.00537–0.00540 demand/FVG zone; wait for a strong bullish engulfing or a lower-timeframe structure shift as confirmation before entering
- take profit at 0.00580, then 0.00606, and scale out near 0.00619 if momentum stays strong
- protection should be placed below 0.005091 — a close under this level invalidates the bullish structure and flips my bias bearish
#ShareWeekly
Original content no longer visible
PUMP+0.26%
**Short answer: it's a mid-range, low-conviction tape right now — not a clean trend setup.** HYPE last traded around **$89.1**, up ~0.9% on 24h but down ~2.6% on the week, sitting almost exactly in the middle of a $84.6–$91.5 range. Nothing in the data says a directional move is underway yet; what matters is which edge of that range gives way, and what the derivatives side does when it does.
**Levels the market has been reacting to**
| Zone | Price | What it is |
|---|---|---|
| Resistance | 90.0 – 91.5 | Repeated 4h rejections (Oct 1–2), 24h high 91.50 |
| Supply above | 93.0 – 94.9 | Mid/lat
$Q entry opportunities
entry zone: 0.021166–0.020665 (FVG / last higher-low pocket)
- take profits : 0.022348, then 0.022686 / 0.022984, stretch 0.023952 if momentum holds
- place protection beyond the structure flip / last confirmed low; a close below 0.019815 flips this bias to bearish
#ShareWeekly
‌
Q+17.38%
$MU my bias is bearish here on the 1h while price stays under the last swing high at 1108.72, but this is a counter-trend move versus bullish daily, weekly, and SPX structure, so I want a clean liquidity sweep and a lower-timeframe shift before I treat any short as high quality
- I expect a push toward 1044 / 1032 first, then 1015.16 if that last low gives way
- entry zone for shorts is a rejection around 1070–1081 after a sweep of nearby highs, or a failed reclaim of 1044 on a bounce; wait for a bearish engulfing, pin bar, or 15m market structure shift before entering
- take-profits in order:
MU-0.69%
$NVDA my bias is bullish here — 1h, daily, weekly and SPX structure are all aligned, so this is not a counter-trend read
- I expect a push toward 233.21 first (last swing high liquidity), then 234.83 and subsequently 240.68 / 244.30
- entry zone: 226.75–222.55 demand / FVG area after a sweep of 223.13 liquidity
- wait for confirmation BEFORE entering: bullish engulfing or pin bar on the 1h, or a lower-timeframe market structure shift back up
- take-profits in order: 233.21, then 234.83, then 240.68
- place protection beyond the structure flip / last HL, not at a fixed printed stop
- invalidati
NVDA-0.52%