Square
Following
Hot
News
Notifications
Profile
Share your thoughts
placeholder
Article
$RSR ’s contract open interest has recently declined significantly, while short sellers are gradually applying pressure in an attempt to push the price toward lower support levels. The current trading bias for $RSR is bearish. Entry reference range: 0.001726–0.001735; first target: 0.001647; second target: 0.001580; stop-loss reference: 0.001787. Be aware that the price could rebound sharply near the 1-hour MA25 support band, triggering a short squeeze. Do not take oversized positions; position size must match your account’s risk tolerance. Risk warning: The above is for market analysis only
post-image
RSR-2.30%
Mildly bearish (sideways).
$DOGE ‌ ‌ is potentially facing a correction toward the 0.0690–0.0688 range after failing to sustain its gains. The MACD still shows positive momentum, but selling pressure is beginning to emerge around the MA30 (0.06995). Conclusion: The price action leans toward sideways to bearish. If it fails to hold above 0.0690, the likelihood of a further decline increases.

Note: Crypto and stock transactions carry the risk of loss. Please conduct your own research (DYOR) before trading. This information is for general purposes only and does not constitute a solicitation, r
post-image
DOGE-0.18%
  • 3
Trenches
牛逼
牛
bade
b
牛逼
0x96...7777
Market Cap
$.
Change
.
24h Vol
$.
Holders
.
STONK
S
bade
b
STONK
6GmA...UNgx
Market Cap
$.
Change
.
24h Vol
$.
Holders
.
BTC
B
bade
b
BTC
C5xp...pump
Market Cap
$.
Change
.
24h Vol
$.
Holders
.
ANSEM
A
bade
b
ANSEM
9cRC...pump
Market Cap
$.
Change
.
24h Vol
$.
Holders
.
PUSSY
P
bade
b
PUSSY
FZxH...Loat
Market Cap
$.
Change
.
24h Vol
$.
Holders
.
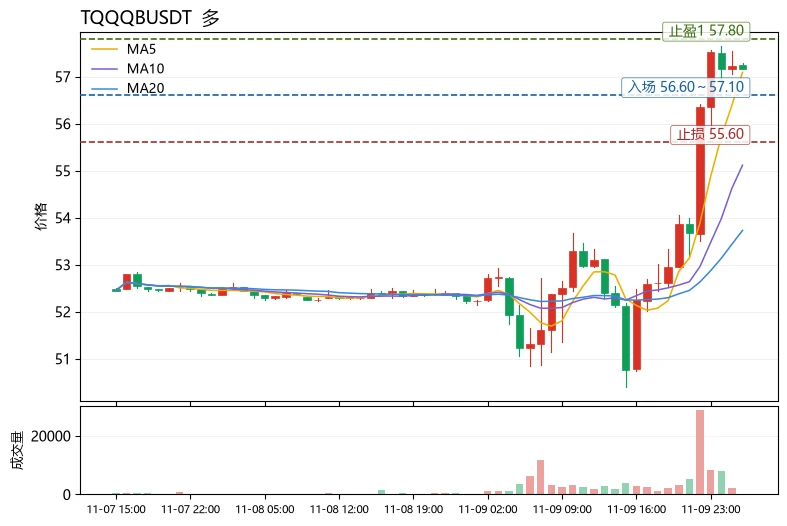
$TQQQB Current price 57.17, resistance above at 57.84 (upper Bollinger Band), support below at 57.09 (MA5), and second support at 53.73 (MA20). The price is tracking along the upper Bollinger Band, and MA5 has crossed above MA20, forming a bullish alignment. However, RSI has reached 73.2 and entered overbought territory, making the risk of chasing in the short term relatively high.
Technically, the MACD histogram at +0.5348 maintains bullish momentum, and the moving average system (MA5>MA20) remains intact, so the trend still leans bullish. However, the price is already up 9.44% over 24h, and
post-image
TQQQB
TQQQBTQQQB
Four.meme
MC:$3.36KHolders:2
0%
I'm trading on Gate, a top-tier exchange with a 13-year track record. Come join me and dive into the hottest events right now! https://www.gate.com/campaigns/6750?ref=VLARBF1YAG&ref_type=132
post-image
$WLD This thing follows the market down but not up; it just keeps crashing. Disgusting
WLD-5.61%
$UAI Quick short trade signal 📉‼️Short entry price: $0.0443 Stop-loss price: $0.0456 Take-profit target 1: $0.0430 Take-profit target 2: $0.0421 Take-profit target 3: $0.0410 Trade management: Lock in partial profits at take-profit target 1. After reaching take-profit target 1, move the stop-loss price to breakeven. Avoid adding to losing positions.
post-image
UAI-7.58%
#CPI数据前瞻 #WCTCS9 CPI Preview: How One Inflation Report Simultaneously Prices the Fed's Path and the WCTC S9 Leaderboard Race

This week's upcoming US CPI release is the highest-weight economic indicator on the current macro calendar. The reason is straightforward: with AI capex pushing up memory and compute costs while consumer electronics margins come under pressure, the composition of inflation is shifting — and the Fed's tolerance for "last-mile" inflation will directly determine the slope of the rate path. For traders participating in this data isn't just a macro event; it's a volatility w
AMD+12.31%
ARM+6.68%
AAPL+1.96%
QCOM+6.01%
  • 1
  • 1
Zec market update
live-cover
LIVE2,007
so think alex becker but better
post-image
The most critical point in today's market
$AMD 's positive contribution to Q basically offset Nvidia's drag. Estimated at the same time:
AMD: contributed about +0.42 percentage points to Q.
$NVDA : down about 5.33% at the time, dragging Q down by about −0.41 percentage points.
AMD is currently above today's extreme position-reduction level, with calls above it seeing substantial position reductions.
$AVGO is also nearing the GEX Wall at 320.
For Q, here comes the key point: whether AMD can hold above a market price of 500.
For bulls, today's target price has been more than met. Whether bulls
post-image
AMD+12.31%
NVDA-5.56%
AVGO+8.83%
OPERATION: SILICON DRAGON
Mission 2: Altman’s DeepSeek
post-image
DEEPSEEK-2.21%
My Agent Team Report on @kylon_ai: Token Taster, 129.5M tokens. What's your report? 👀
TOKEN-0.16%
$PEPE ‌ BULLISH (Trending Upward) The price continues to show an upward trend. The MA5, MA10, and MA30 are in a positive alignment, while the MACD remains bullish. However, after reaching 0.000005389, the price experienced a minor correction. Conclusion: PEPE has the potential to continue its ascent following a period of consolidation. Be mindful of a short-term correction if it fails to break through the resistance level at 0.000005389.

Note: Crypto and stock transactions carry the risk of loss. Please conduct your own research (DYOR) before trading. This information is for general purposes
post-image
PEPE+1.05%
  • 3
$INIT is showing signs of a strong rebound! After consolidating near $0.12 for a long time, buyers are entering with fresh momentum. The latest 4-hour candle is pushing toward resistance at $0.142. Add INIT to your watchlist. A confirmed breakout could kick off a new rally. Buy and trade $TRUMP
$SNDK
post-image
INIT-2.53%
TRUMP-0.95%
SNDK-0.18%
Back under the moving averages again. Is there anyone actually buying this, or are we just staring at a slow bleed now? $XPL really struggling to find a floor today.TP: 0.05033SL: 0.05462Market watch:
$ZEC : Current Price 1,175.66 - 24h Change: -5.50%
$EDGE : Current Price 0.3961 - 24h Change: +21.02%
post-image
XPL-0.60%
ZEC+1.16%
EDGE-7.65%
Take a look at the spot buying
It has been going up since the US market open and yet Bitcoin has been underperforming stocks
Why?
Because perps are shorting like hell, and this has been happening for weeks now
It looks like someone is trying to fill their billion dollar balance sheet hole
post-image
BTC-0.67%
$BTC ‌
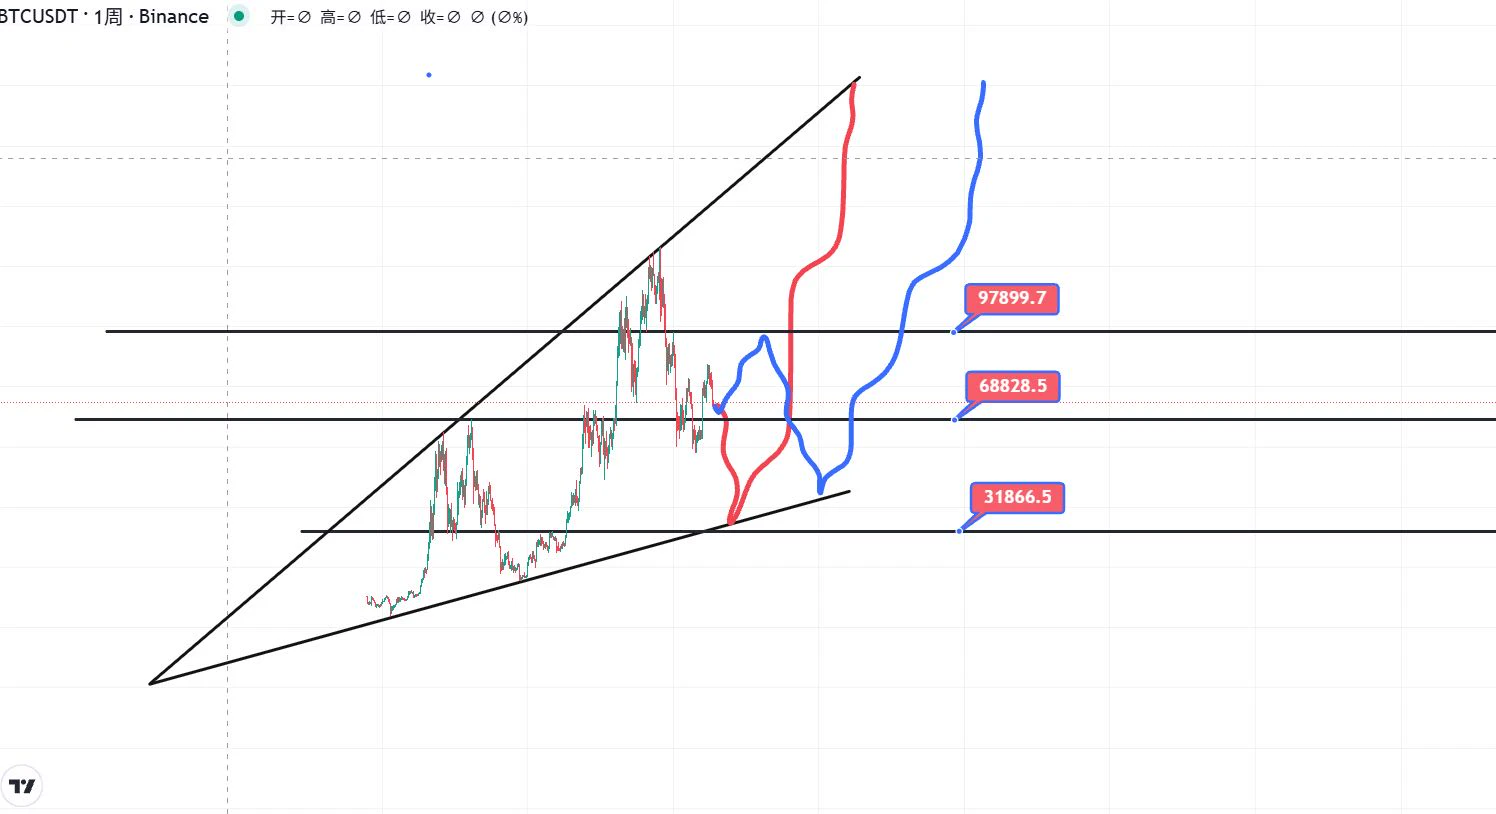
On the higher time frame, the 69,000–70k level is quite important. As I’ve said, around 70k is a key level; if it breaks below here, it’s a vacuum zone, and then it’s GG. The closer we get to this level, the more we should go long. I’m still bullish on around 100k in the future.
What do you guys think will happen??#比特币连续五周下跌
post-image
BTC-0.67%
There we go.
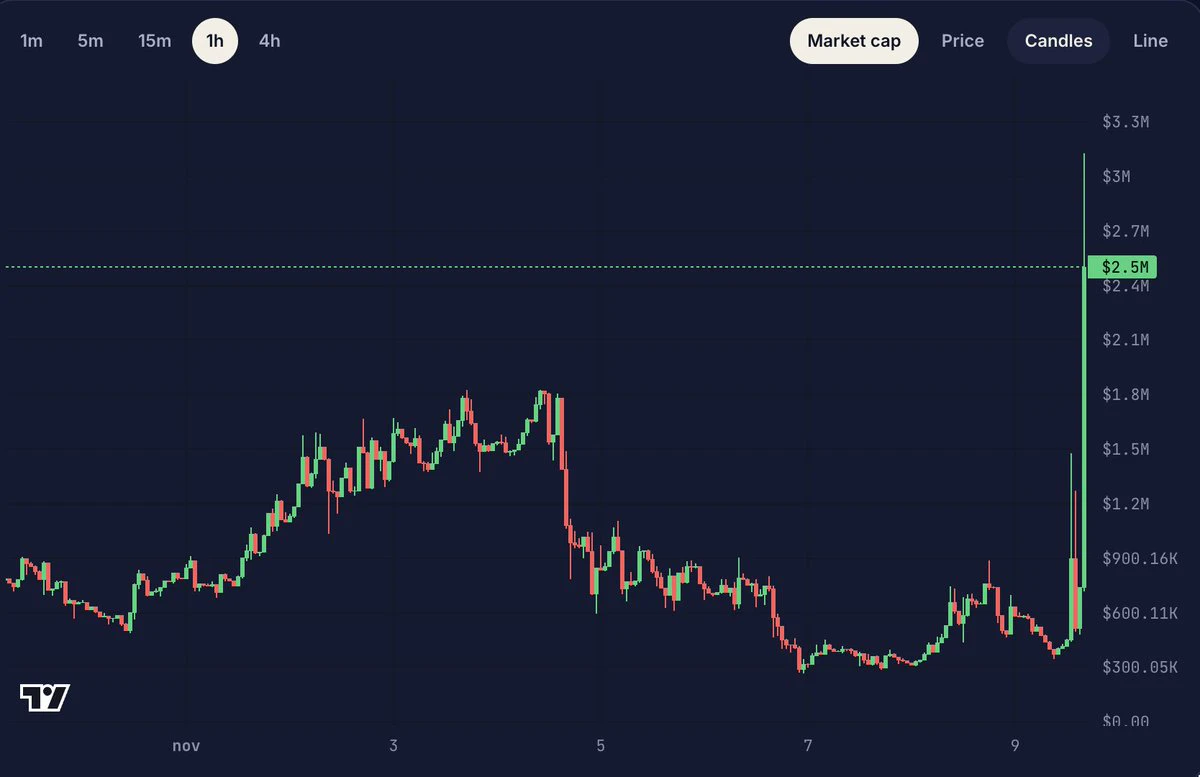
Launch-day jeets are out and the stronger Elysium plays are already showing strength
$BOXA is absolutely ripping!
Feels like $KLEOS and $AGORA could be next in line. 👀
post-image
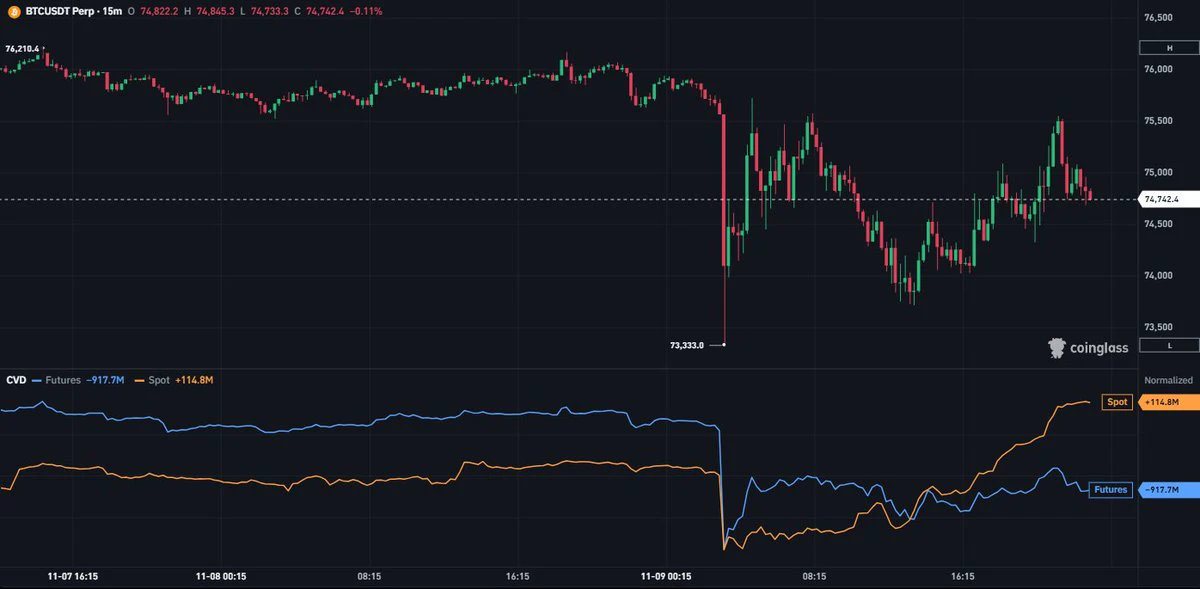
On Monday, I took profits on two long positions to start the week on a lucky note. It’s not that I don’t want to let them run; it’s just unnecessary. BTC at 755 is facing strong resistance, which it has tested three times today without breaking through. If I keep holding on, the profits will most likely be given back. If it pulls back to 73,800–74,200 later tonight, it’ll still be a good opportunity to go long!#美国10月CPI即将公布 #BTC闪崩插针 #Gate24小时净流入全球第三
BTC-0.67%
Load More

Join 40 M users in our growing community

⚡️ Join 40 M users in the crypto craze discussion

💬 Engage with your favorite top creators

👍 See what interests you

Trending Topics

USCPIDataIncoming

42.29k Views2.02k Discussing

The U.S. October CPI report will be released on November 10 at 8:30 a.m. ET. September CPI came in at 3.7% year over year, and markets will be watching closely for signs that inflation is cooling, especially in core CPI. A softer-than-expected reading could strengthen rate-cut expectations, while hotter inflation may pressure risk assets through higher Treasury yields and a stronger dollar. How do you think this CPI print will move $BTC, U.S. stocks and gold?

RedBullDoublePodiumInBrazil

8.81k Views30.59k Discussing

BTCFlashCrash

191.29k Views66.56k Discussing

View More