Square
Following
Hot
News
Profile
Share your thoughts
placeholder
Article
$CAP Up 37% in a day to 0.1117, then dumped back to 0.1079. I looked back at the altcoin rally patterns after the previous three halvings—every cycle, between the fifth and seventh month after the halving, we saw this “violent shakeout first, then a major rally” pattern. The current 179.7M trading volume at a price just above $0.10 shows a price-volume profile close to that of small-cap coins before they took off in Q4 2020, but the market cap base is a full order of magnitude lower than at the same point in the last cycle.
Bull case: The 24h low was 0.0773 and the high was 0.1117, a 44% range
CAP+39.51%
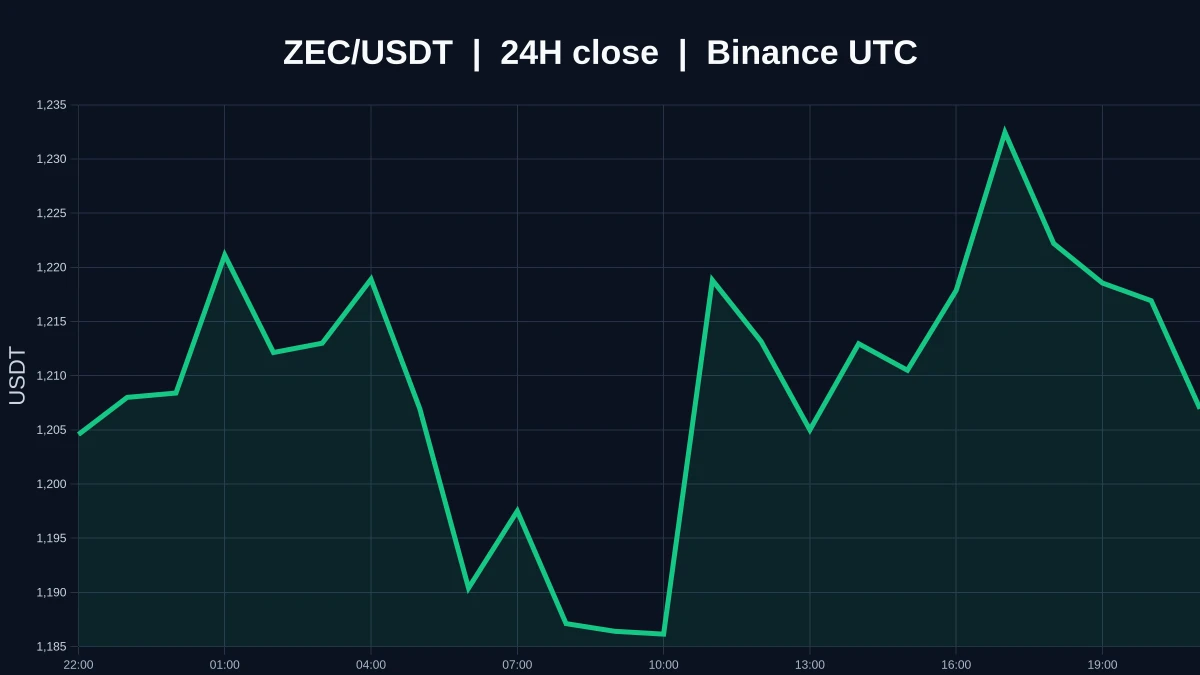
$ZEC is currently trading at 1207.09, up 0.71% over 24H. 1H is weak, with RSI 54.14; 4H is weak, with RSI 42.62. Watch whether it can hold above resistance at 1238.96 and recover if support at 1176.48 breaks; price action must confirm the direction. The market is volatile; for observation only.
post-image
ZEC+0.67%
Trenches
STONK
S
bade
b
STONK
6GmA...UNgx
Market Cap
$.
Change
.
24h Vol
$.
Holders
.
BTC
B
bade
b
BTC
C5xp...pump
Market Cap
$.
Change
.
24h Vol
$.
Holders
.
CNPY
C
bade
b
CNPY
0xc6...ddd2
Market Cap
$.
Change
.
24h Vol
$.
Holders
.
LAUNCH
L
bade
b
LAUNCH
AhBi...Qj6C
Market Cap
$.
Change
.
24h Vol
$.
Holders
.
ZIG
Z
bade
b
ZIG
0x8c...1145
Market Cap
$.
Change
.
24h Vol
$.
Holders
.
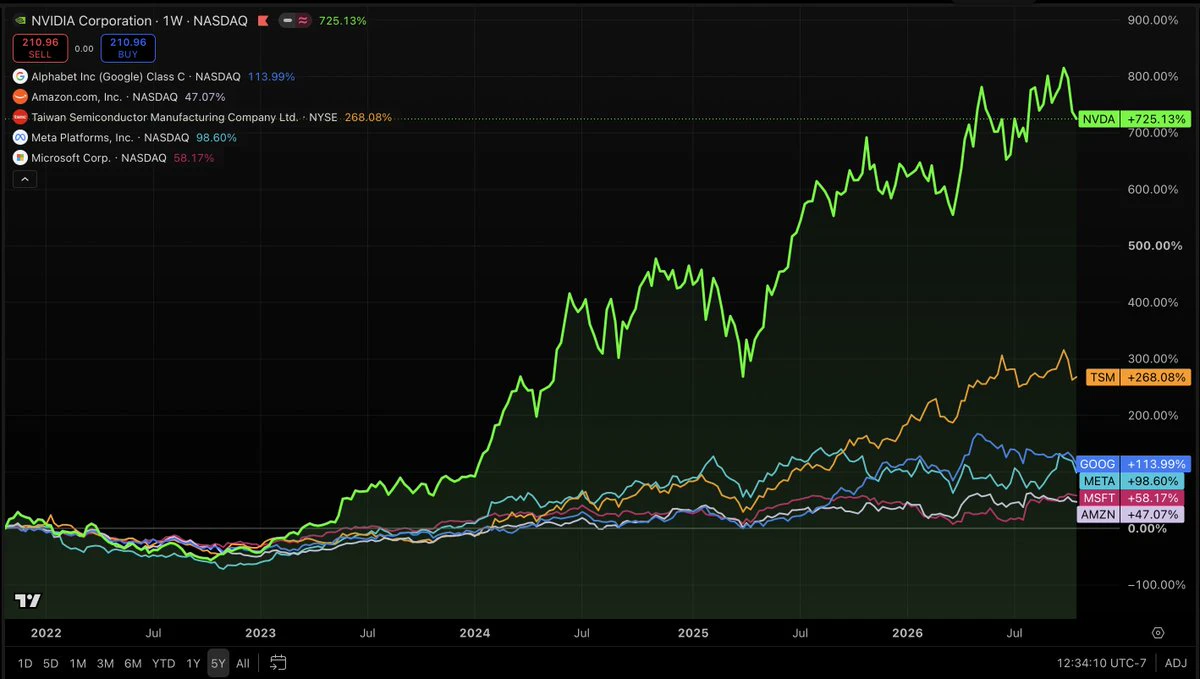
Forward P/E of the “AI bubble” stocks as of Friday’s close...
$NVDA: about 17x
$META: about 19.5x
$TSM: about 19.6x
$GOOG: about 24x
$AMZN: about 26x
$MSFT: about 26.5x
The S&P 500 overall: 18.7x
So 6 of the most talked about AI companies on earth trade right around the market’s average multiple... while growing a lot faster than the average company
Does that mean buy all of them tomorrow? No. P/E is one piece. Growth, moat, debt & where earnings are actually headed matter just as much
But next time someone tells you the whole AI trade is a bubble, ask them which one. Some are. Some aren't.
post-image
NVDA-0.60%
TSM+1.38%
GOOG-1.13%
AMZN-0.97%
MSFT+0.56%
$CL So my crude oil short position just got bigger again!
Opened at 104.3, added once at 103, and now added again! Average price is around 103.2 now, guys—let’s smash it! If it breaks below 101, I’ll keep adding all the way down to 90😂😂😂😂
post-image
CL-1.03%
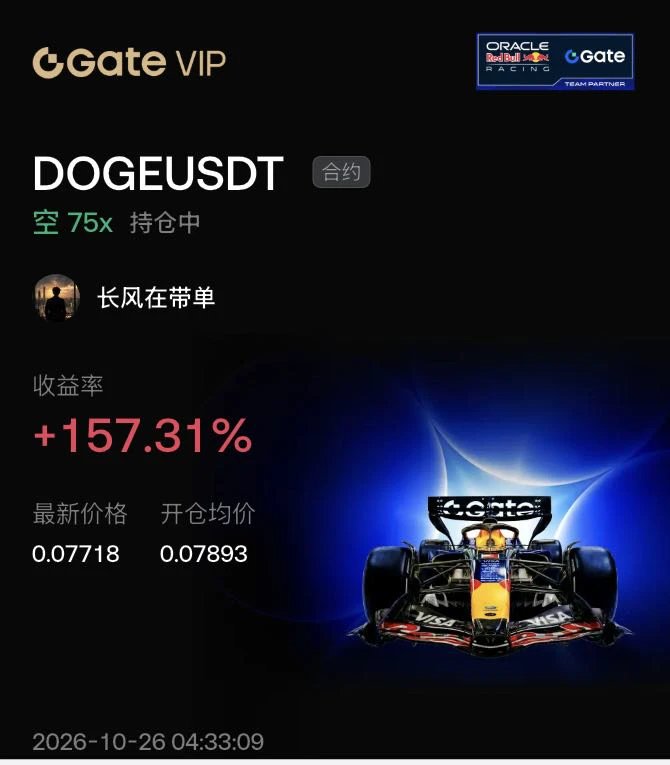
I mentioned this once: $DOGE at this level, a breakdown is a matter of time, not direction.
75x short, entered at 0.07893, current price 0.07718, down 2.2%, unrealized profit +157.31%.
To be clear: This unrealized profit is mainly due to 75x leverage, not a large price drop. MEME coin has clear overhead resistance and shrinking volume. After a breakdown, shorts get squeezed quickly, but a 2% drop could be wiped out at any time by a single rebound.
Technically, rebounds after a sharp drop in MEME coin are often even stronger. Once funding rates swing back in favor of longs, they counterattack.
post-image
DOGE-0.27%
SNDK+1.99%
  • 1
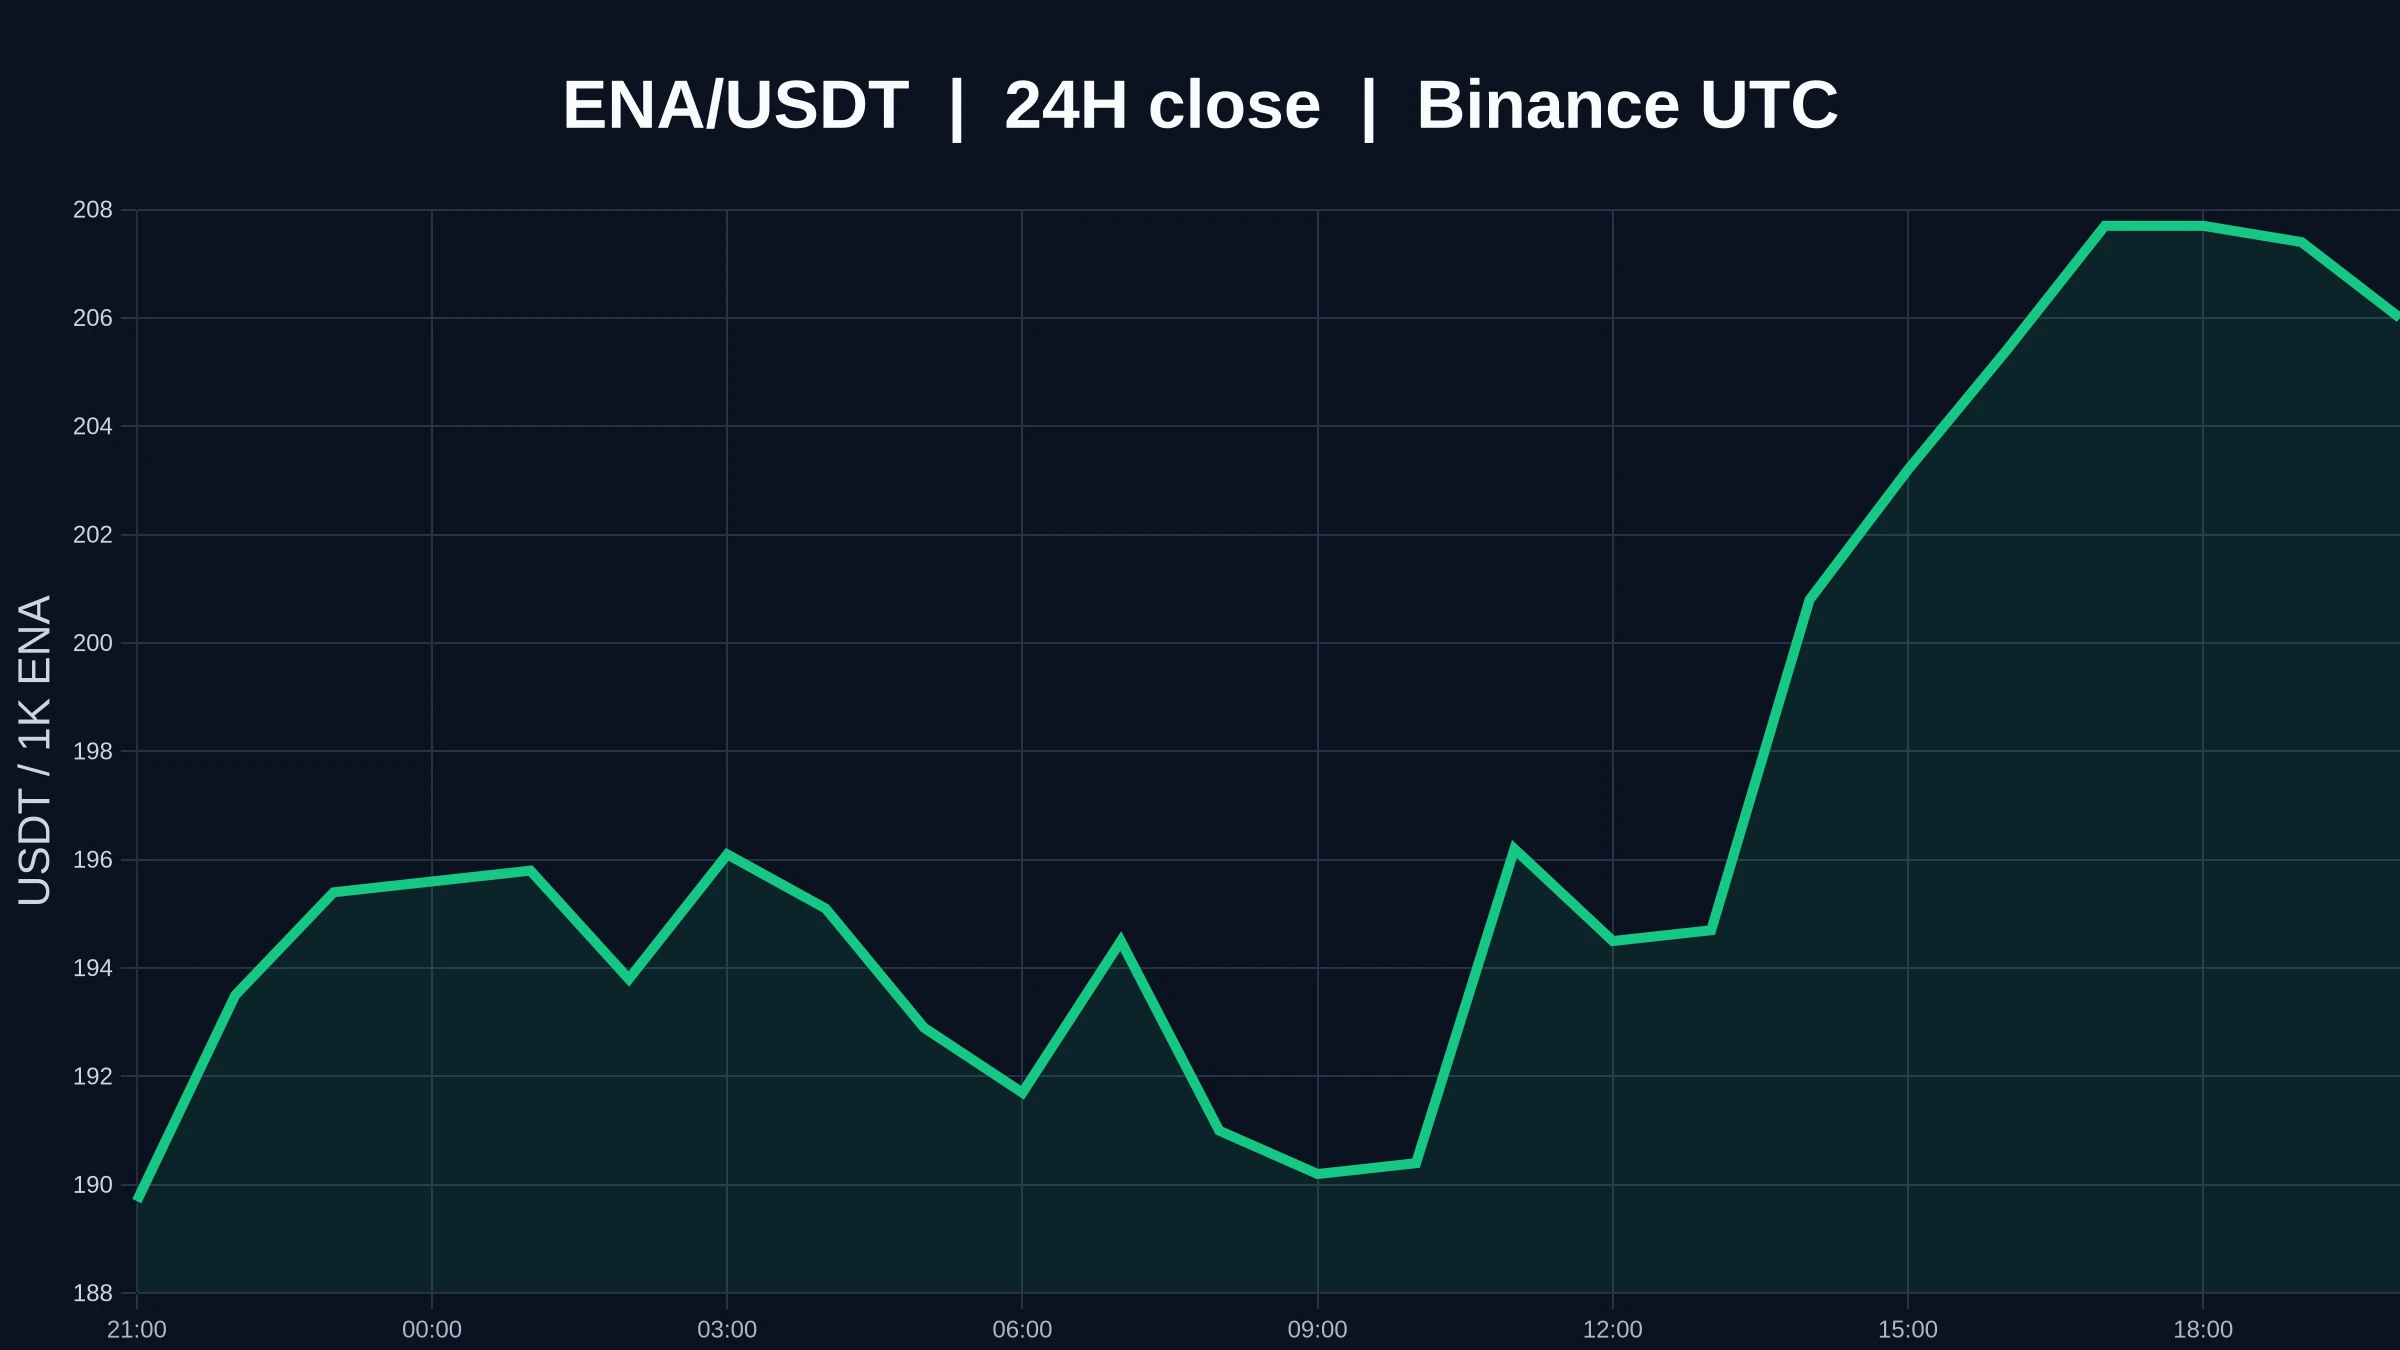
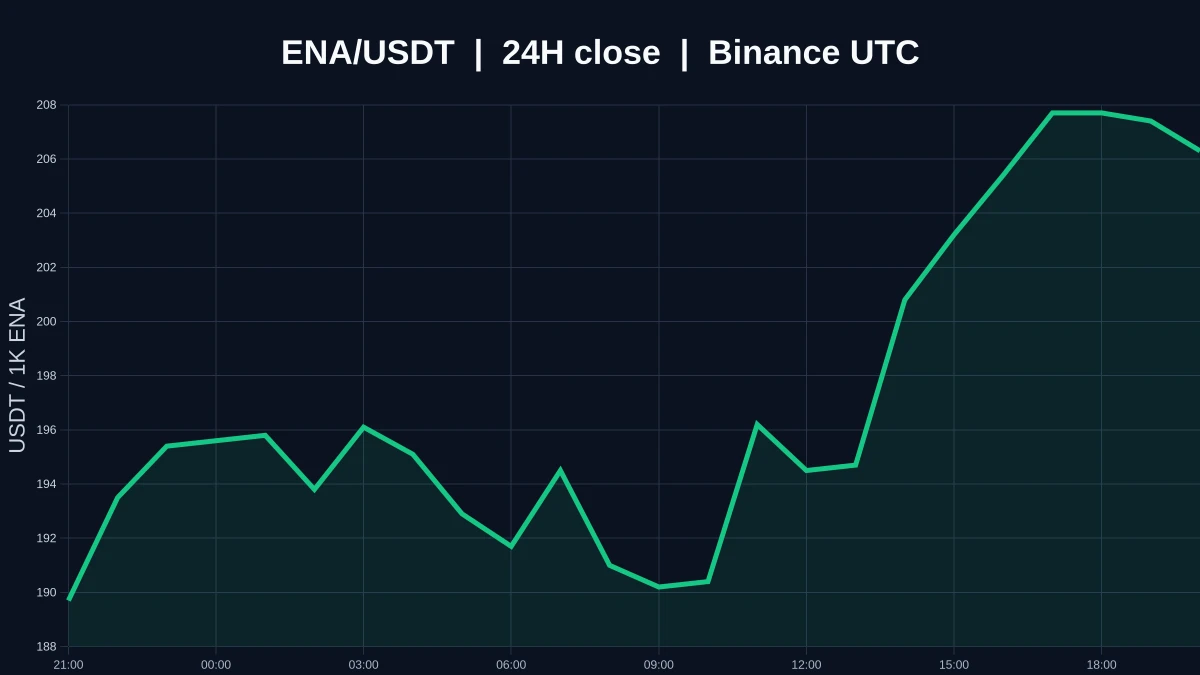
Treat $ENA as a question to be verified: current price 0.2059, up 8.88% over 24 hours, with participation at 0.05x. What is known is clear; what remains unknown is key: whether there will be real buying once key levels are reached. Here’s a simple rule of thumb: a sharp 24-hour rise or fall describes what has already happened; whether the next move can continue depends on whether key levels and trading volume continue to align. Gainers and losers lists record the past, and what’s most misleading is treating the past as the next move.
Don’t draw lines all over the screen. This time, just note
post-image
ENA+8.45%
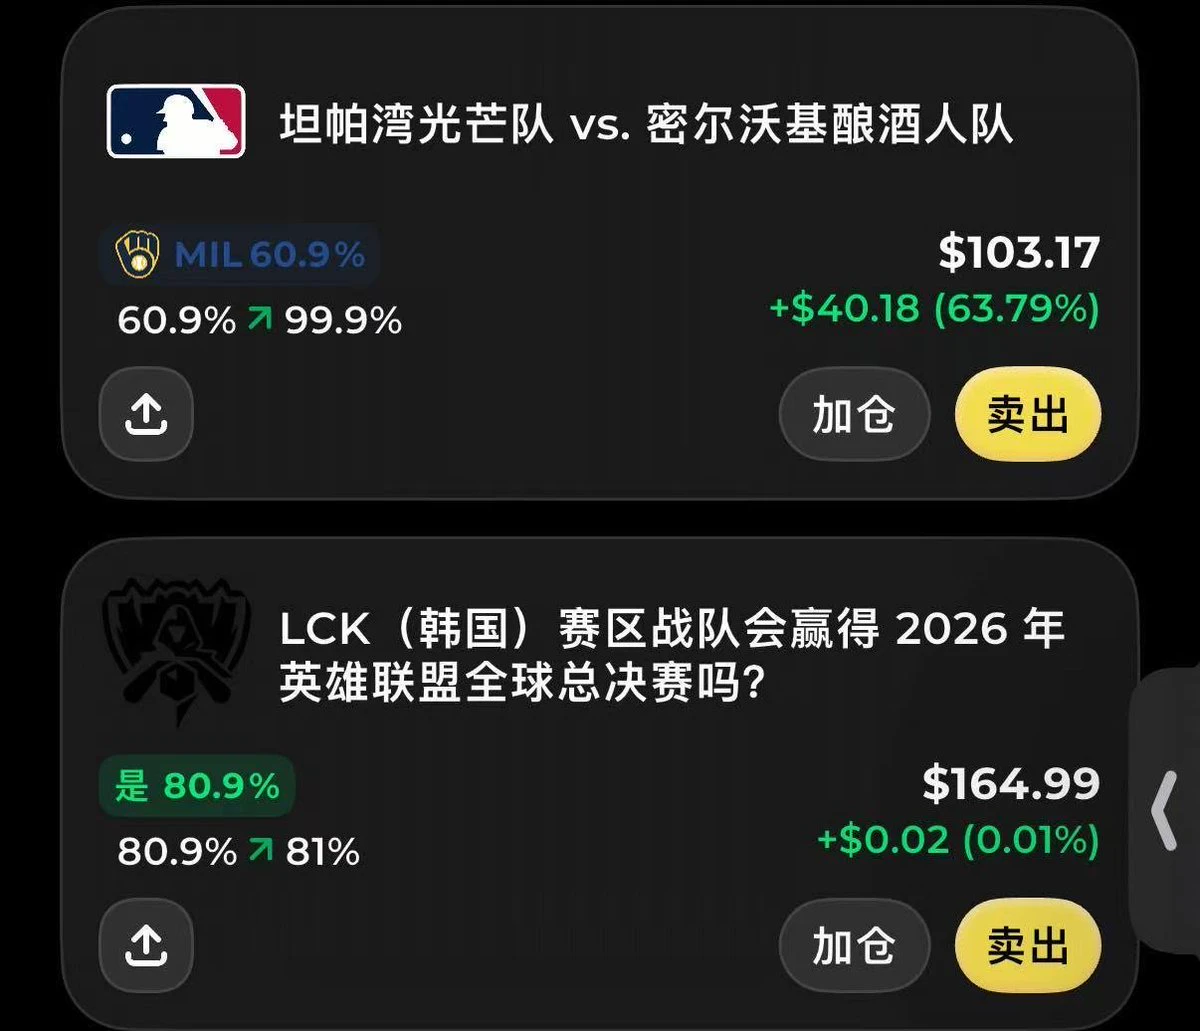
World Series Game 2 recap
Rays 4–5 Brewers (series 0–2)
Opening: The Rays dominated
Top of the first, Pratt’s throwing error opened the door,
consecutive hits + Liam Hicks’ two-run homer,
and suddenly it was 4–0.
Middle innings: The Brewers grind out at-bats and rally
Contreras and Mitchell immediately clawed back 2 runs in the bottom of the first;
Aranda’s error in the fourth gave them another run, making it 4–3.
Frelick’s game-tying homer in the sixth,
then rookie Pratt’s opposite-field hit put them ahead in the seventh.
Actually, besides the champion being the Brewers from the National Leag
post-image
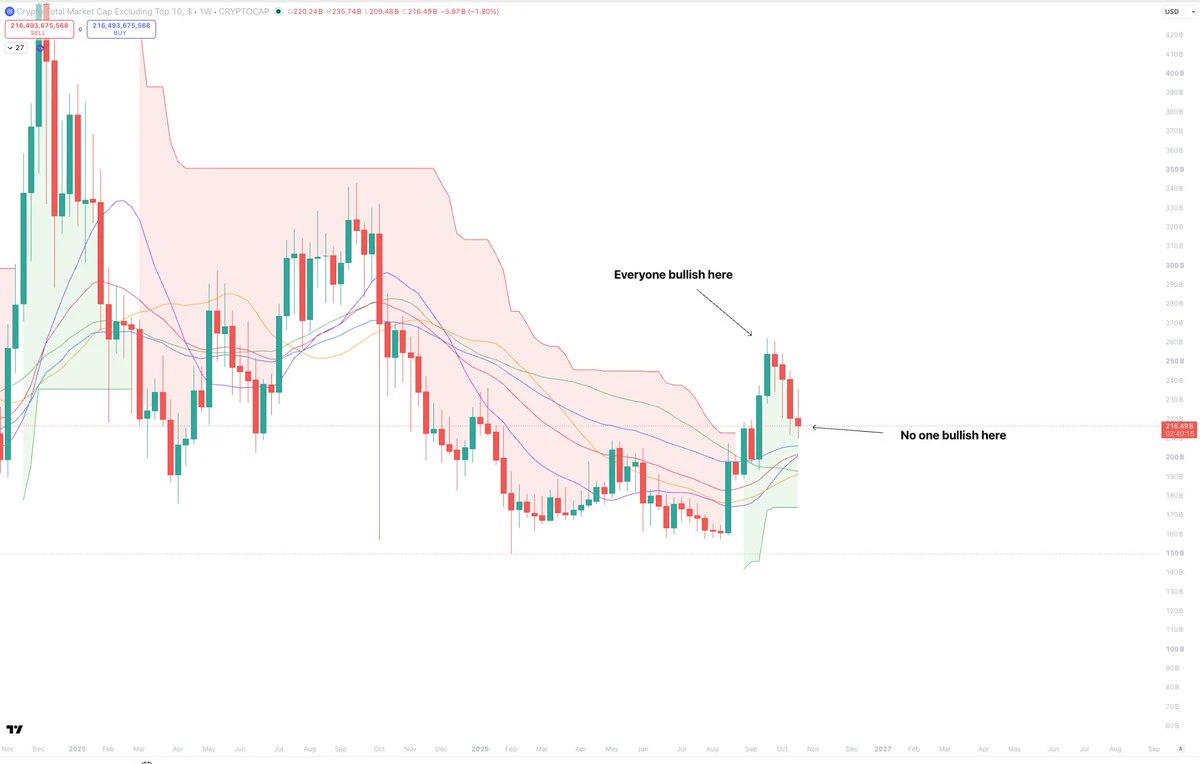
Altcoins also look great here.
It's looking like we're about to put in our 4th red weekly candle, and the crowd has turned very bearish again.
OTHERS is an a strong weekly uptrend, also has not retested any of the key EMA + SMA's yet, and is holding structure.
There is nothing bearish about this chart guys.
If you were not positioned, and then decided to buy the local top... but are not buying now, what are you doing here?
It is always the same old story.
Everyone bearish at the low
Then many bullish at the local high
Then everyone bearish again on the pullback
How can you ever sell higher if
post-image
Franklin Templeton, with $1.79 trillion under management, now has $56.10M of its BENJI money market fund on Arbitrum.
That is more than the $48.35M of the fund on Ethereum, one of eight networks it runs on.
@arbitrum
BENJI-1.11%
ARB+1.07%
ETH-0.08%
$ENA Current price: 0.2064, up 8.8% over 24H. The 1H trend is strong, with RSI at 74.8; the 4H trend is also relatively strong, with RSI at 49.2. Watch whether the price can hold above the 0.209 resistance and rebound after losing the 0.1887 support. Trading volume is only 0.28x the average, so confirmation is needed. Market volatility is high; for observation only.
post-image
ENA+8.45%
Crypto Trade Today
live-cover
LIVE792
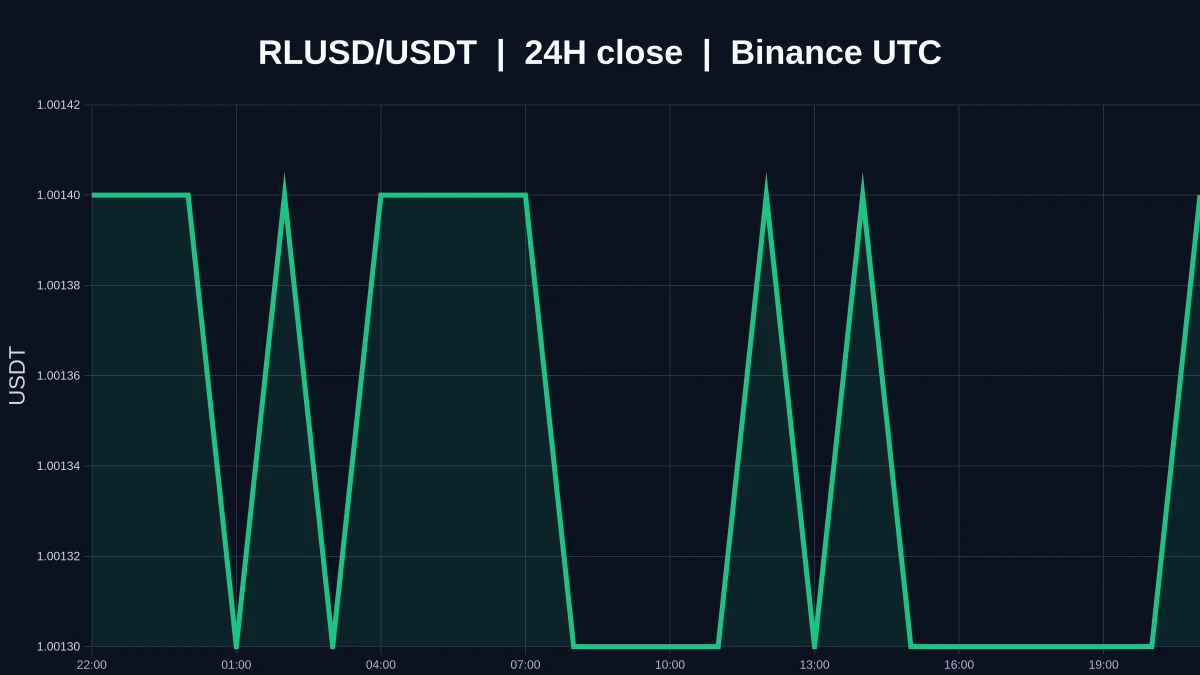
$RLUSD Currently quoted at 1.0013, 24H +0.00% (range: 1.0012–1.0015). The 1H trend is moderately strong, with RSI at 50; the 4H trend is moderately strong, with RSI at 62. If it holds above 1.0015, continue watching for upside potential; if it breaks below the 1.0012 support, the short-term structure may weaken. Market volatility is high; for observation only.
post-image
RLUSD+0.00%
$SNDK Consensus EPS is around $46.2, already above the top of the company’s $44 to $46 guidance range, yet the share price has slid from its 52-week high of $2,354.39 on June 22 to $1,238.03, a pullback of about 47%. Earnings estimates are still being revised upward, but the stock is already being priced as if the cycle has peaked. $MU $WDC
STX SKHY
First, the timing: results are due after the market close on October 29 Eastern Time, with the conference call at 4:30pm EDT, or 4:30am on October 30 Beijing time. AMZN and INTC are also reporting that night.
Let’s break down the numbers.
Fiscal Q
post-image
SNDK-1.90%
MU+2.39%
WDC-2.93%
STX-1.81%
SKHY+4.01%
#Altcoins dominance is breaking out
post-image
Market update BTC
live-cover
LIVE447
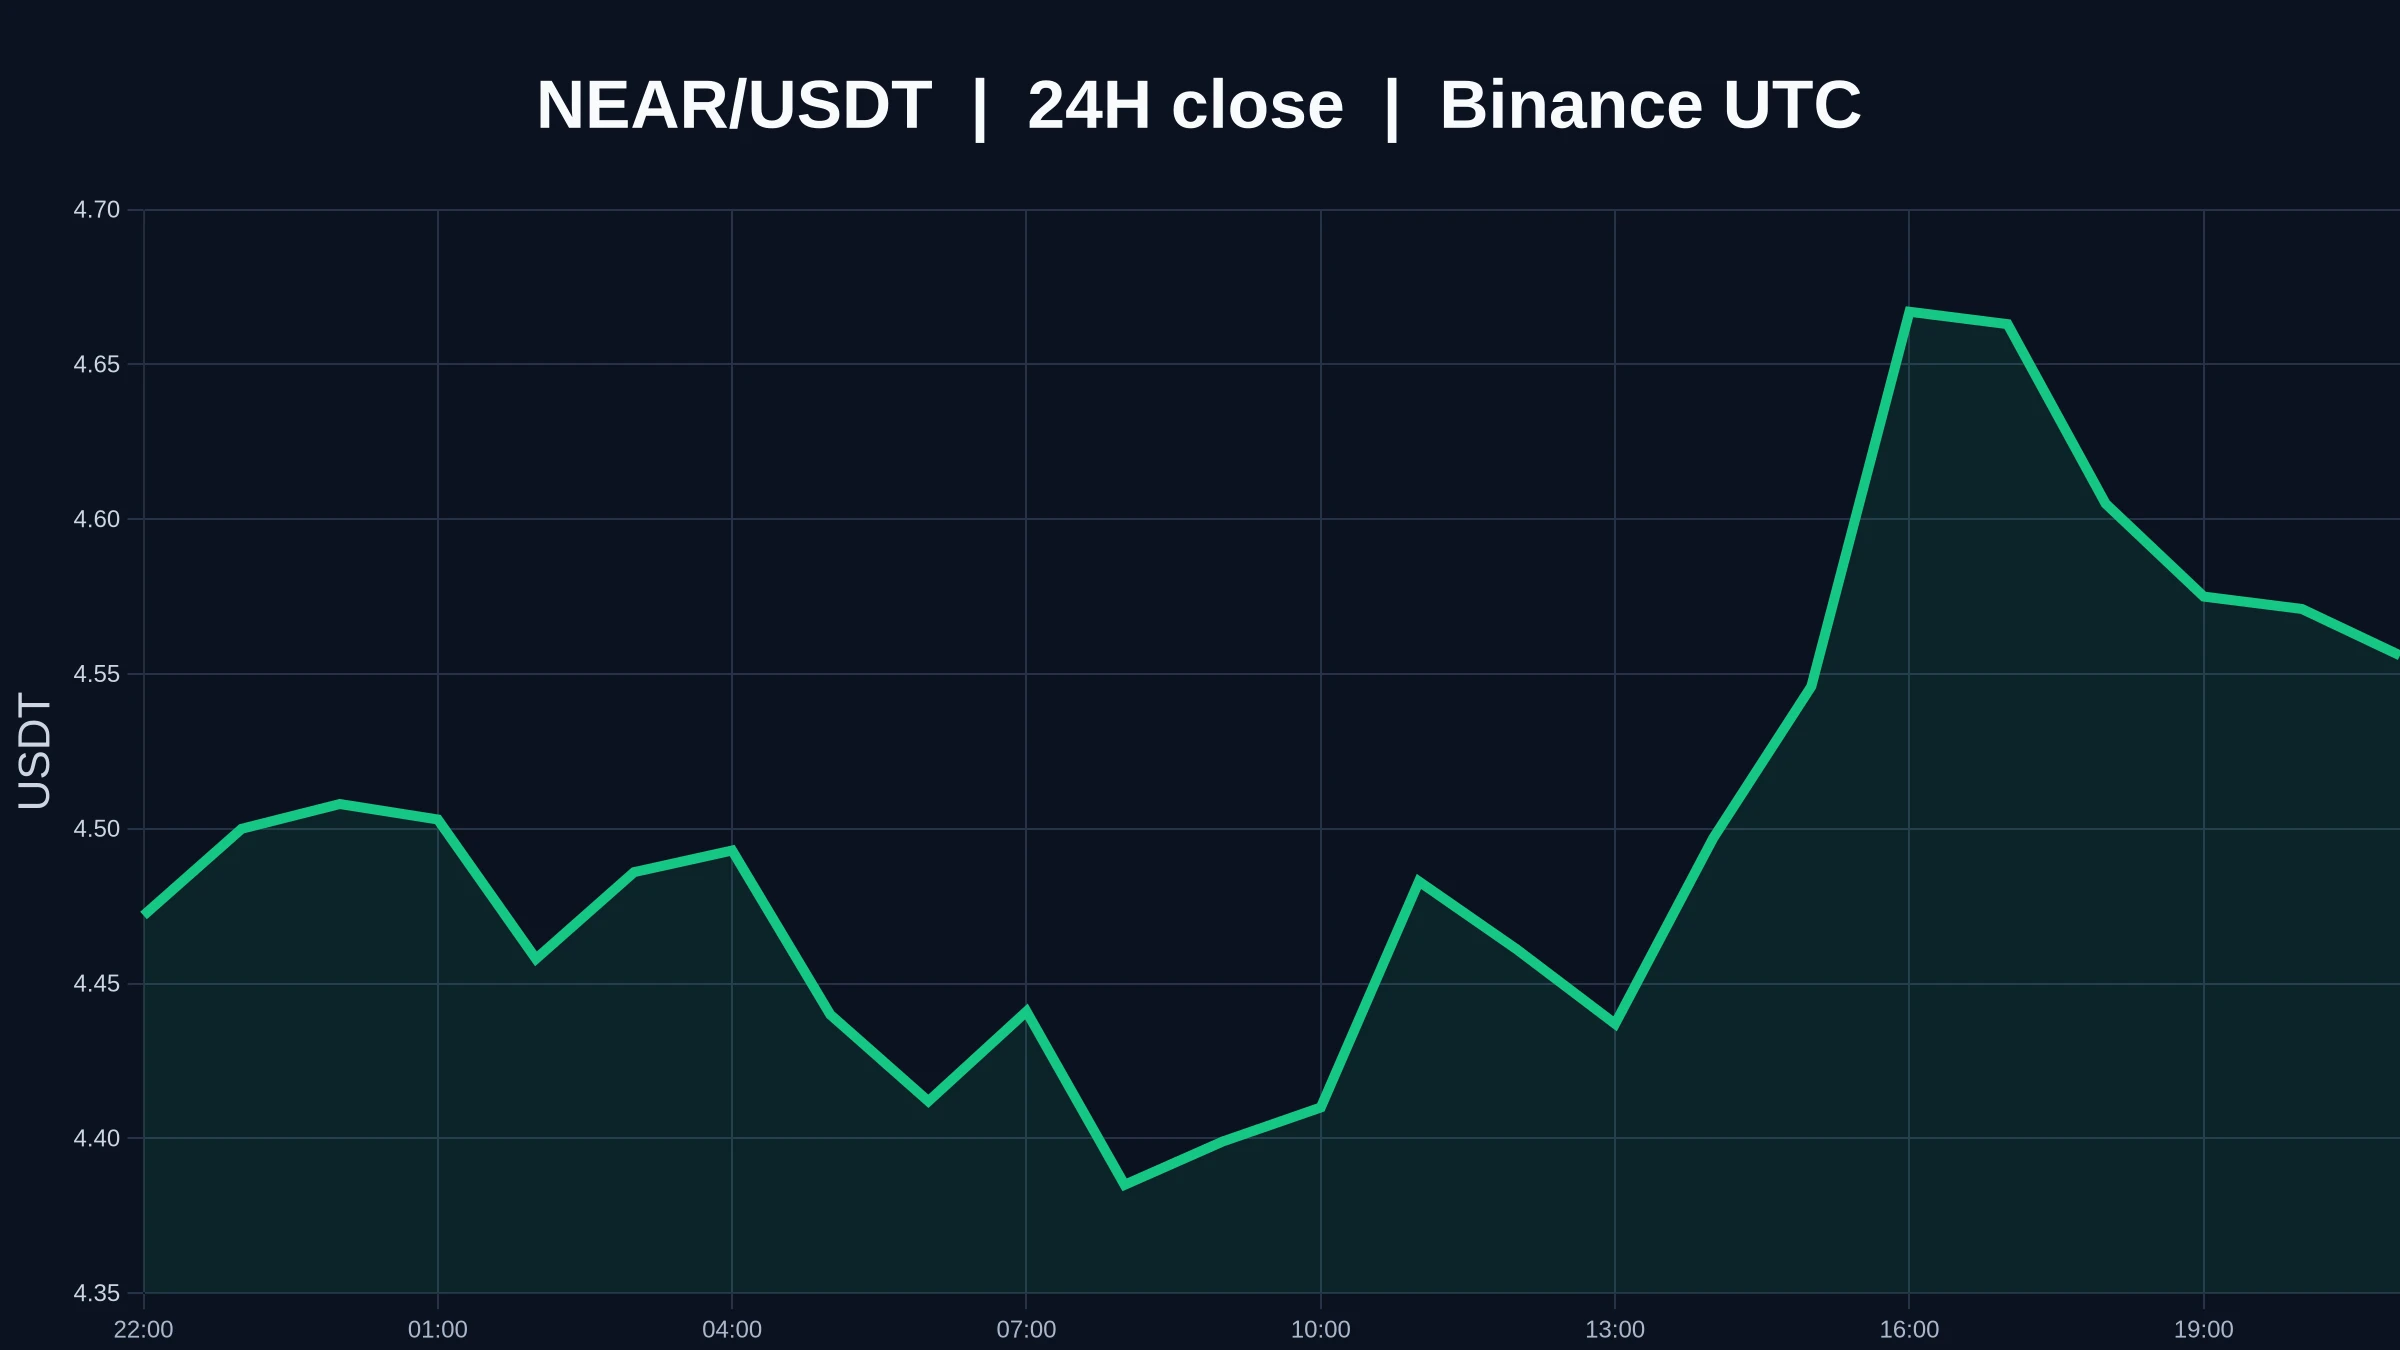
$NEAR Diverges Between Short and Long Timeframes: Which Will Change Direction First?
$NEAR is currently trading at 4.56 USDT, up +2.98% over 24 hours, and fluctuating between 4.351 and 4.699. The 1-hour support is at 4.351, with resistance at 4.699; the 4-hour direction is weak, and trading participation is only 0.10x. In this snapshot, the price has already broken above the 24-hour high, but volume has not increased significantly.
My view is that I’d rather see this as a direction that remains unconfirmed than rush to label it a rebound or a pullback.
Starting with the 1-hour chart, the pric
post-image
Guys, let me share my personal take on BTC

BTC is now around 80.5k. Saturday’s sell-off broke below 80k, briefly touching 79k before recovering—showing that neither bulls nor bears are willing to give up the 80k level easily.

My directional view is clear: bearish in the short term, watchful in the medium term.

Reason: 82k is clear resistance overhead; a rebound to that level would let trapped holders break even. If 79k gives way, price will test the deeper support at 75k.

So there are just three things to do:

- If it rebounds to around 82k, don’t chase; that’s a zone to reduce pos
BTC-0.03%
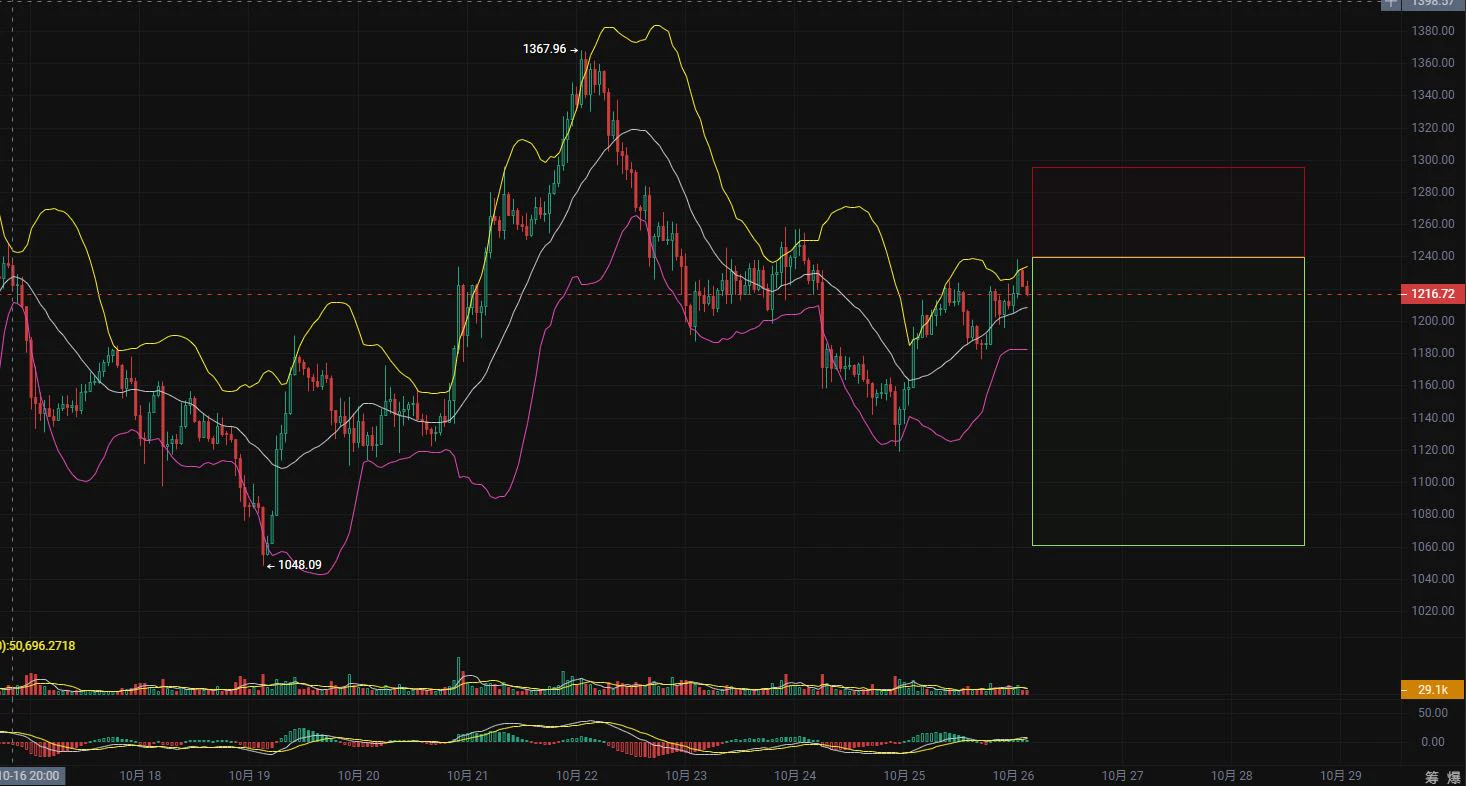
10.26 ZEC Long and Short Strategy (Public Version)
Long Strategy$ZEC
  Entry range: around 1080-1120
  Stop-loss defense: around 1040 (depending on entry price and position size)
Take-profit targets
  First target: around 1180
  Second target: around 1120
Third target: 1220 (in view if the second target is broken)
Fourth target: 1280 (in view if an evening trend develops)
Factors: The Bollinger Bands show signs of widening, and MACD is below the zero axis. As for market depth data, there are few large buy orders and more medium and small orders. Overall, retail traders
post-image
ZEC+0.64%
BTC-0.03%
ETH-0.13%
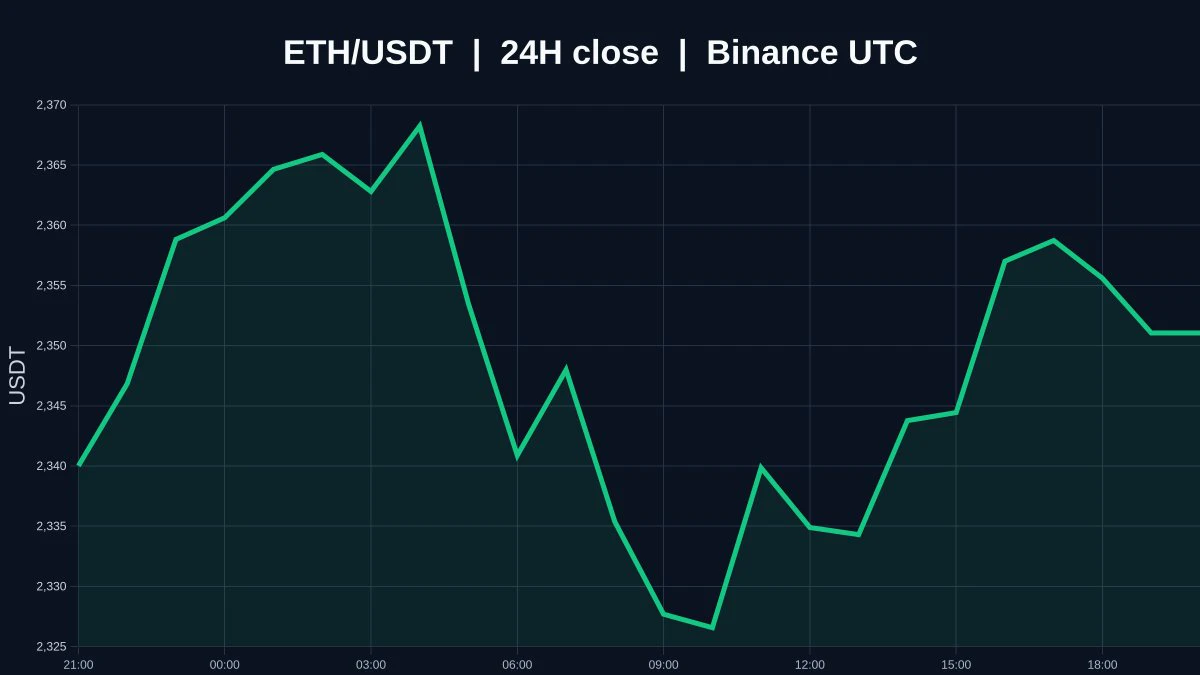
$ETH Currently trading at 2,351.05, up 0.35% over 24H (range: 2,318–2,371.52). The 1H trend is strong, with an RSI of 56; the 4H trend is weak, with an RSI of 35. If it breaks above 2,371.52 convincingly, watch for further upside; if it falls below the 2,318 support, the short-term structure may weaken. The market is volatile; for observation only.
post-image
ETH-0.08%
Load More

Join 40 M users in our growing community

⚡️ Join 40 M users in the crypto craze discussion

💬 Engage with your favorite top creators

👍 See what interests you

Trending Topics

USEarningsSeason

105.05k Views3.54k Discussing

The U.S. Q3 earnings season is in full swing, with major tech companies including Tesla and Meta reporting results. Market focus is shifting beyond revenue and profit toward AI spending, capital expenditure, margins and forward guidance. Which company’s earnings are you watching most closely?

GateWCTCS9GlobalTradingCompetition

738.16k Views8.12k Discussing

USConsumerSentimentNearRecordLow

13.15k Views306 Discussing

View More